Sometimes, when I mess around with the charts, I discover an entirely new approach that I had not thought of before. Last week saw one of those breakthrough moments when, for the first time ever, I applied the Special K to hourly charts and came up with some interesting results.
By way of background, I devised the Special K (SPK), which you can read about here, many years ago as a momentum indicator that could help identify primary trend changes relatively close to their turning points. It is calculated by adding a short to an intermediate to a long-term KST and expressing the result as one series on a daily chart. About 70% of the time, it does turn with the price, which is easy to spot with the benefit of hindsight. In real time, we have to use trendlines, peak and trough progression and moving averages to give us a more objective feel, as I discussed here earlier in this month.
Last week, for some reason, I found myself playing with the Special K in the hourly charts. I discovered that the indicator does not have much to say for a lot of the time. However, there are periods when, in conjunction with a reversal confirmation by the price, it identifies timely signals from an intermediate perspective. In this instance, I am assuming that an intermediate trend lasts on average between 6 weeks to as long as 9 months.
US Sectors
We start off with the iShares Russell 2k (IWM) ETF. Its SPK has just broken out of a six-month base, which suggests that the price will resolve its 2021 trading range with a break to the upside. All that's required is confirmation from the price with a new 2021 high, say, to $234.
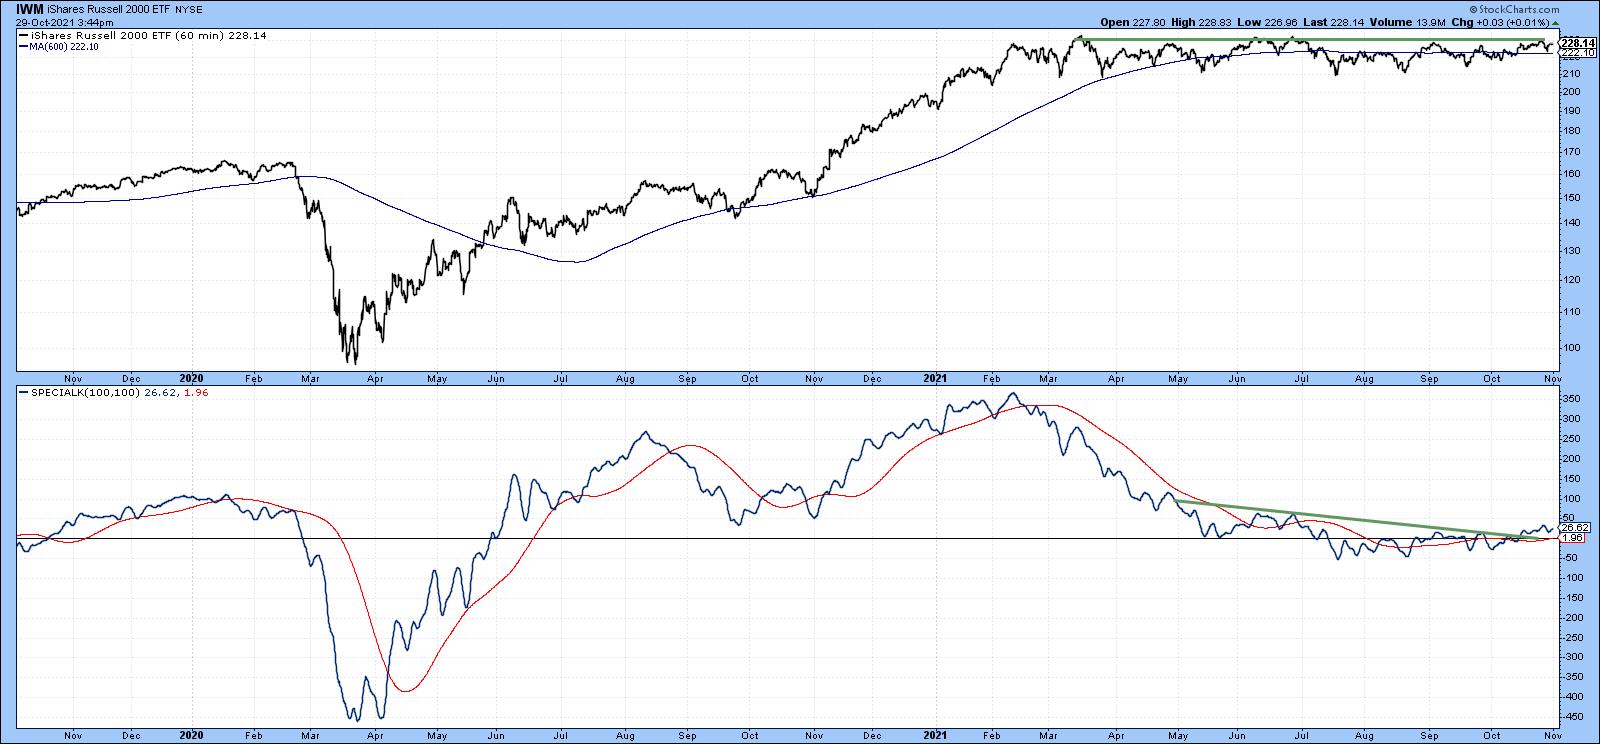 Chart 1Chart 2 features the XLF. Since we are monitoring intermediate trends, it's important to see that trendlines or bases extend for three months or longer. In the case of financials, we can see that the SPK has broken out from a 3-month base. This positive action has also been confirmed by the price, as it has managed to push through a 5-month resistance trendline. The chart also shows a sell signal in late May using this same trendline approach. Because the overall market advance had been so strong, subsequent intermediate correction took the form of a gently rising consolidation pattern, rather than a decline.
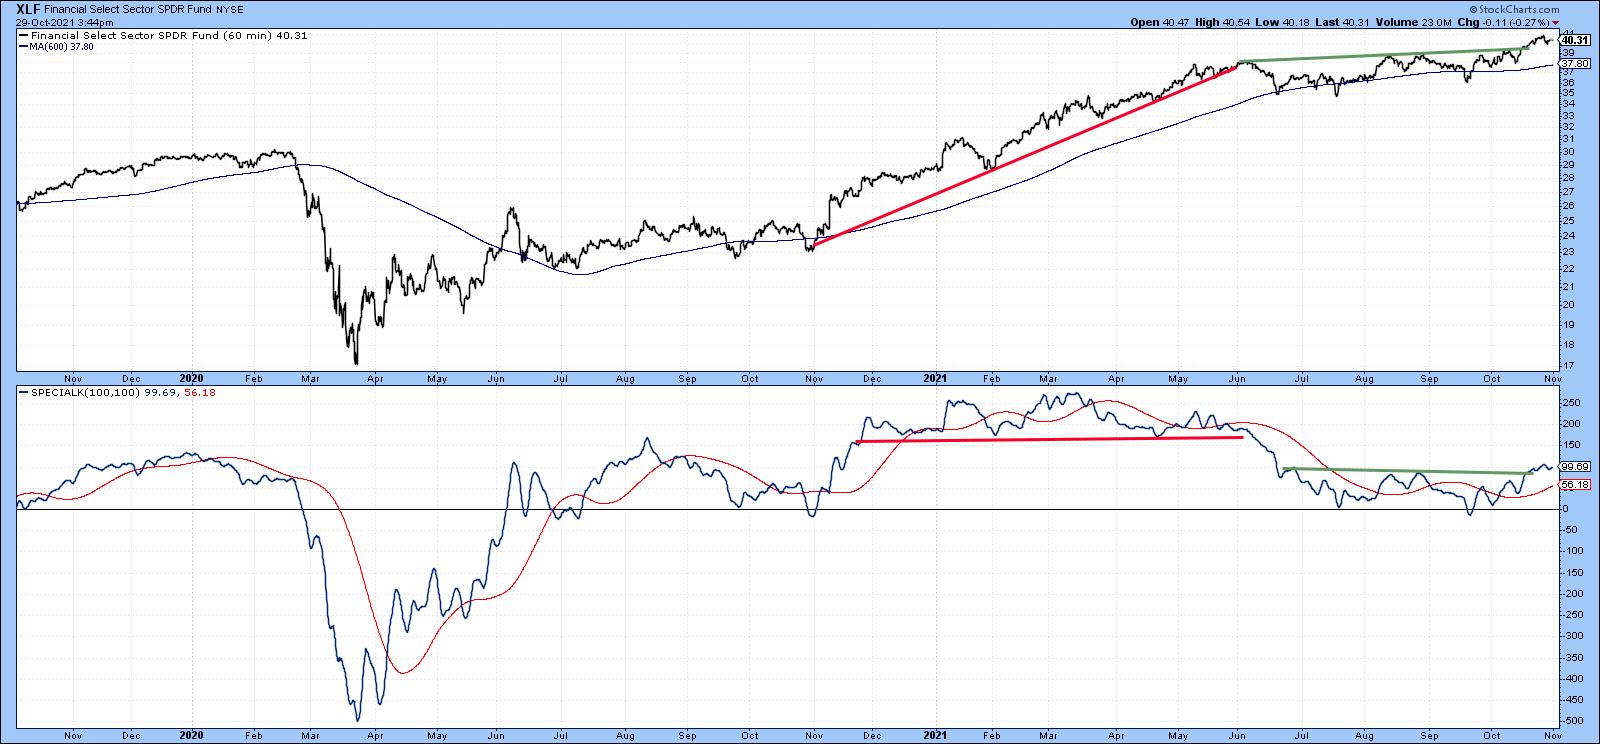 Chart 2International Markets
Chart 3 looks at the iShares MSCI Europe Australia Far East ETF (EFA), literally the world ex the US. Here we see a down trendline that began at the start of this year. It's worth monitoring because the SPK and price are pretty close to an upside breakout.
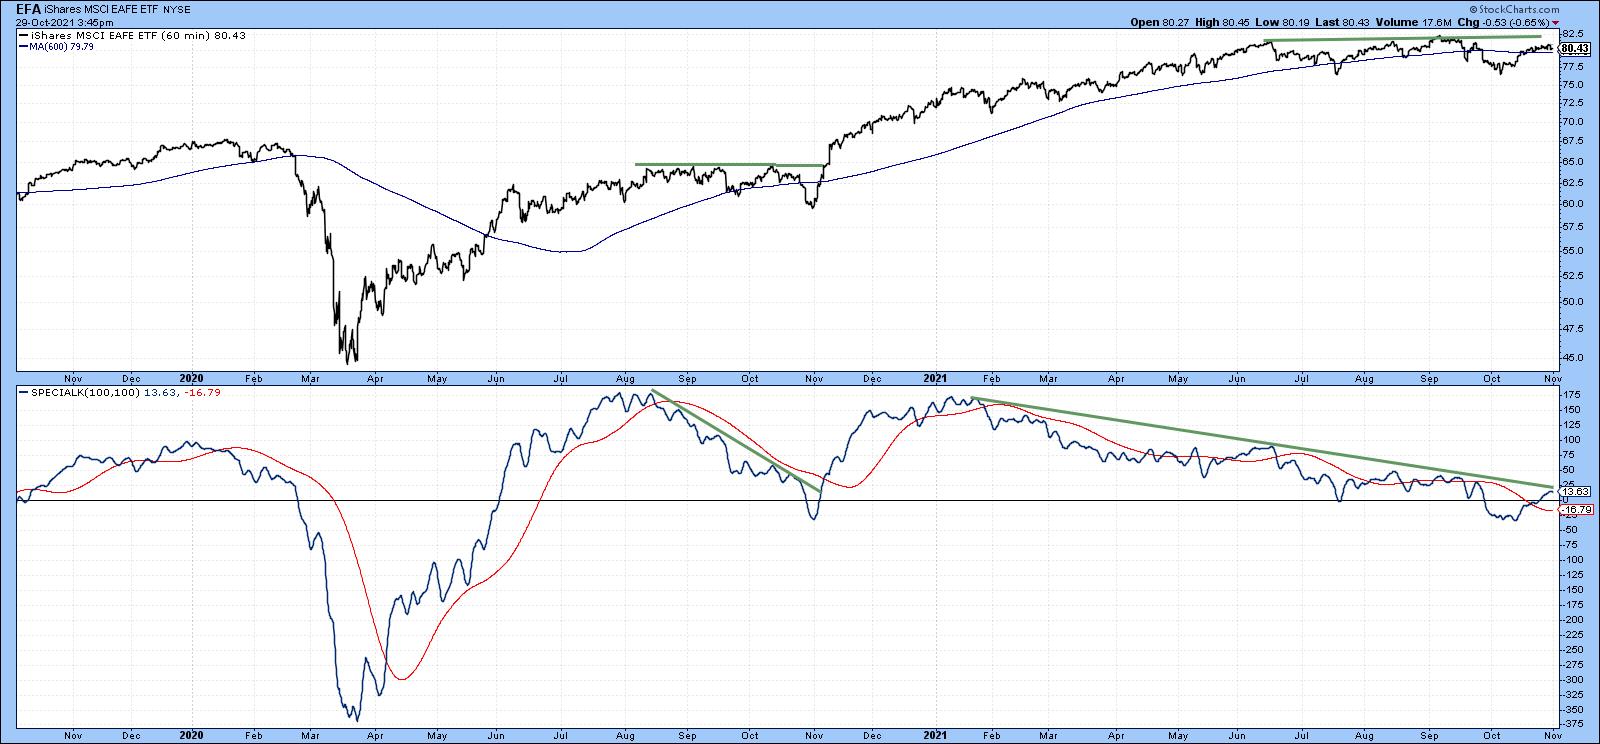 Chart 3One international ETF that has already broken to the upside is the iShares MSCI Pacific ex Japan (EPP). It has already violated two equivalent 2021 intermediate down trendlines. The SPK is also above its signal line, but that should not weigh as an important factor since it has triggered several false breaks recently.
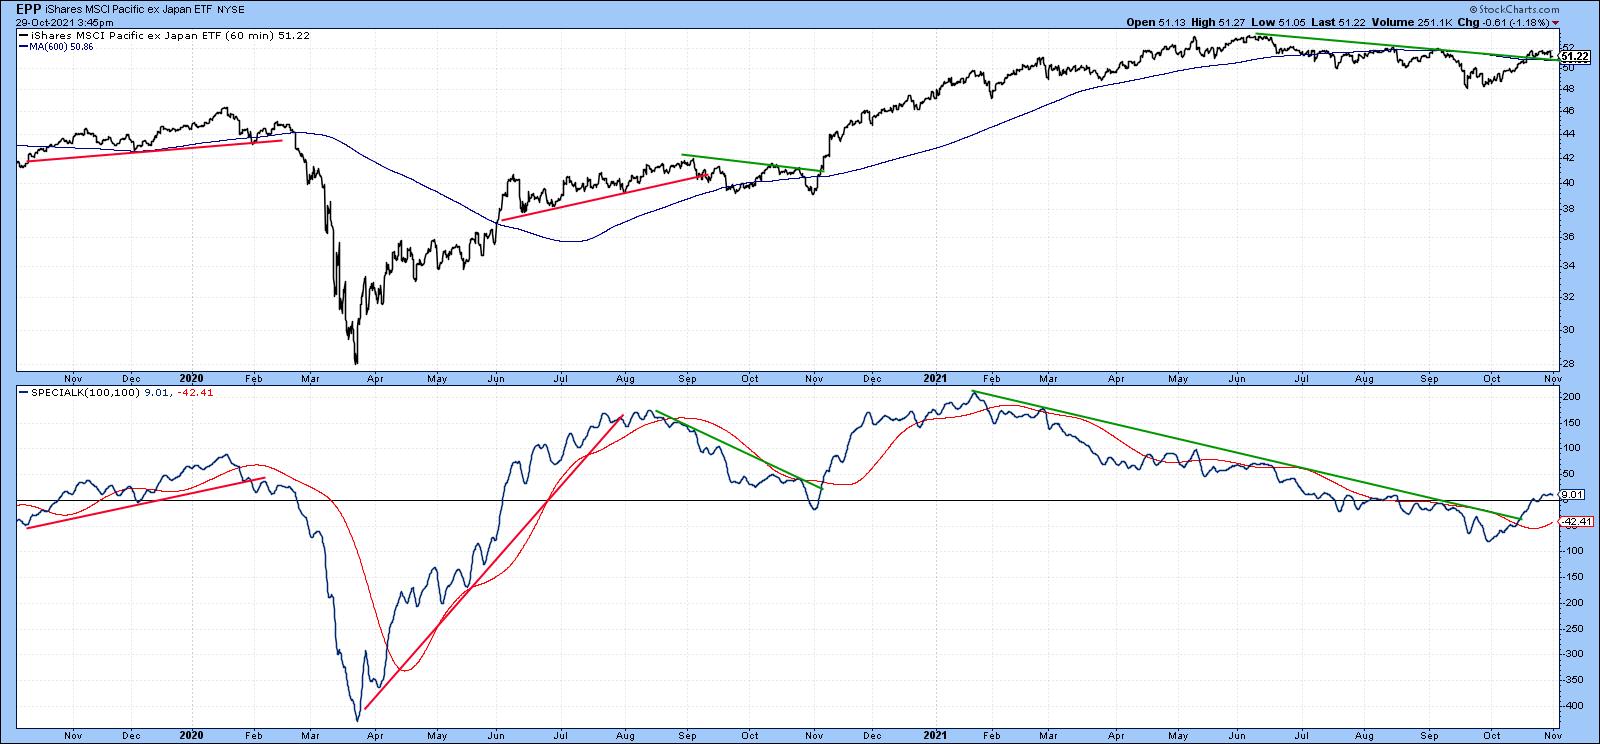 Chart 4Chart 5 shows that the iShares Singapore ETF (EWS) has been going sideways since the late spring. It experienced an SPK breakout a week or so ago and one more recently by the price itself.
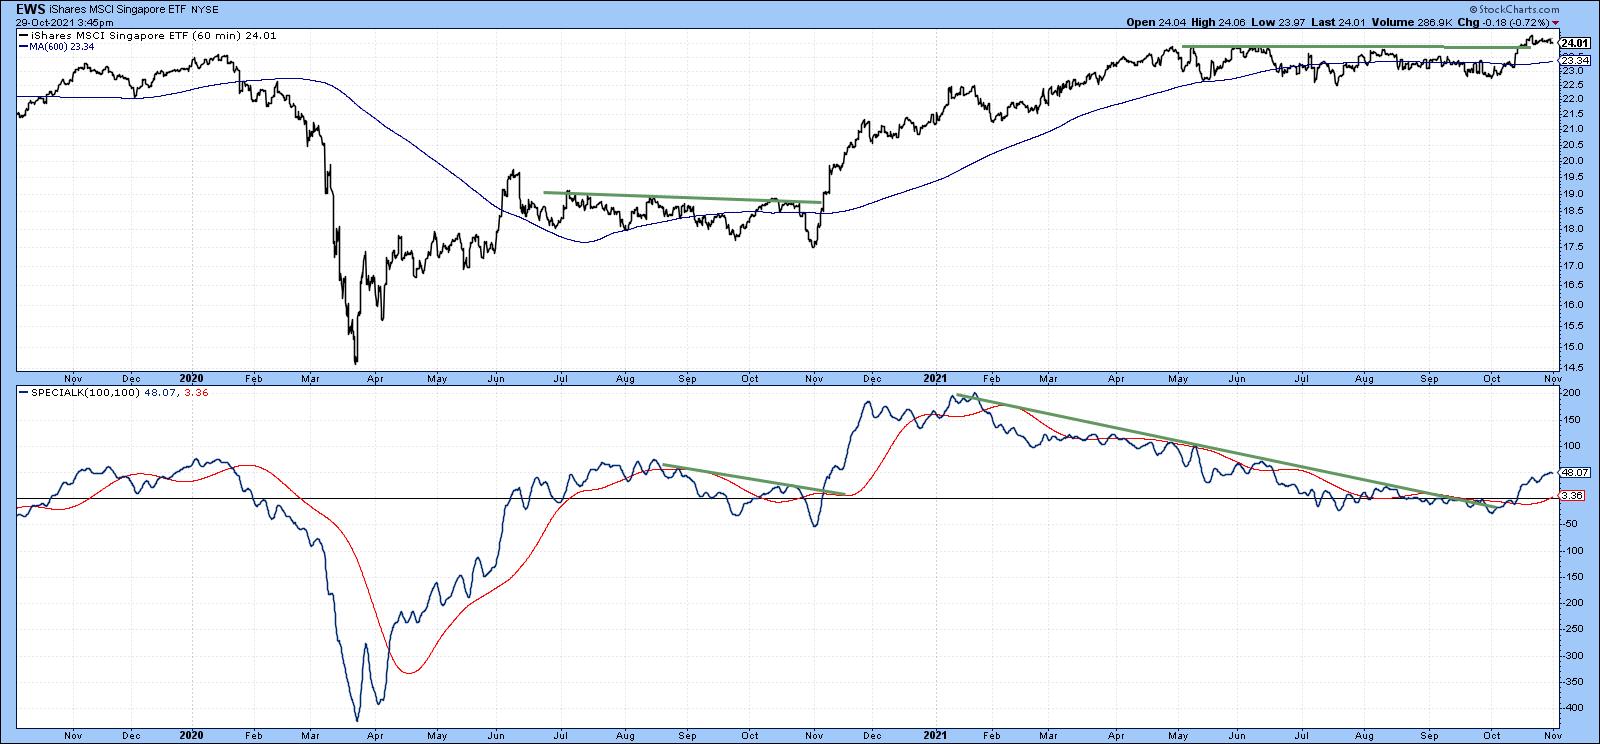 Chart 5The SPK for the iShares Brazil Capped ETF (EWZ) has experienced more volatile intermediate price movements than most other country funds. In that respect, the dashed green and red arrows flag the eight intermediate price movements that have developed since late 2019. Chart 6 shows that its SPK has been contained by a 4-month down trendline and is now somewhat oversold. The signal line has also called the last six intermediate reversals without a whipsaw, so the fact that the trendline and signal line for the SPK are in the same vicinity indicates how important they are as a resistance point.
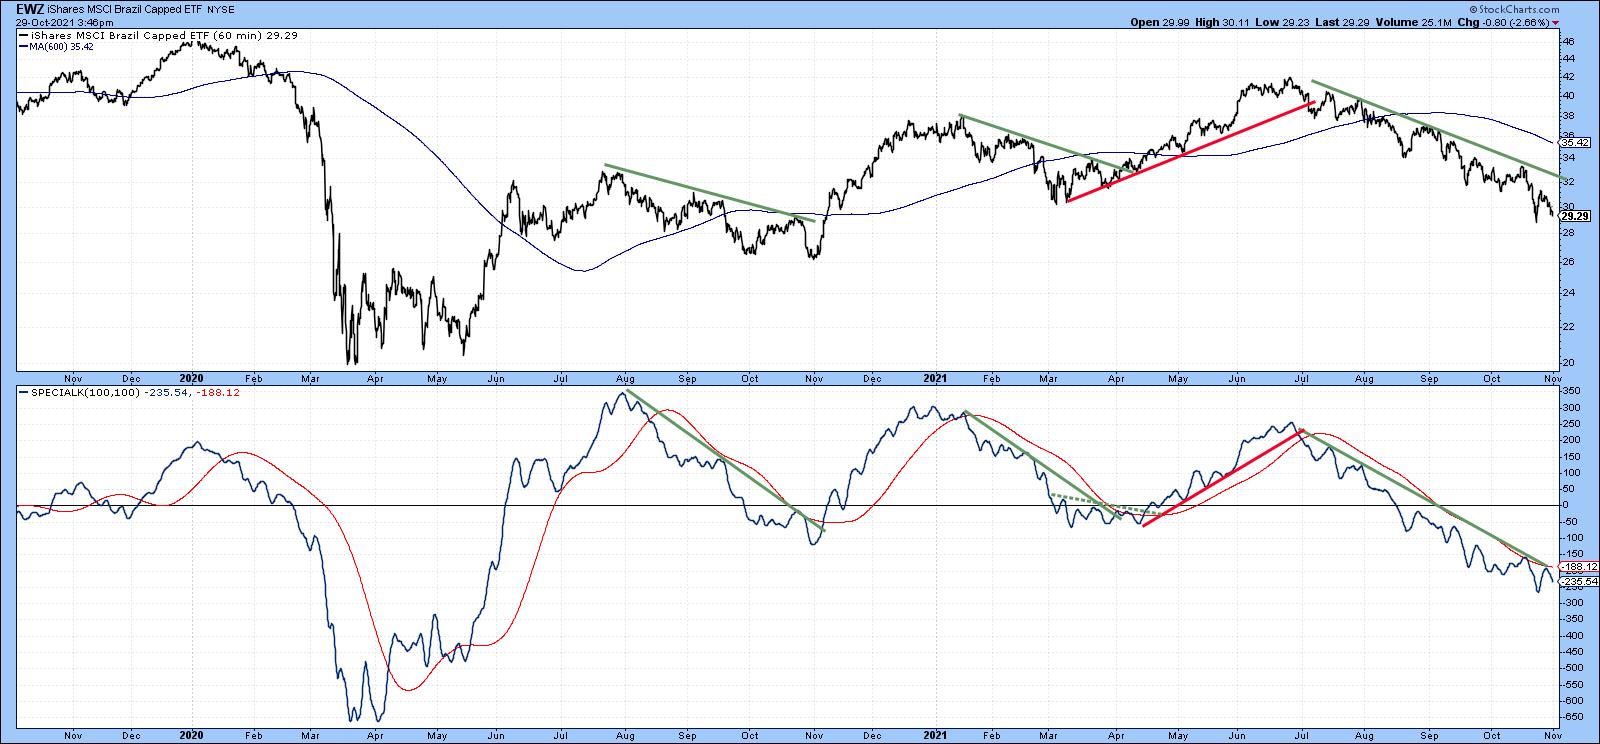 Chart 6Commodities, Gold and the Dollar
Chart 7 presents us with a potential breakout for the Invesco DB Agricultural Fund (DBA). The price itself is caught between two converging trendlines, as is its SPK. The green momentum trendline is more significant than the red one due to its greater length and the fact that it has been touched or approached on numerous occasions. Note also that the red up trendline for the price is intersecting with the 200-day hourly MA. Whichever way this ETF breaks is likely to determine the direction of the next important move. My expectation is for a continuance of the bull market, but, as always, let's allow the market to return a final judgment.
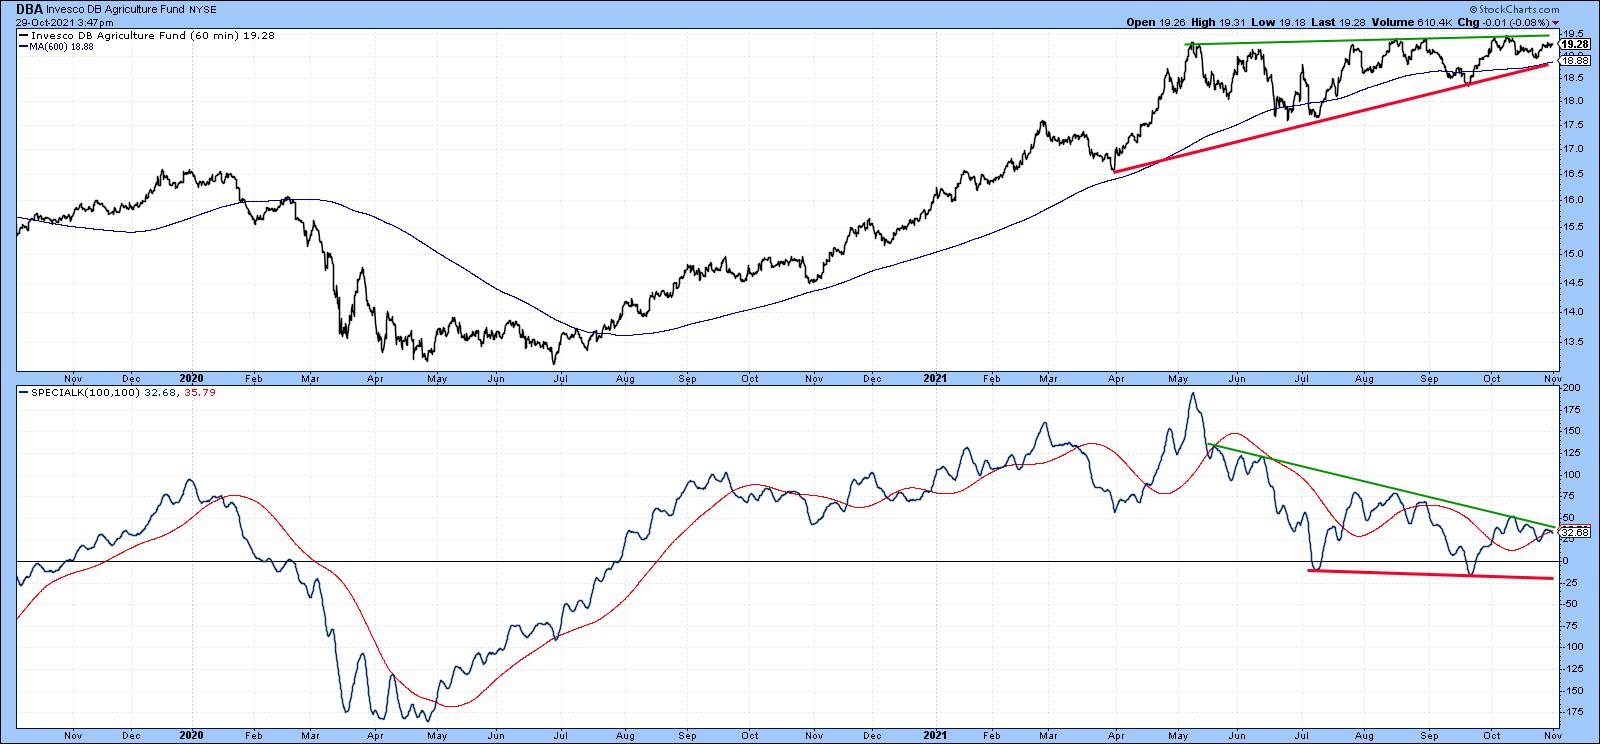 Chart 7The SPDR Gold Shares (GLD), Chart 8, could be in the process of making a recovery. If we ignore the false June upside break, the GLD has busted through its 2020-2021 corrective trendline. The price has not yet done so and needs to close above that $170 level in order to confirm momentum action.
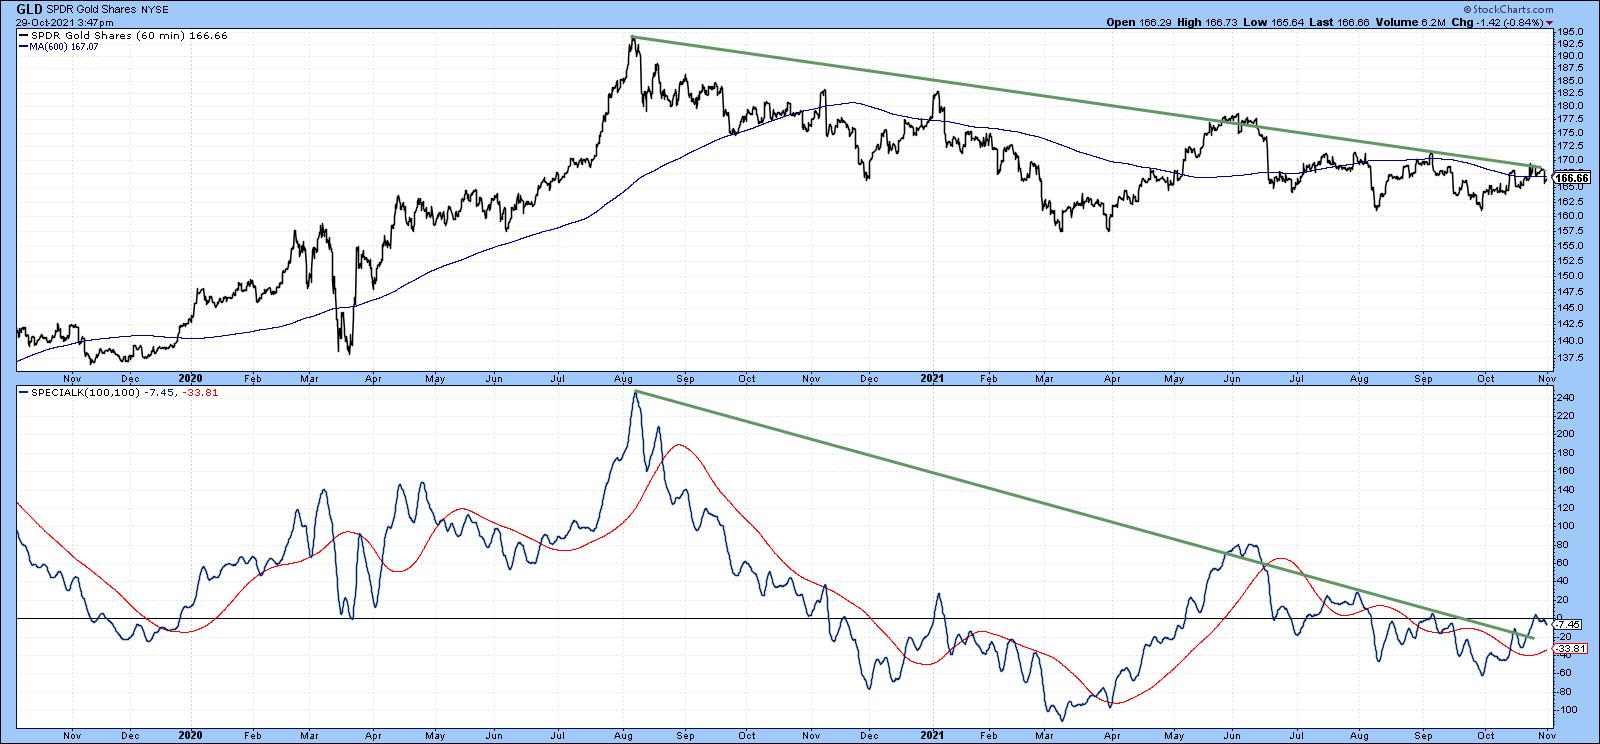 Chart 8Chart 9 puts us in a quandary, because the Invesco DB US Dollar Bullish Fund (UUP) is sporting an uptrend. That seems inconsistent with a rising gold price. However, there have been limited periods when they have both risen together. Indeed, a Global Gold Index, which I calculate from euro, yen and dollar measures, is currently bullish. The implication is that gold and the dollar may be able to rally simultaneously for a while. Nevertheless, the UUP is at a fairly critical point, as it and the SPK are both resting on a key up trendline. If they are decisively violated, it would suggest that the Dollar Index had begun a period of re-accumulation or an actual decline.
Remember, any of these charts may be updated by simply clicking on them. They are not recommendations, but should be reviewed for additional investigation.
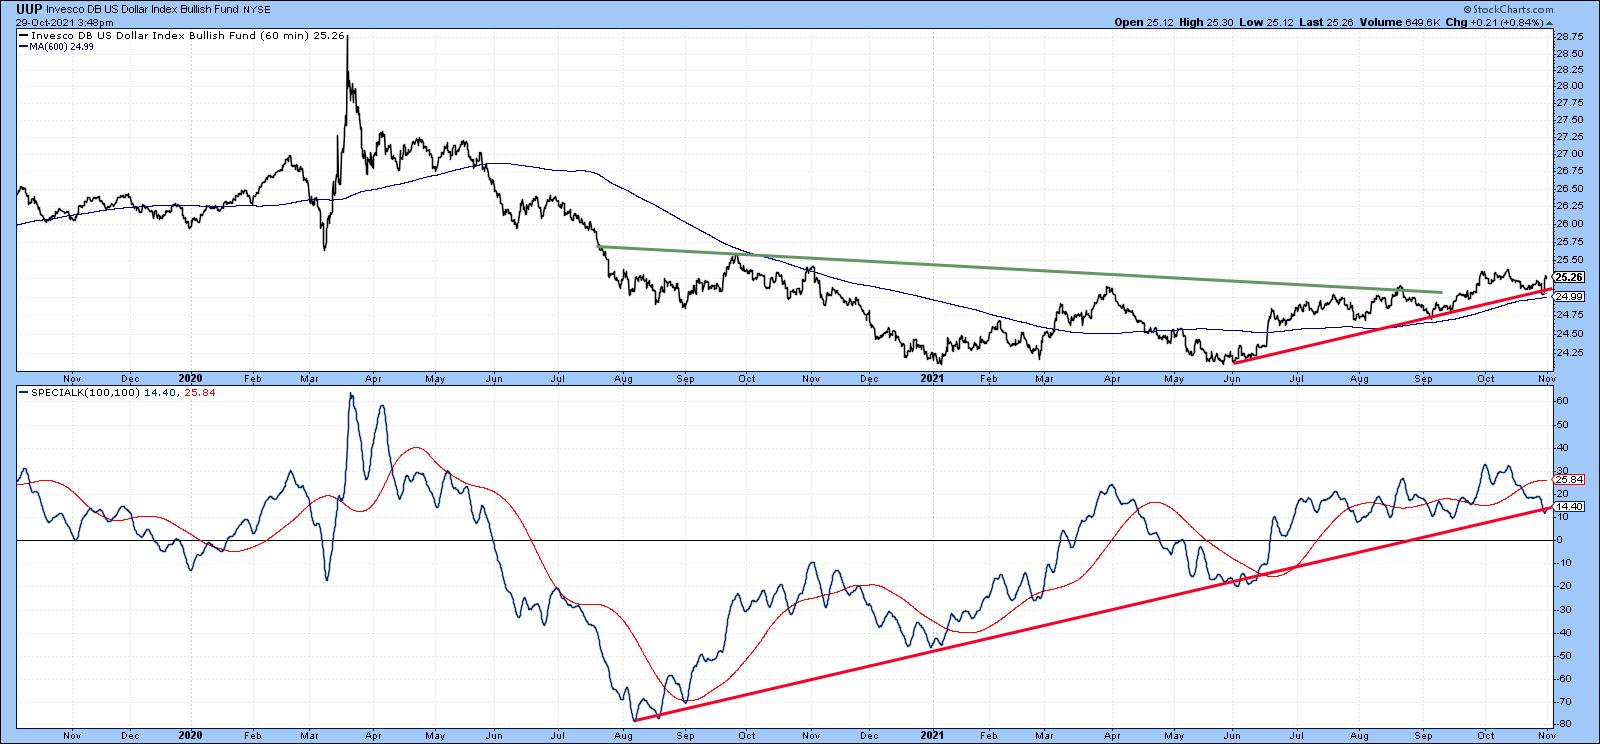 Chart 9Good luck and good charting,
Martin J. Pring
This article is an updated version of an article previously published on Tuesday, November 9th at 5:06pm ET in the member-exclusive blog Martin Pring's Market Roundup.
The views expressed in this article are those of the author and do not necessarily reflect the position or opinion of Pring Turner Capital Group of Walnut Creek or its affiliates.


