Last week, the Fed announced that tapering is likely to begin later in the year, to be later followed by a leisurely hike in rates. As usual, those pesky impatient markets have decided to raise rates now rather than wait for the clobbering they know they will get later. It can all be seen in the charts and it's happening across the board except for money market yields, which is the area that the central bank controls best.
Five-Year and Lower Maturities
Take Chart 1, for instance, which features the 5-year yield together with its long-term KST. I am starting off with this maturity as it, to some extent, forms a bridge between short- and longer-term ones. The yield was already above its 12-month MA, but the process of registering a new recovery high has begun a series of rising peaks and troughs. Since this is a monthly chart based on month-end closes, the latest one won't be official until Thursday's (month-end) close.
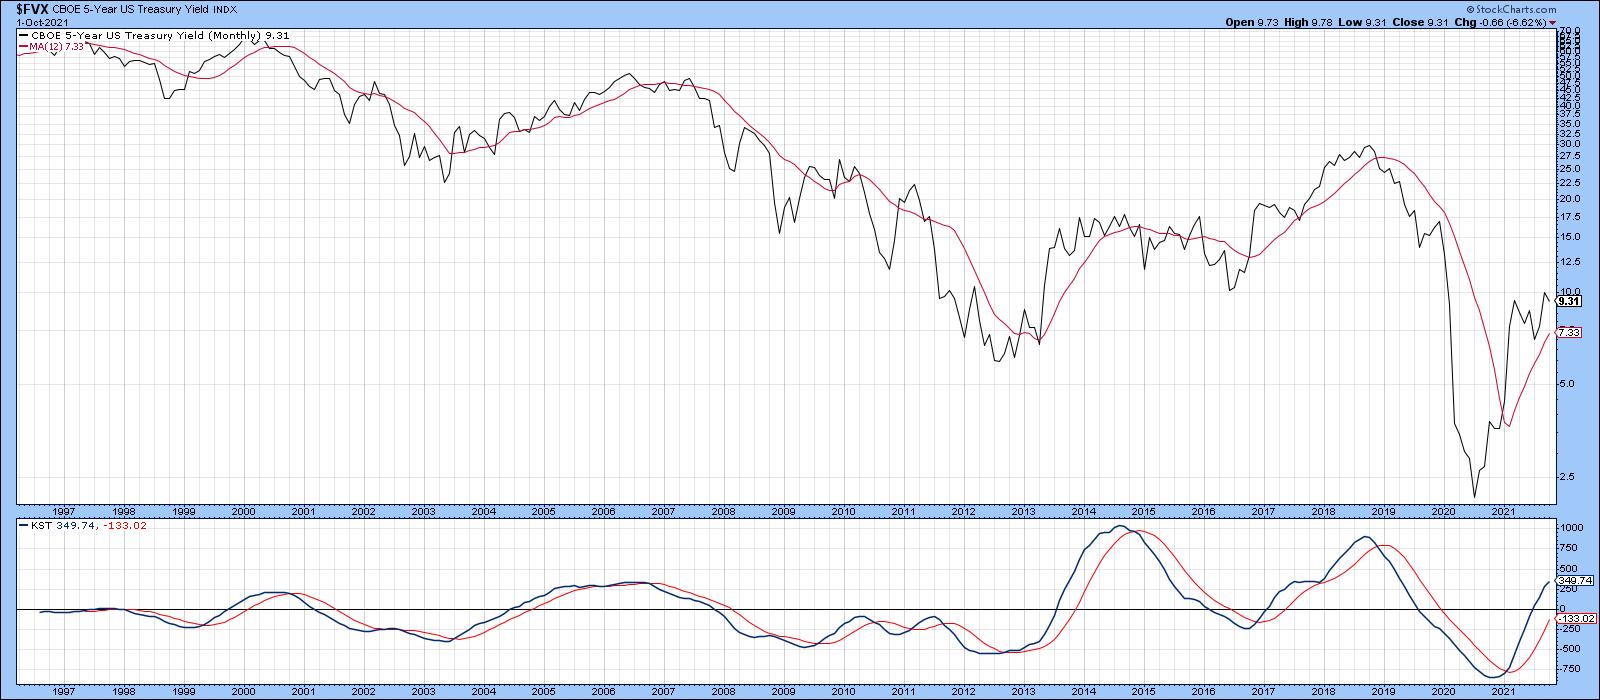 Chart 1
What is already official, though, is the fact that the yield has broken out on a weekly basis, as shown in Chart 2. Note also that the 9-week RSI has cleared its 6-month down trendline.
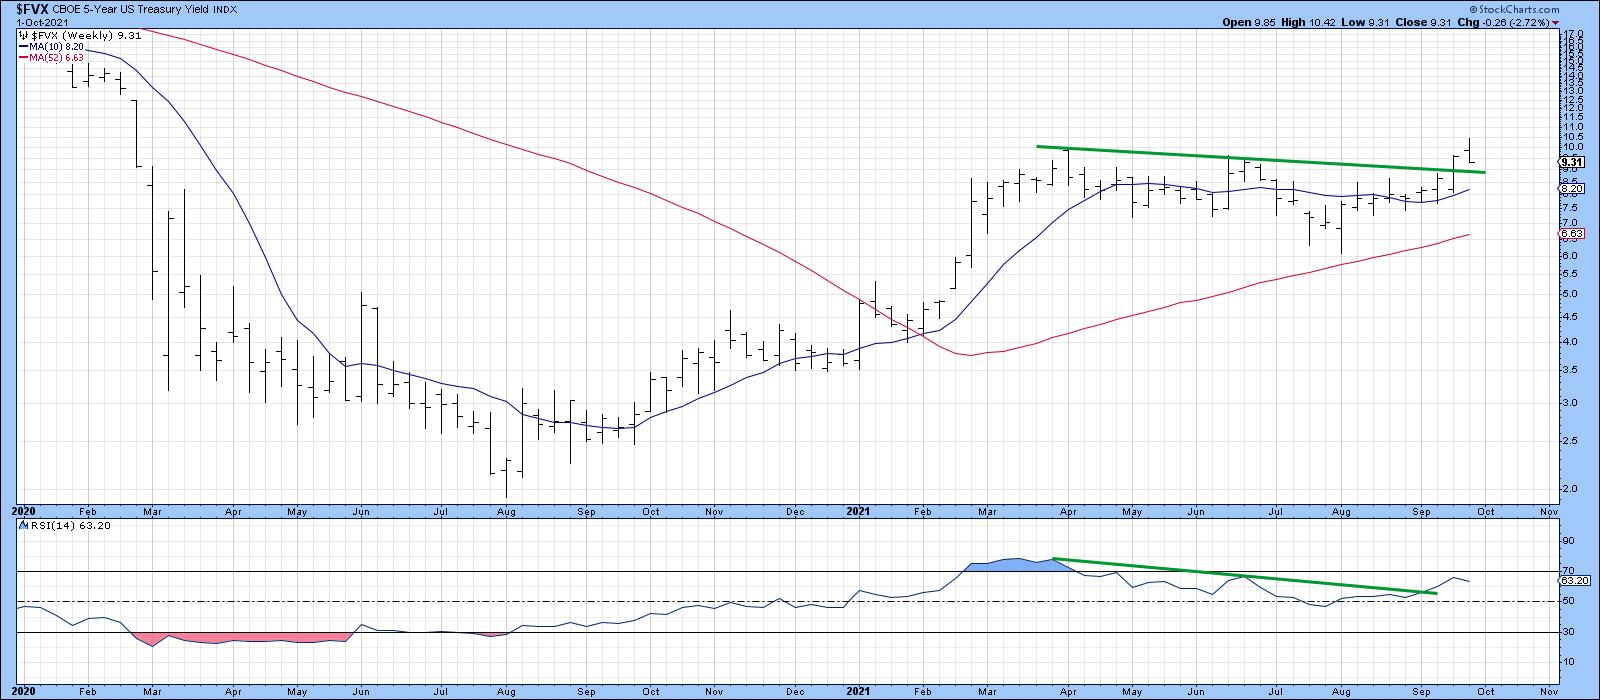 Chart 2Moving down to the 2-year maturity, which typically moves ahead of Fed policy changes, we see that recent action has caused it to edge to a new recovery high. It will encounter some resistance at the 65-week EMA, but the unanimously bullish KSTs suggest that it won't have much of a problem clearing it.
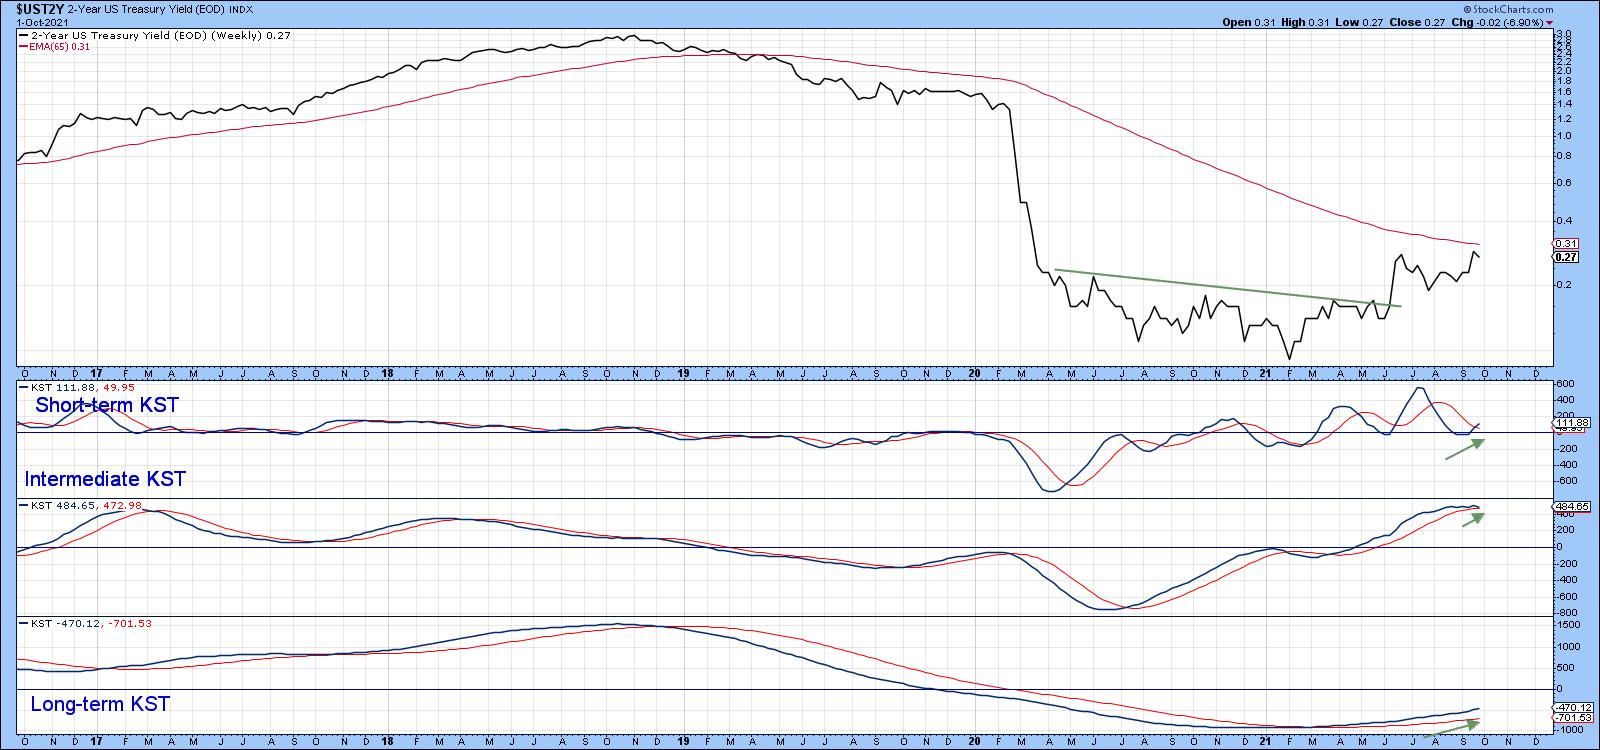 Chart 3Even the 3-month Libor, which is very much influenced by Fed actions, has started to perk up and currently sports three rising momentum series. That positive momentum suggests that the 2010-2021 down trendline will soon be breached.
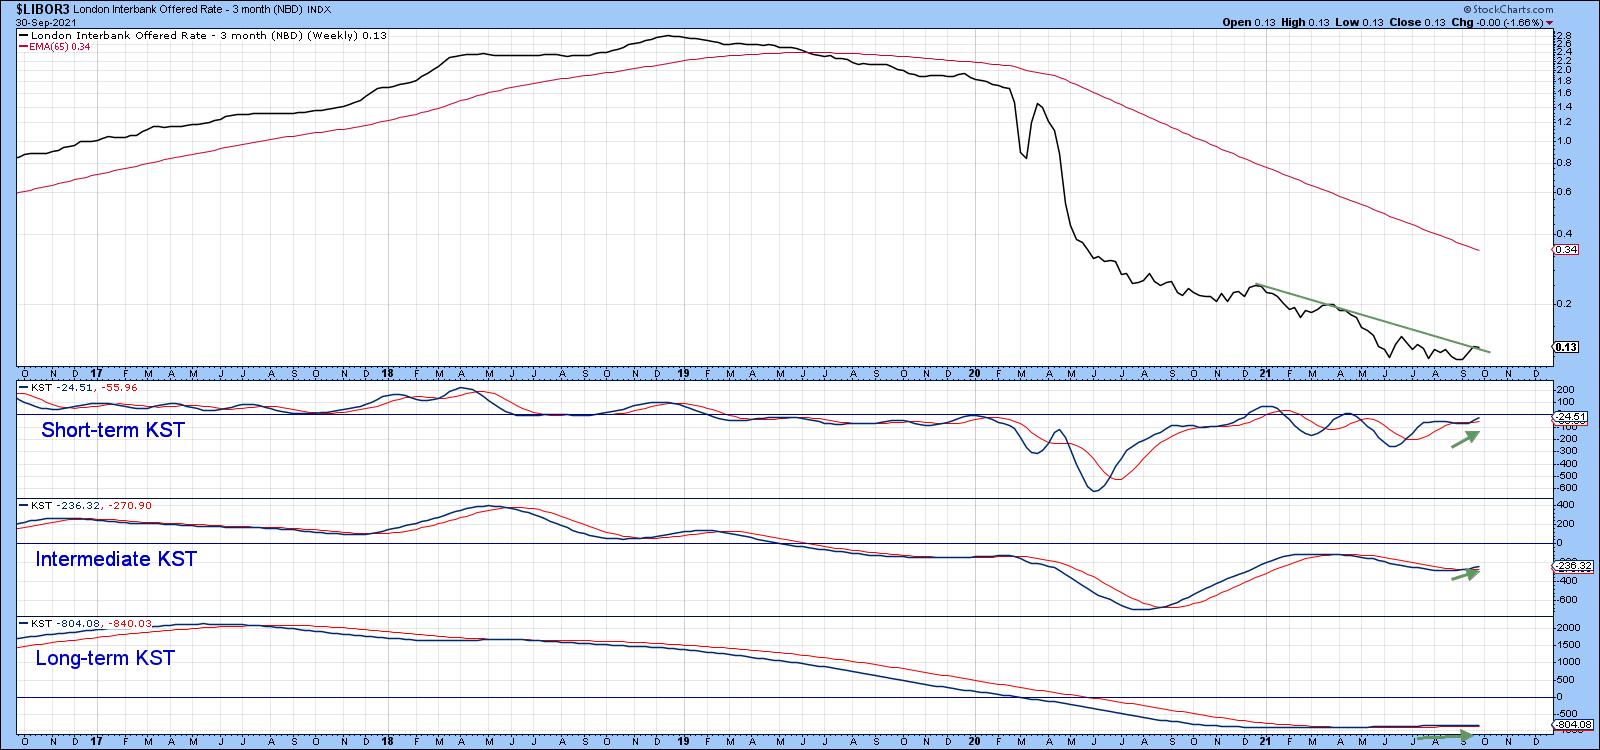 Chart 4Longer-Term Maturities
As we move out to longer-term maturities, the recent rise becomes progressively more subdued. You can see that from the fact that the 10-year in Chart 5 is well above its 65-week EMA, compared to the 30-year series in the bottom window, which is right at it. They all throw out the possibility of a reverse head-and-shoulders formation, but, for the time, being the bull market in yields is being led by shorter-term maturities.
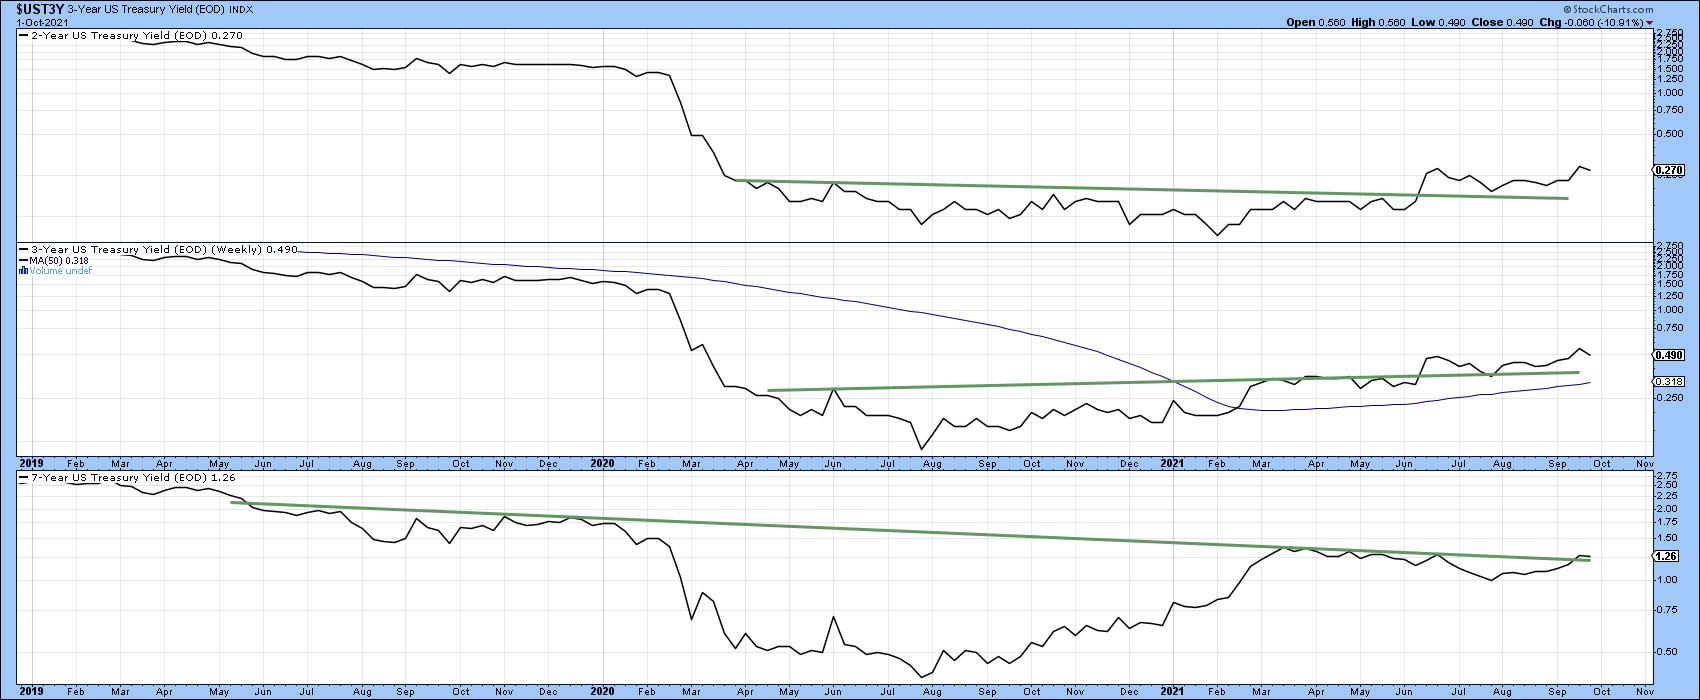 Chart 5Commodities Driving up Rates?
Last week, I pointed out that commodities could be vulnerable, as the Bloomberg Commodity ETN (the DJP) had experienced a false breakout to the upside. Chart 6 is a great example of how markets reflect people in action and that people can and do change their minds. You can see this from the fact that the false breakout has now been eclipsed by the price breaking to a new bull market high.
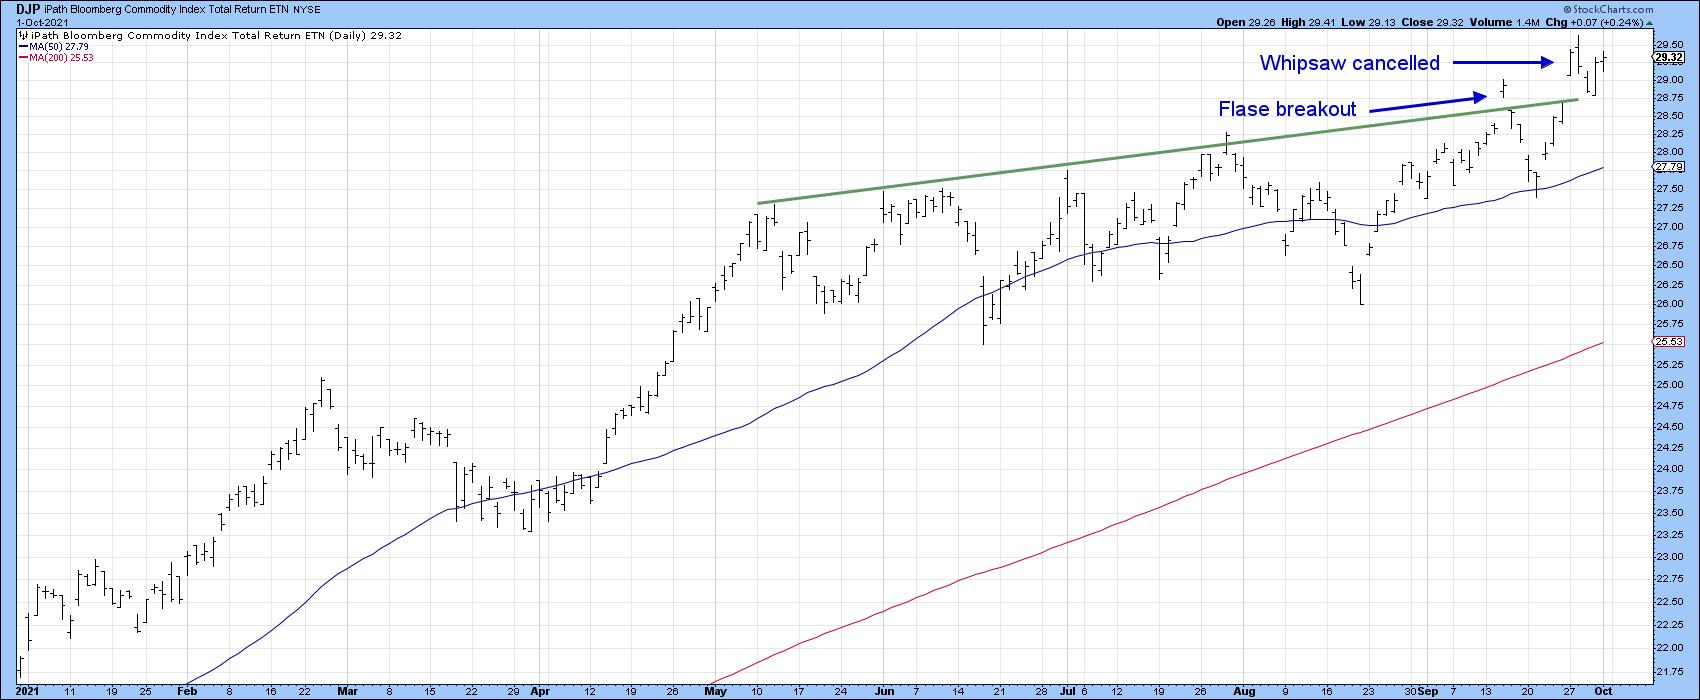 Chart 6I did not expect this to happen, but did point out that, in the event that it did, the likely commodity leader would be energy. In that respect, Chart 7 shows that the DB Energy ETN has already registered a new high. The US Oil Fund, Chart 8, has also broken out from a consolidation reverse head-and-shoulders. Energy stocks could be a close follower, as the VanEck Vectors Unconventional Oil and Gas ETF (FRAK), Chart 9, has jumped above its previous high.
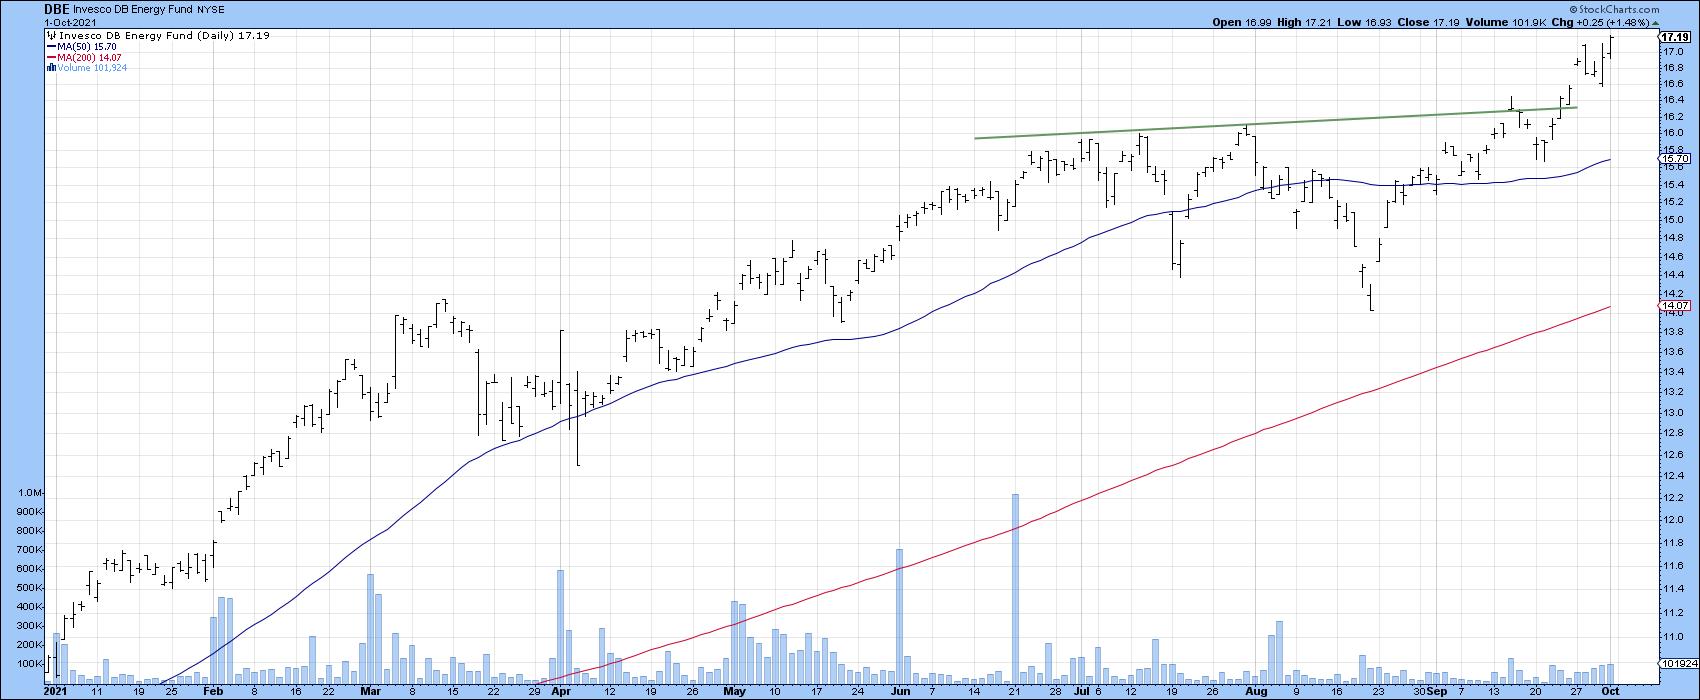 Chart 7
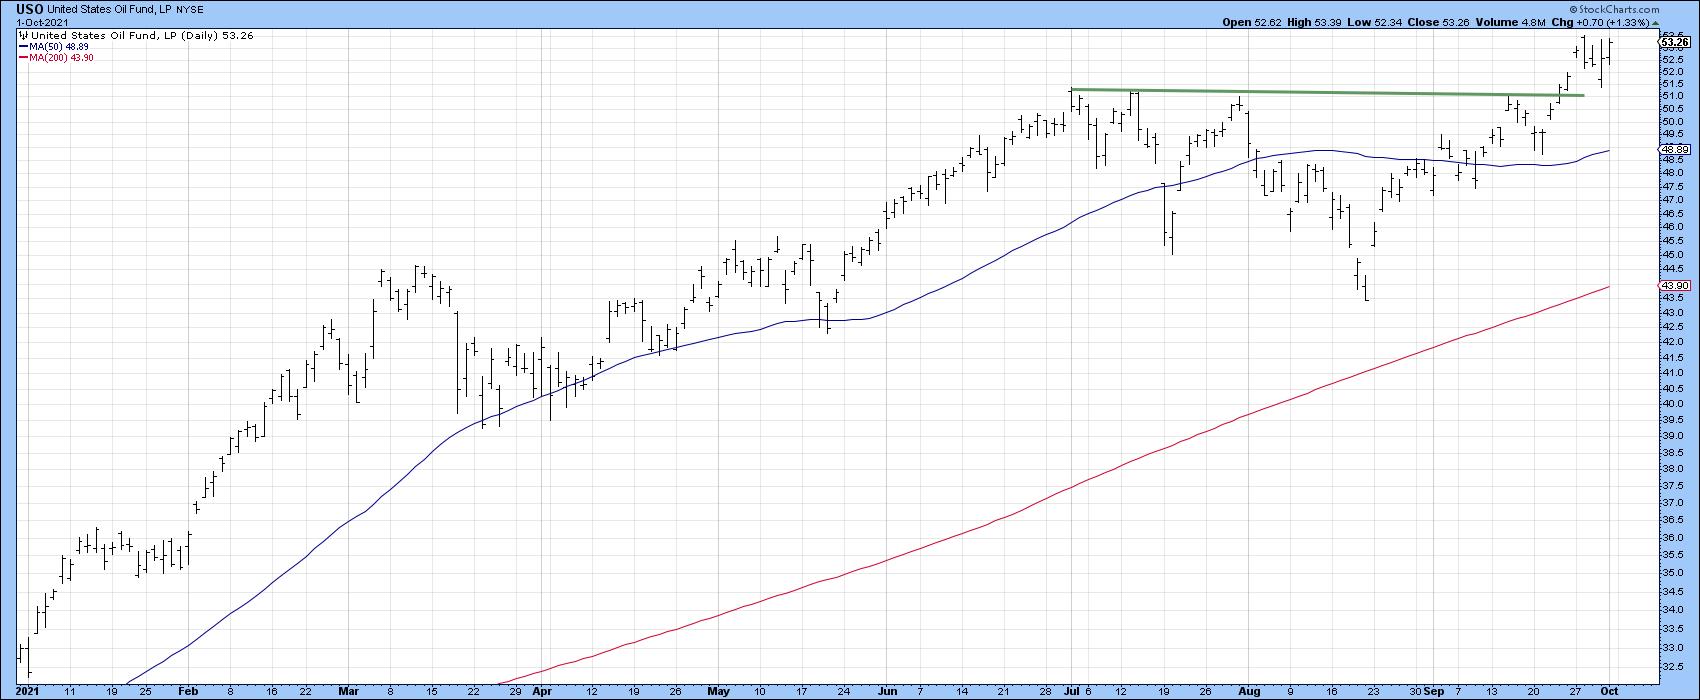 Chart 8
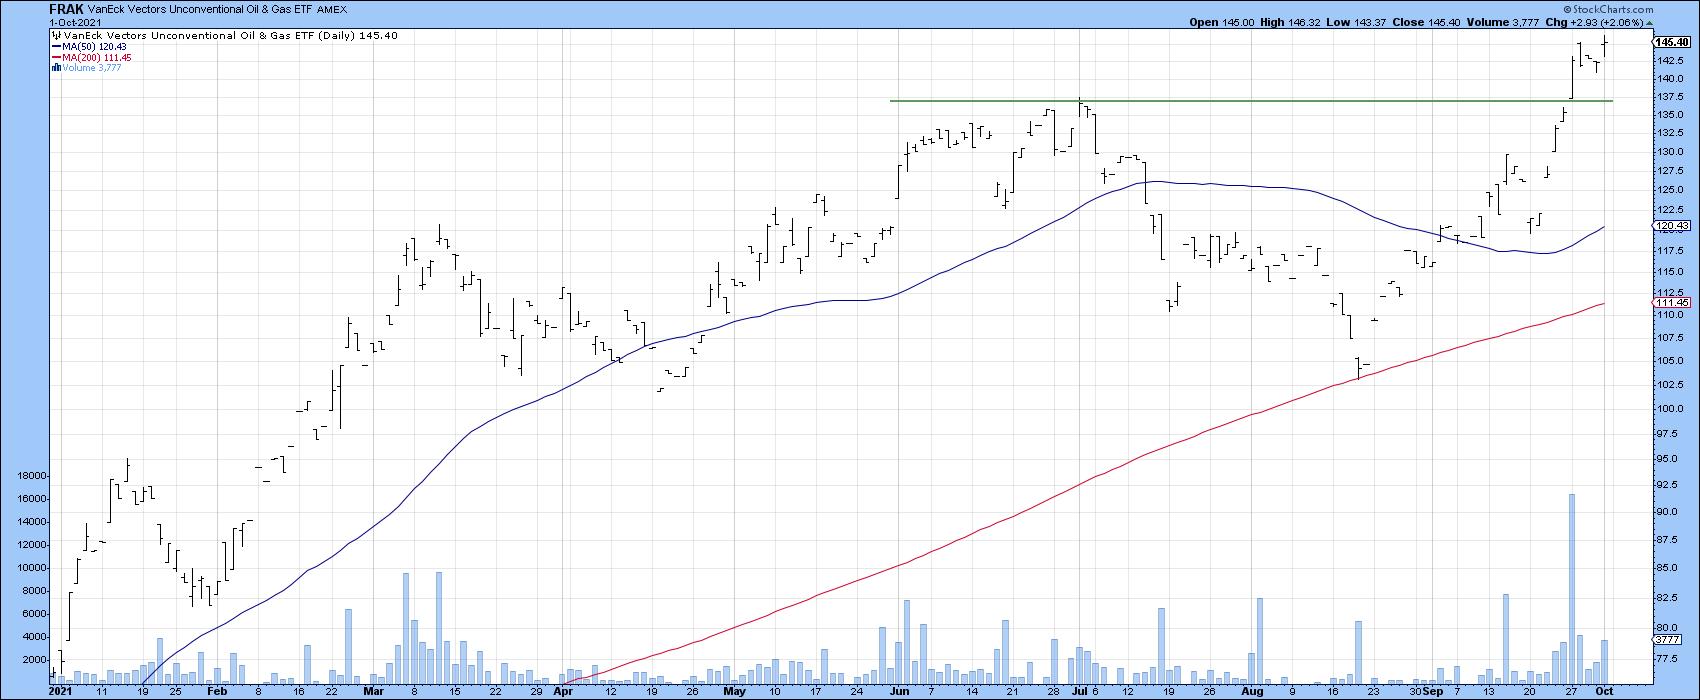 Chart 9Financials Like Rising Rates
Rising rates have been driving up financials Chart 10, as investors anticipate widening margins. As a result, the SPDR financial ETF (the XLF) is flirting with a new bull market high. One of the leading sub-groups appears to be Full Line Life Insurance, shown in Chart 11, along with a nice breakout in relative action.
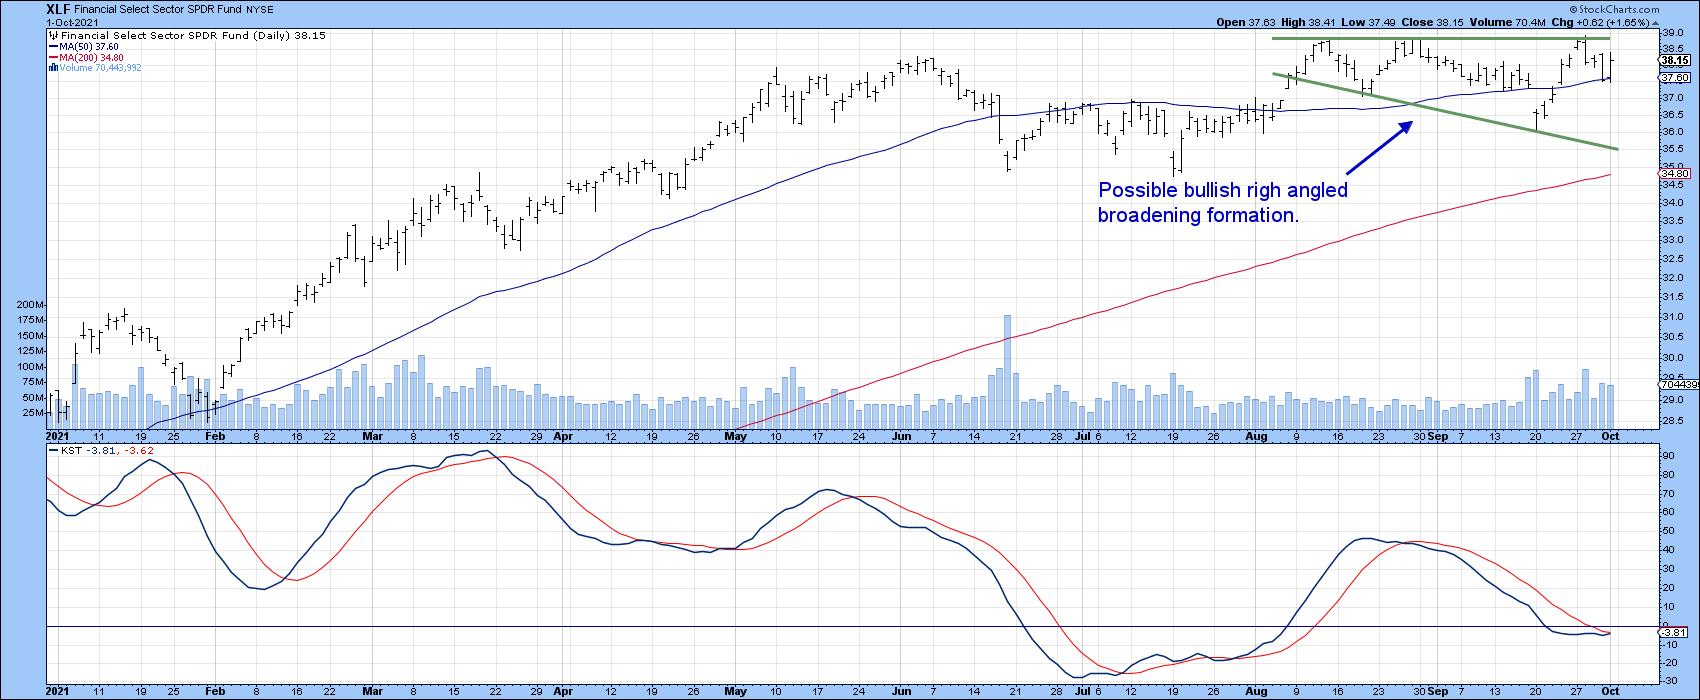 Chart 10
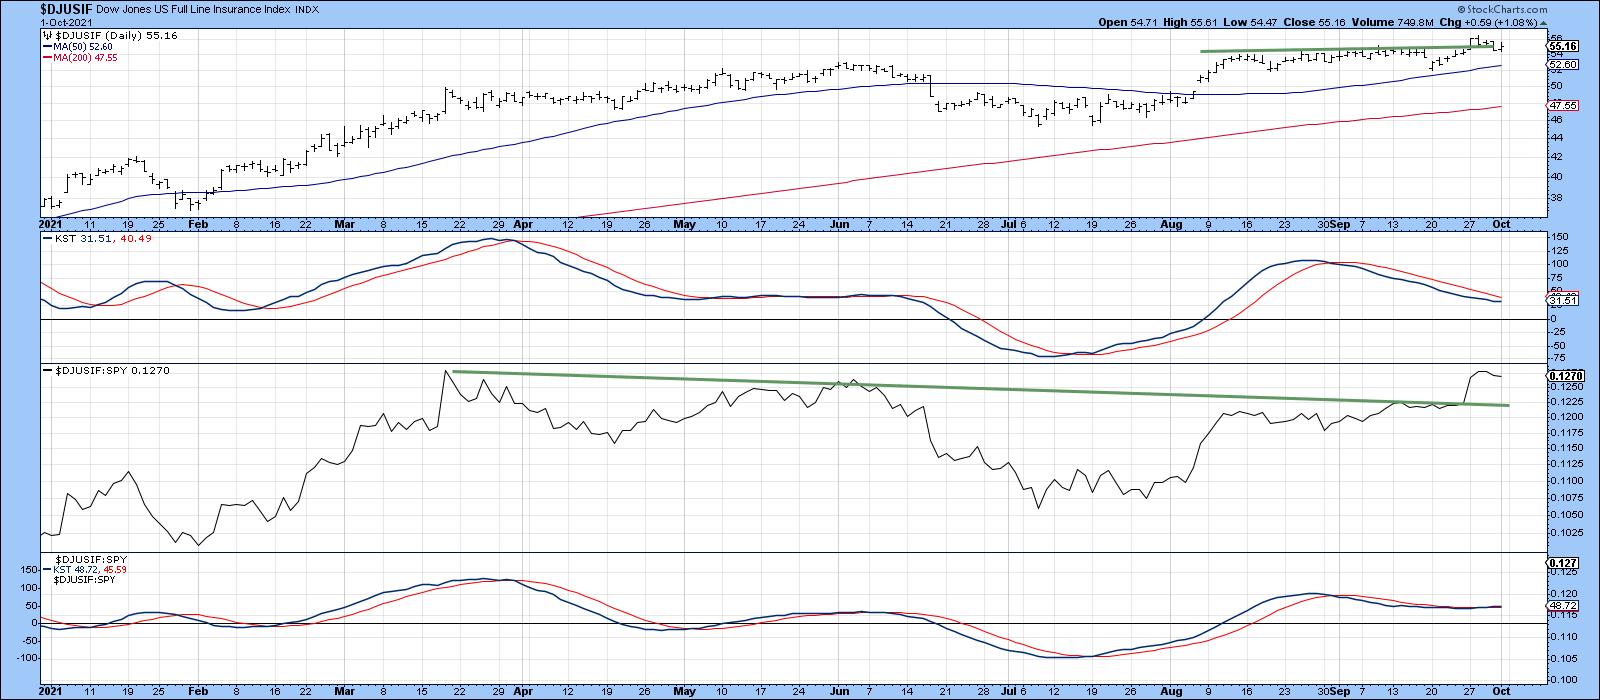 Chart 11
Good luck and good charting,
Martin J. Pring
This article is an updated version of an article previously published on Monday, September 27th at 6:55pm ET in the member-exclusive blog Martin Pring's Market Roundup.
The views expressed in this article are those of the author and do not necessarily reflect the position or opinion of Pring Turner Capital Group of Walnut Creek or its affiliates.


