(Our holiday gift to you... today's ChartWatchers article is a reprint of today's subscriber-only DP Weekly Wrap.)
Today, it was announced that we are faced with another COVID variant. This was not exactly a "black swan" event, something no one imagined, but maybe we could call it a "gray swan" that we saw, but hoped it was just a regular swan caught in shadow. The market action during the holiday-shortened session transported us back to the 2020 bear market, telling us that kind of volatility is not a thing of the past.
Linda Raschke tweeted this morning, "Today's event was the news event that nudged the market in the direction of the technicals." This is not a complete surprise to technical analysts. Earlier this week, John Hussman of Hussman Funds made the following three observations about current market conditions:
- The most extreme valuations in U.S. history, on the measures we find best-correlated with actual subsequent market returns over the past century, and even in recent decades, coupled with lopsided bullish sentiment and historic levels of margin leverage;
- Deterioration and divergence across measures of market internals that we believe to be reliable gauges of investor psychology toward speculation versus risk-aversion;
- The largest preponderance of overextended syndromes--typically associated with intermediate or cyclical market peaks--that we've ever observed in history.
"Not a forecast. Not a 'limit'. Not a market call. Just sharing what we're seeing. Still, it's fair to add that we've never seen such a thing." - John Hussman, Hussman Funds.
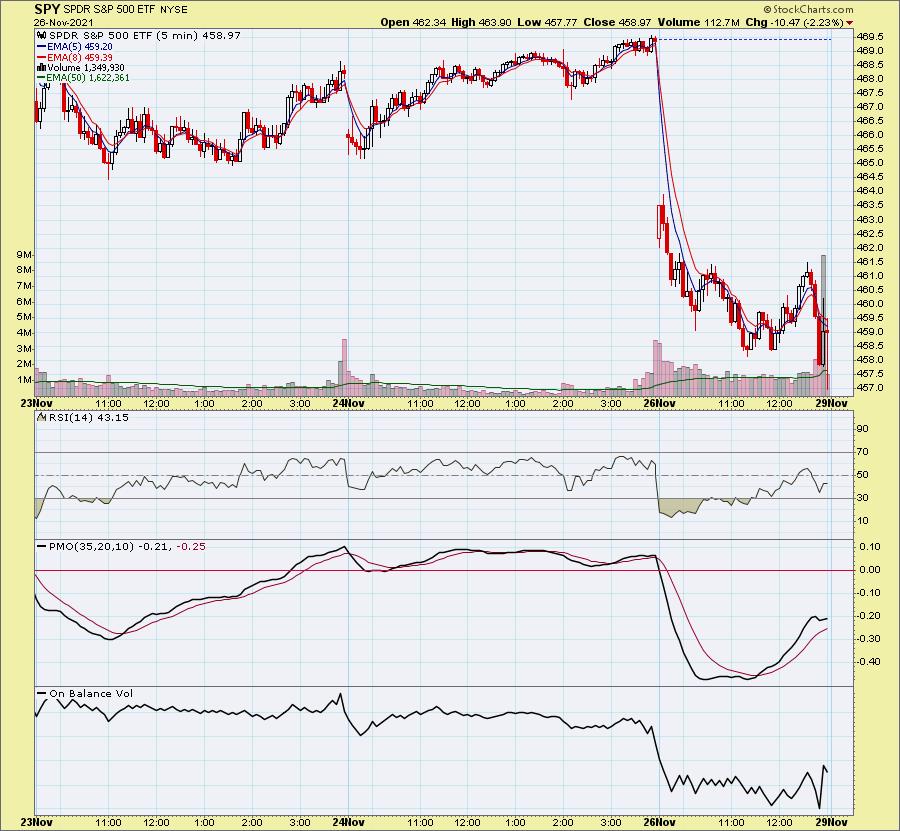
Let's look at the 5-minute bar chart, then we'll dive in later on the longer-term. Today's trading saw a huge gap down on the open. A very short-term double-bottom formed and price fulfilled the minimum upside target of the pattern, then completely fell apart. With ten minutes of trading left, another high volume push to upside was attempted, but it fueled nothing.
The DecisionPoint Alert Weekly Wrap presents an end-of-week assessment of the trend and condition of the Stock Market, the U.S. Dollar, Gold, Crude Oil and Bonds. The DecisionPoint Alert daily report (Monday through Thursday) is abbreviated and gives updates on the Weekly Wrap assessments.
Watch the latest episode of DecisionPoint on StockCharts TV's YouTube channel here!
MAJOR MARKET INDEXES
For Friday: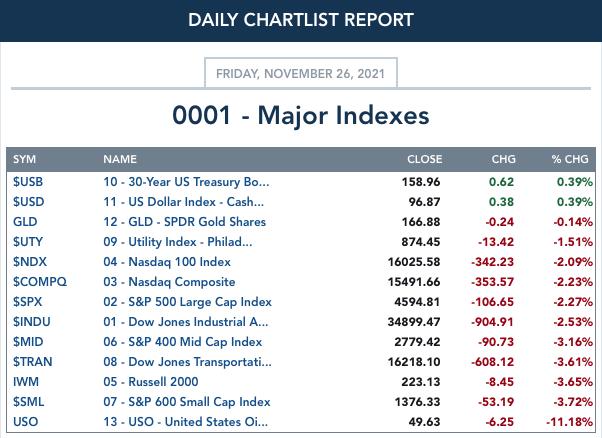
For the week: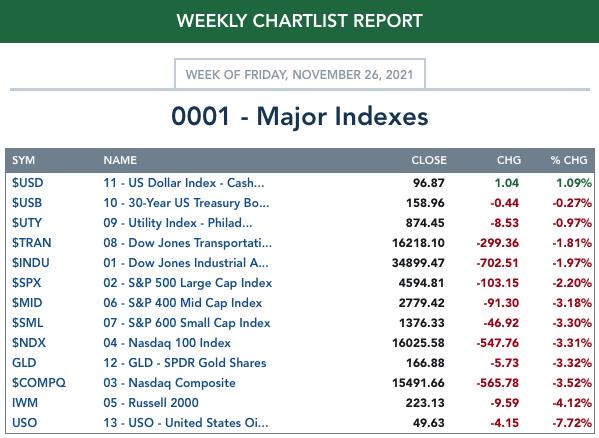
SECTORS
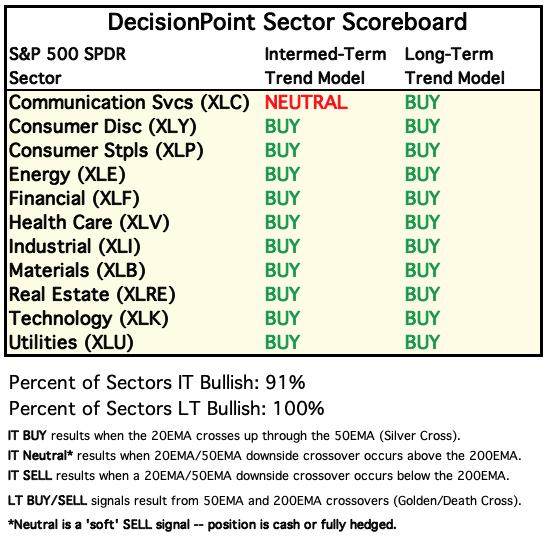
Each S&P 500 Index component stock is assigned to one, and only one, of eleven major sectors. This is a snapshot of the Intermediate-Term (Silver Cross) and Long-Term (Golden Cross) Trend Model signal status for those sectors.
For today: 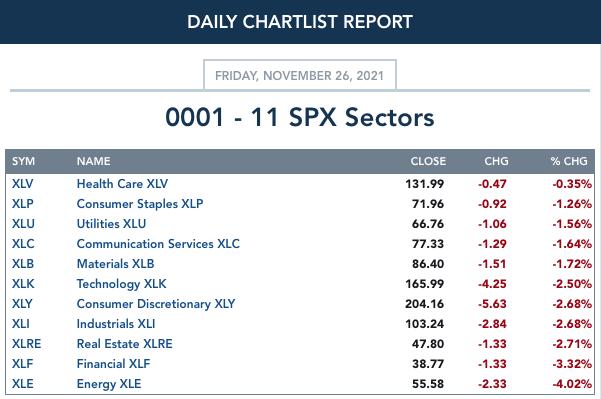
For the week: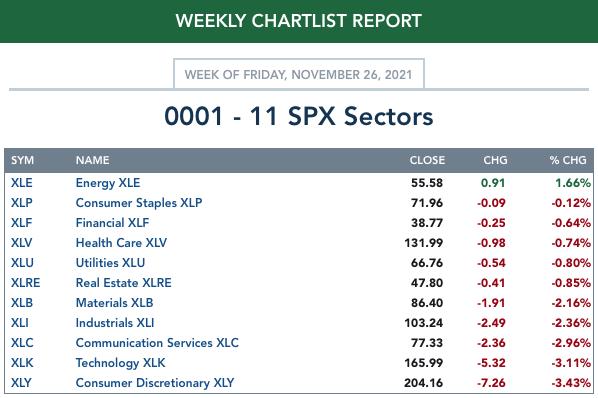
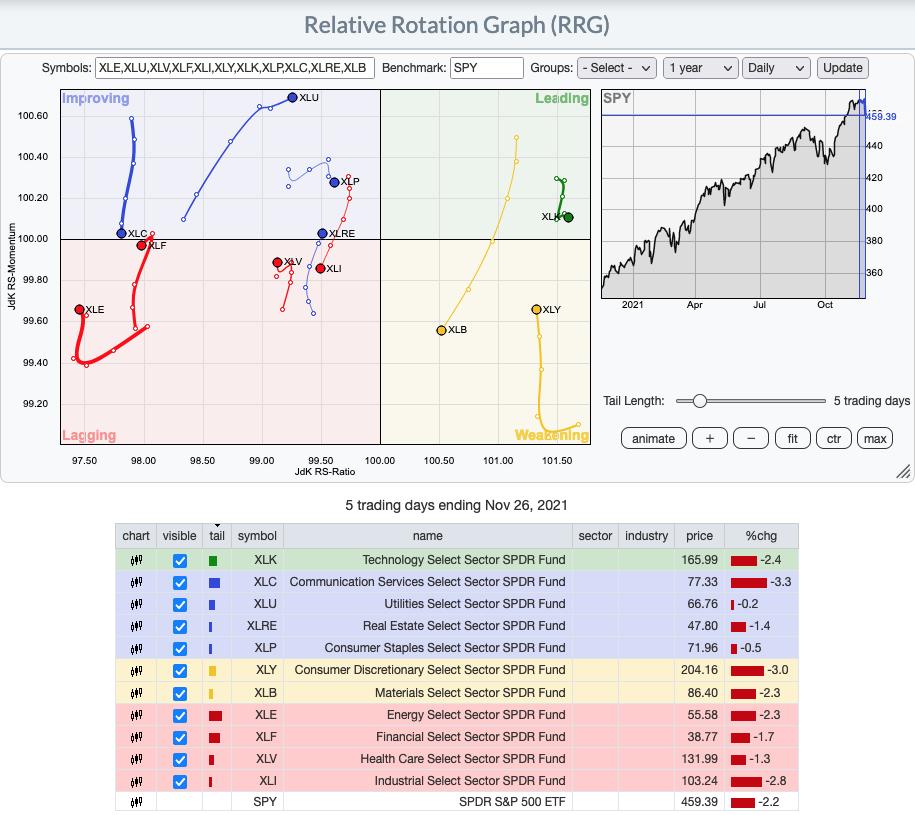
Daily RRG® Chart: Remember this chart measures relative strength to the SPY. The biggest changes to the short-term RRG is the complete heading reversal of XLF and XLK's push eastward further into Leading. XLRE and XLU continue to move a bullish northeast heading.
Weekly RRG® Chart: In the longer term, XLE, XLY and XLK continue to show strong relative strength against the SPY. XLB and XLI are making a comeback toward Leading out of Improving. XLF is in Leading, but is headed toward Weakening. All other sectors are Lagging and getting more bearish as they head deeper into that quadrant.
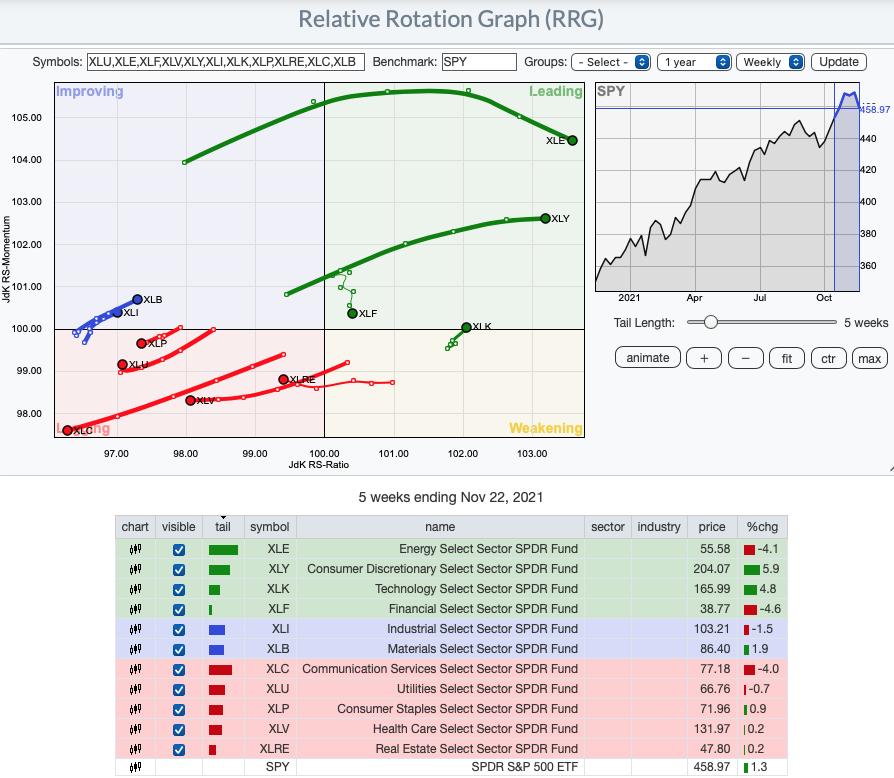
RRG® charts show you the relative strength and momentum for a group of stocks. Stocks with strong relative strength and momentum appear in the green Leading quadrant. As relative momentum fades, they typically move into the yellow Weakening quadrant. If relative strength then fades, they move into the red Lagging quadrant. Finally, when momentum starts to pick up again, they shift into the blue Improving quadrant.
CLICK HERE for an animated version of the RRG chart.
CLICK HERE for Carl's annotated Sector charts.
THE MARKET (S&P 500)
IT Trend Model: BUY as of 10/18/2021
LT Trend Model: BUY as of 6/8/2020
SPY Daily Chart: Today's sell-off brought price close the target we've been expecting on a pullback--the support of the 50-EMA and the September top. The double-top has now been confirmed and the minimum downside target of the pattern is the September top. The question is whether it can maintain the short-term rising trend.
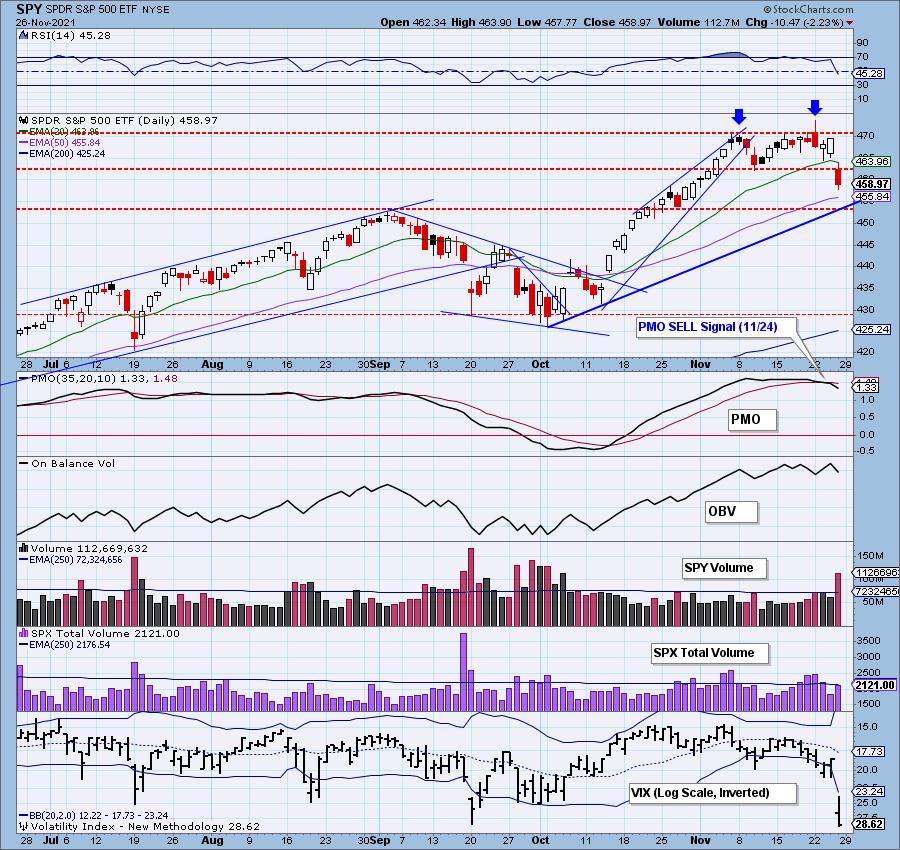
The PMO and Stochastic gave us warning that a decline was on its way. Now the RSI is confirming with a move into negative territory below net neutral (50). The VIX crashed and closed at its highest reading March. This does suggest a possible recovery on Monday or Tuesday, but, given many weren't engaged in trading over the holidays, there is a high likelihood those who "missed out" on selling today could begin to divest in earnest when they return to the office.

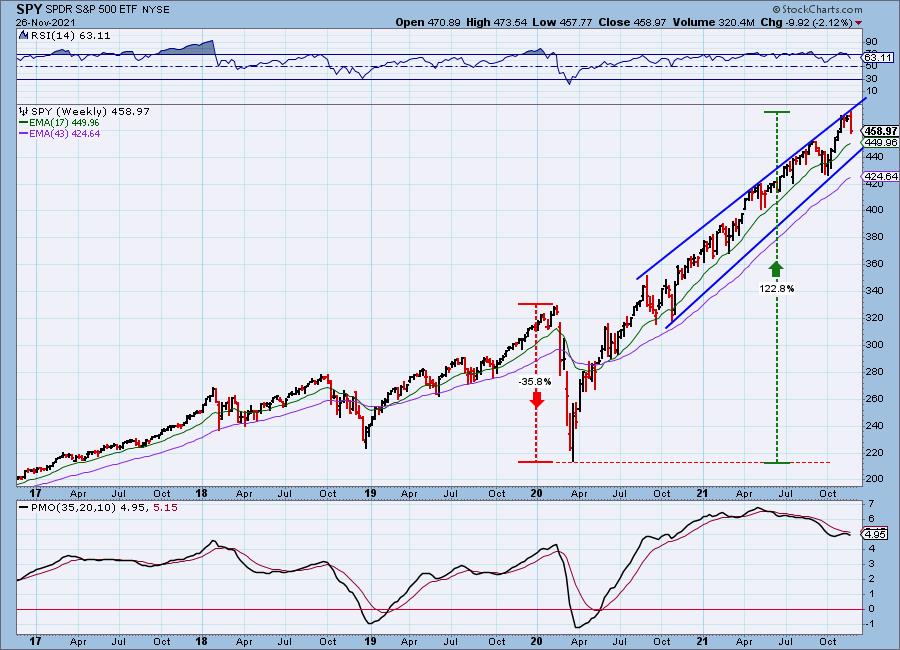
SPY Weekly Chart: The weekly chart showed that price was up against the top of a bearish rising wedge. Price is now headed to test the bottom of the wedge. A move down to the bottom of the wedge would mean another 4% drop. The pattern suggests it won't stop there.
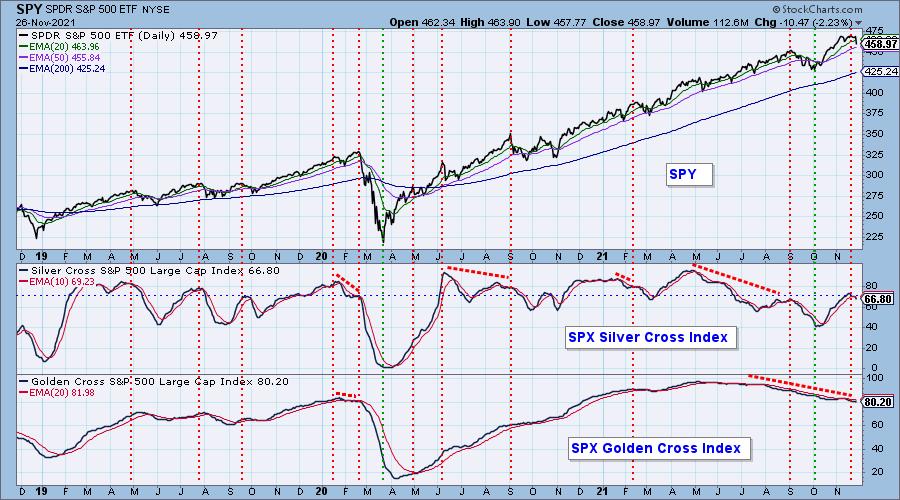
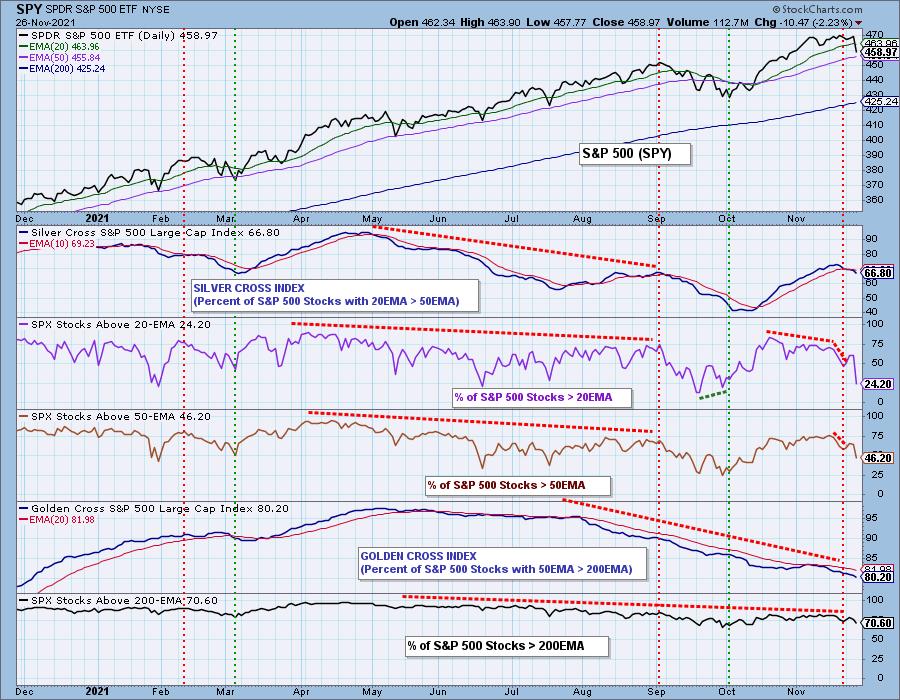
PARTICIPATION: The following chart objectively shows the depth and trend of participation in two timeframes.
- Intermediate-Term - the Silver Cross Index (SCI) shows the percentage of SPX stocks on IT Trend Model BUY signals (20-EMA > 50-EMA). The opposite of the Silver Cross is a "Dark Cross" -- those stocks are, at the very least, in a correction.
- Long-Term - the Golden Cross Index (GCI) shows the percentage of SPX stocks on LT Trend Model BUY signals (50-EMA > 200-EMA). The opposite of a Golden Cross is the "Death Cross" -- those stocks are in a bear market.
The SCI began to decline earlier in the week and we now have a negative cross over the signal line. Roughly 2/3rds of the stocks in the SPX have their 20-EMA above their 50-EMA. This number is somewhat bullish, but clearly participation is beginning to shrink in the intermediate term. The GCI is still at a bullish 80% but, very slowly, that foundation is cracking.
New 52-Week Highs/Lows: A few New Highs were logged, but we saw the most New Lows in well over a year.
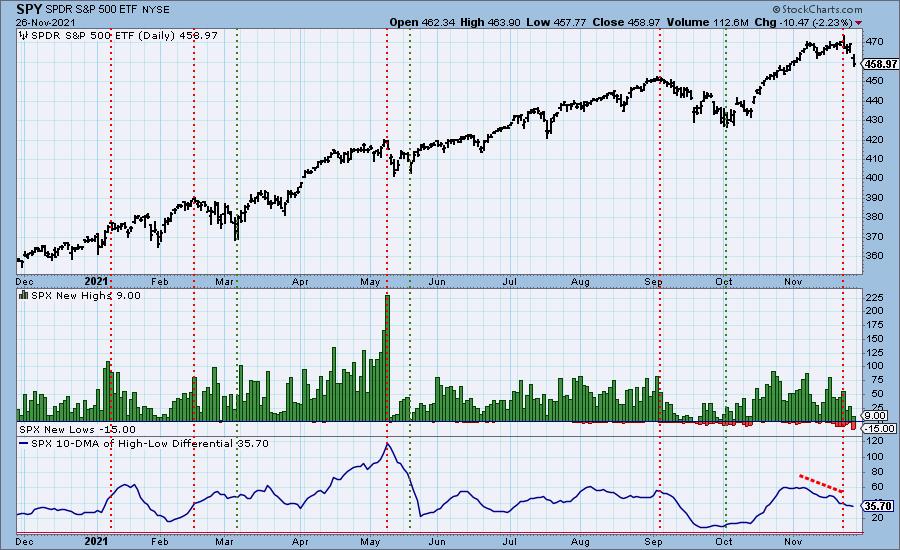
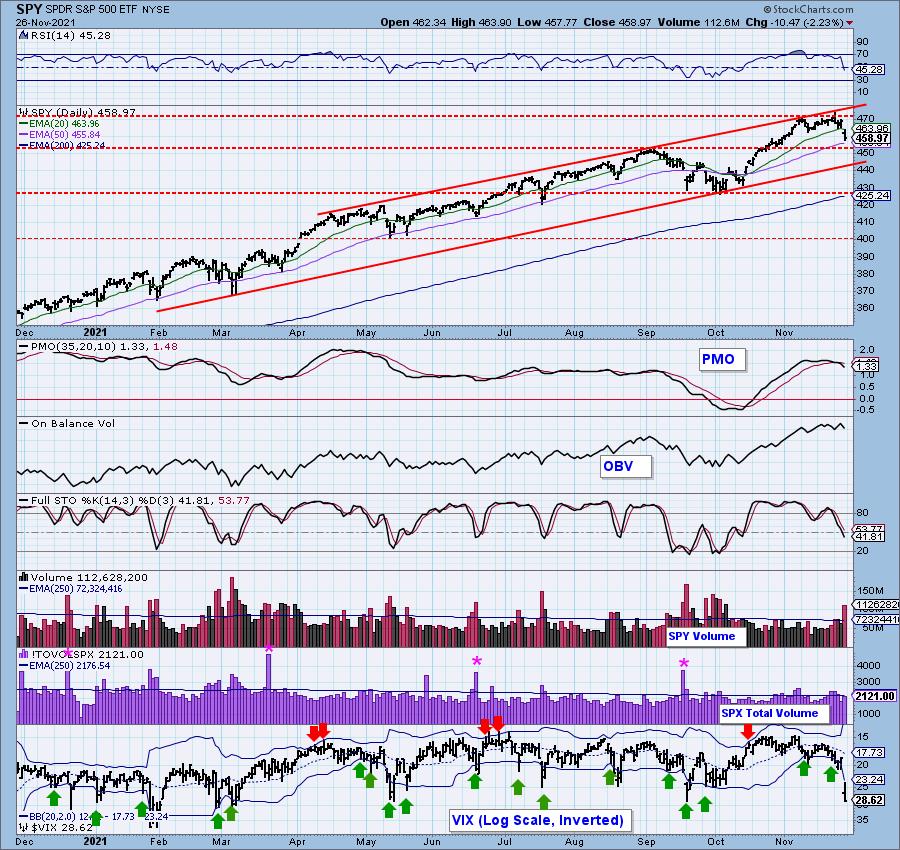
Climax Analysis: One of the last things we expected to be writing about on the day after Thanksgiving was a downside initiation climax. Total Volume wasn't above the annual average, but it is way out of the range of light "holiday trading". Net A-D spiked to the downside and the VIX flew past the lower Bollinger Band on our inverted scale, indicating extreme bearish sentiment. Volume Ratios were off the charts to the downside. This is a clear "initiation" climax which tells us to expect lower prices to persist.
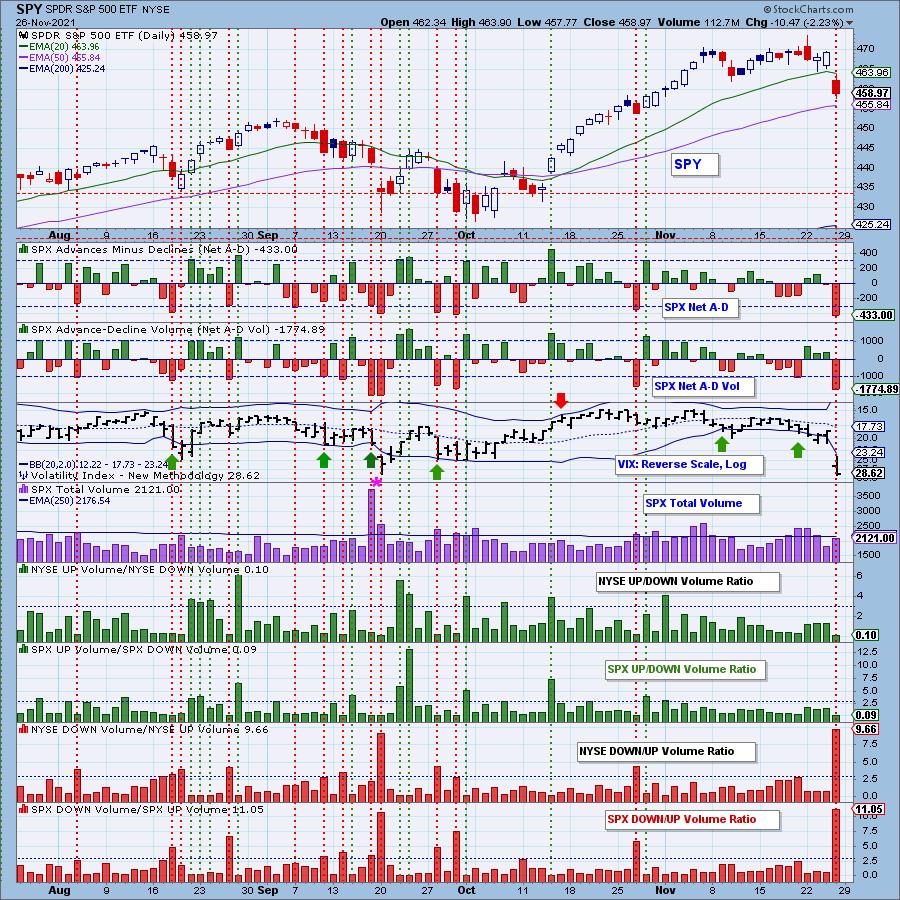
*A climax is a one-day event when market action generates very high readings in, primarily, breadth and volume indicators. We also include the VIX, watching for it to penetrate outside the Bollinger Band envelope. The vertical dotted lines mark climax days -- red for downside climaxes, green for upside. Climaxes indicate either initiation or exhaustion.
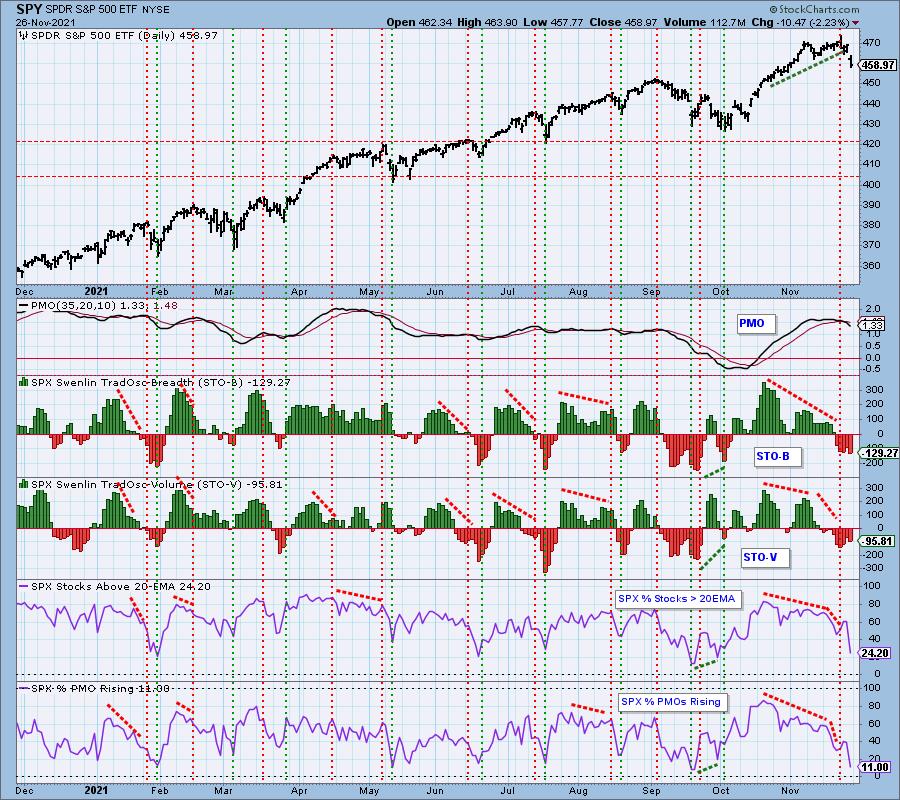
Short-Term Market Indicators: The short-term market trend is DOWN and the condition is SOMEWHAT OVERSOLD.
STOs, which had been rising, jumped back down. While these readings are oversold, they are only somewhat so given we've seen much lower readings. The scariest reading on this chart is %Stocks with PMOs Rising. Only 11% of SPX stocks have rising momentum... only 11%. That reading is very oversold, but we've seen even lower readings.
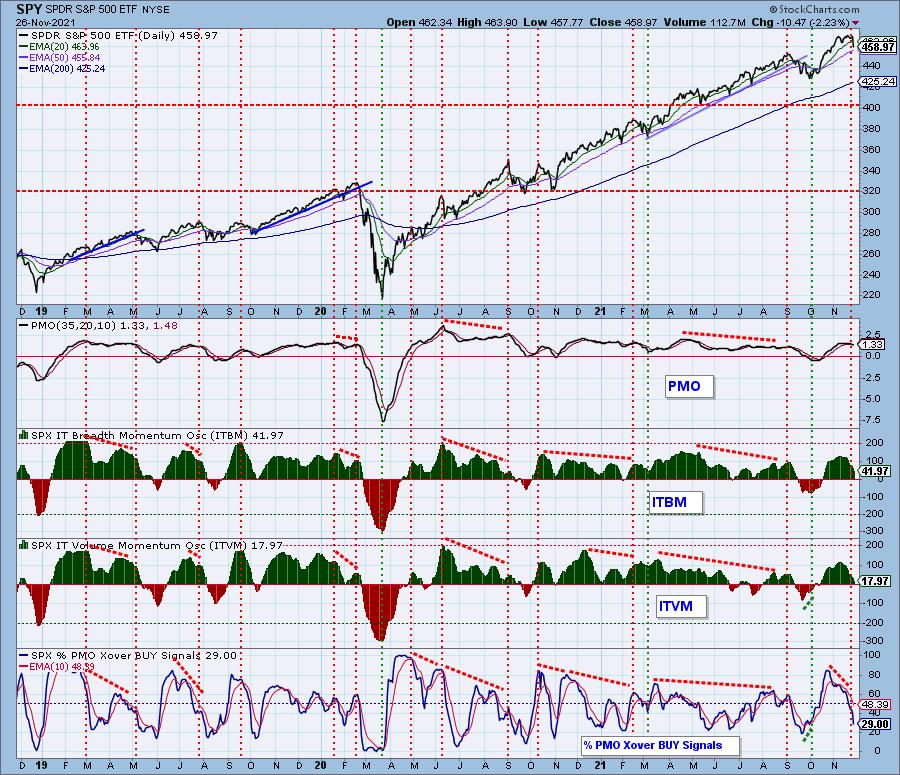
Intermediate-Term Market Indicators: The intermediate-term market trend is UP and the condition is NEUTRAL.
IT indicators have been declining since the first November top. They are no longer OVERBOUGHT, but they are certainly not oversold. They can accommodate much lower prices. Less than 1/3rd of the SPX are on residual crossover BUY signals. That number is not oversold.
Bias Assessment: Participation of stocks above their 20-EMA fell out of bed. Last we'd looked before Thanksgiving, over 60% had price above the 20-EMA. Today, we have less than a quarter with price above their 20-EMA. %Stocks > 50-EMA near 65%, now we have less than half above their 50-EMA. The SCI will sustain serious damage soon, and it is very far from oversold territory. There is a clear short- and intermediate-term bearish bias.
CONCLUSION: In a surprise plot twist, the market plunged -2.23% on the half day of trading on the day after Thanksgiving. We were expecting a quiet day with very little to write about. Instead we are discussing a new downside initiation climax that is warning this likely only the beginning. Typically extreme bearish sentiment and a plunging VIX lead to upside reversals. We aren't expecting this, at least not yet. Batten down the hatches, the storm has arrived.
Erin had stops initiate today. She is now 30% exposed to the market with 70% in cash.
Have you subscribed the DecisionPoint Diamonds yet? DP does the work for you by providing handpicked stocks/ETFs from exclusive DP scans! Add it with a discount! Contact support@decisionpoint.com for more information!
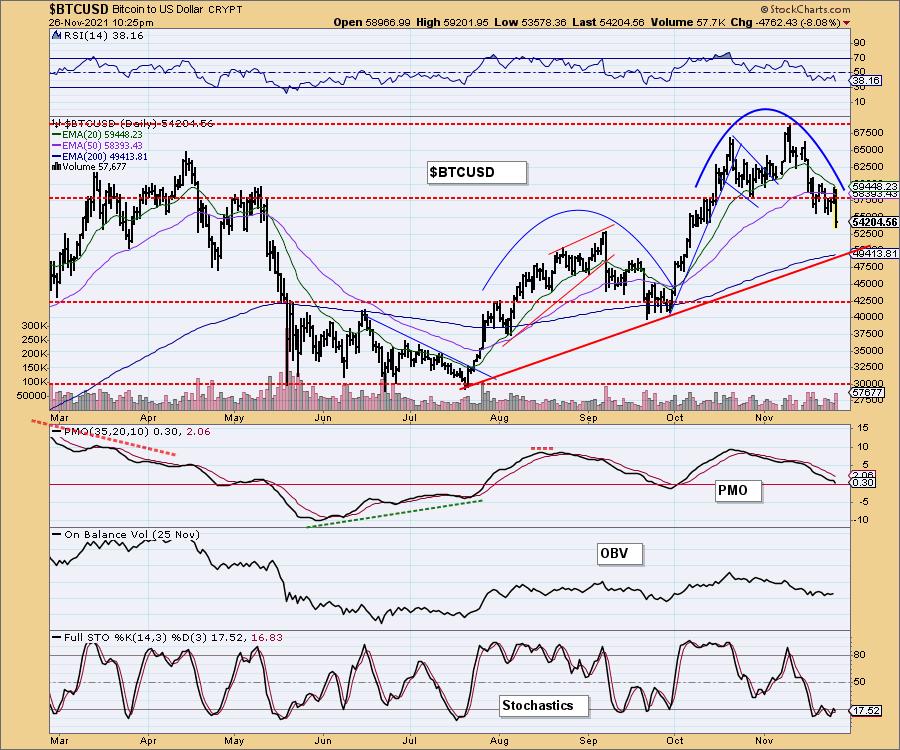
BITCOIN
Bitcoin followed suit with the market with a heavy breakdown of its own. $55,000 was holding as support for over a week. It appeared a bullish double-bottom was forming, but that disintegrated before it was confirmed. The indicators are very weak, so expect a test of the rising trend at the 200-EMA.
Buy One Month - Get One Month for FREE
Black Friday/Cyber Monday SALE
Get the best deal of the year on DecisionPoint.com subscriptions! Our system has been set up to give you instead of one when you subscribe to any of our subscriptions by December 2nd!
Get complete access to Carl's annotated ChartLists with ANY subscription.
Be alerted to "Climax Days" with complete coverage of the broad market, Bitcoin, Yields, the Dollar, Crude Oil, Gold, Gold Miners and Bonds in the DP Alert.
Get access to the subscriber-only Diamond Mine trading room along and ten stock picks per week with a DP Diamonds subscription!
Click HERE to subscribe NOW!
Seriously... this is THE best offer of the year!
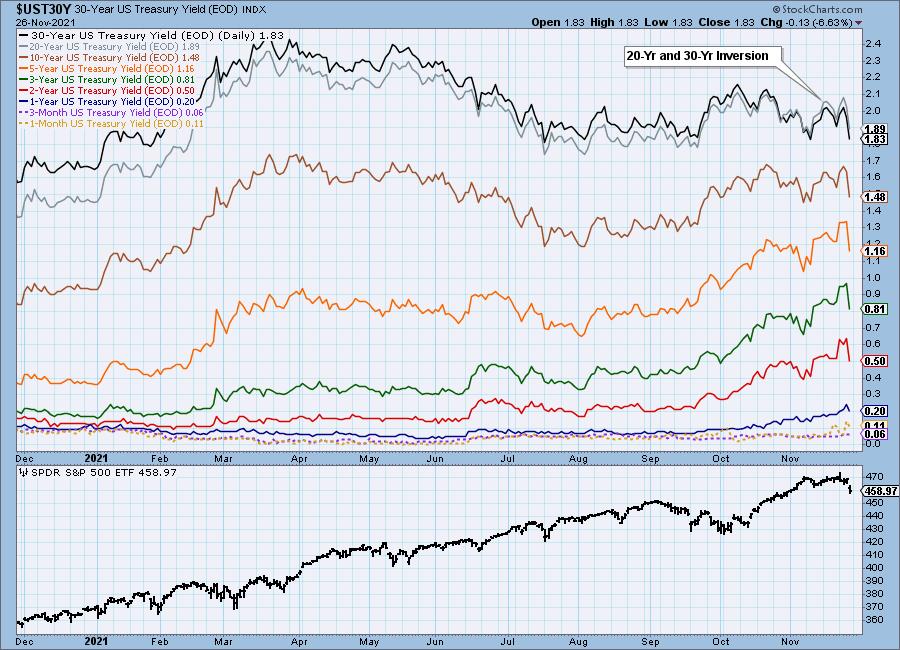
INTEREST RATES
Yields plunged as many flooded to the safety of Bonds on today's decline.
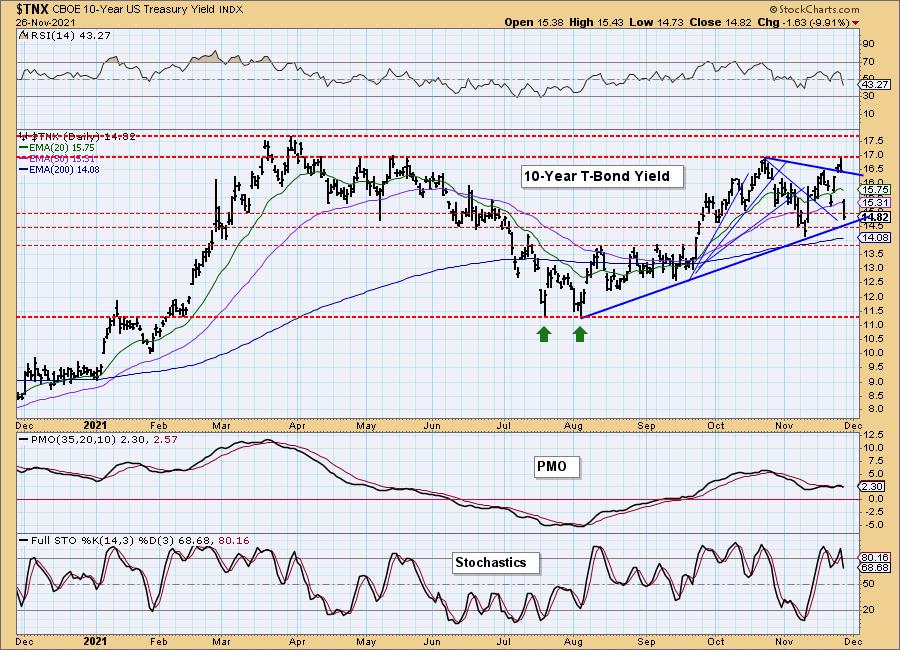
10-YEAR T-BOND YIELD
The 10-year yield threw away the bullish breakout from the symmetrical triangle and dropped to test the rising trend again. Support is available at 14.5 and 14.0 as well as at the 200-EMA. However, if bonds continue to welcome nervous investors, those support levels aren't as strong as they appear.
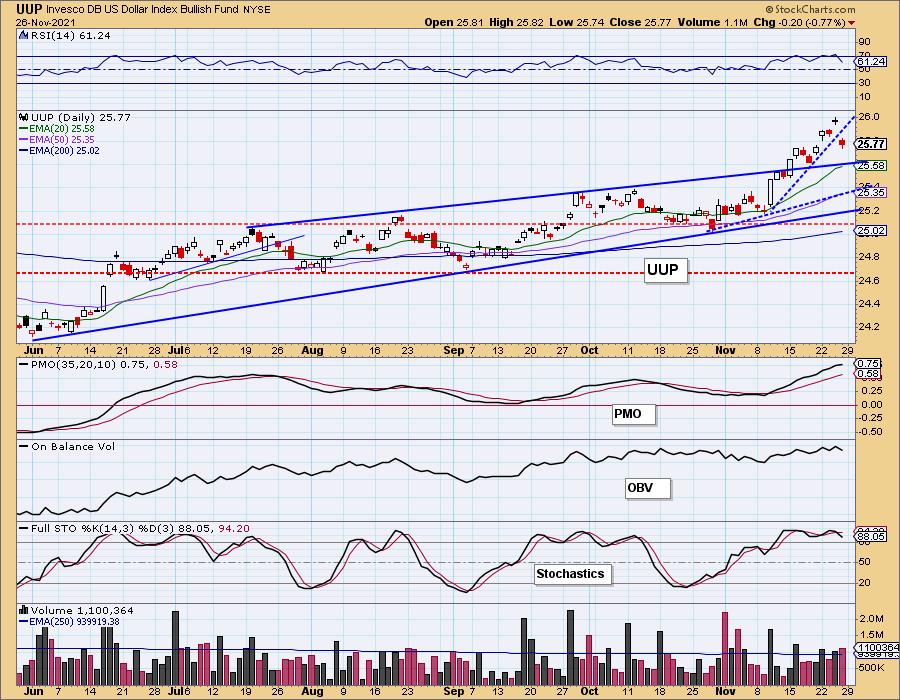
DOLLAR (UUP)
IT Trend Model: BUY as of 6/22/2021
LT Trend Model: BUY as of 8/19/2021
UUP Daily Chart: The Dollar fell too. The steep short-term rising trend was compromised, but there are many more levels available as a reversal point. The RSI is still positive and the PMO is still rising. Stochastics have turned down, but remain above 80. Steep rising trends are difficult to maintain, so this was expected.
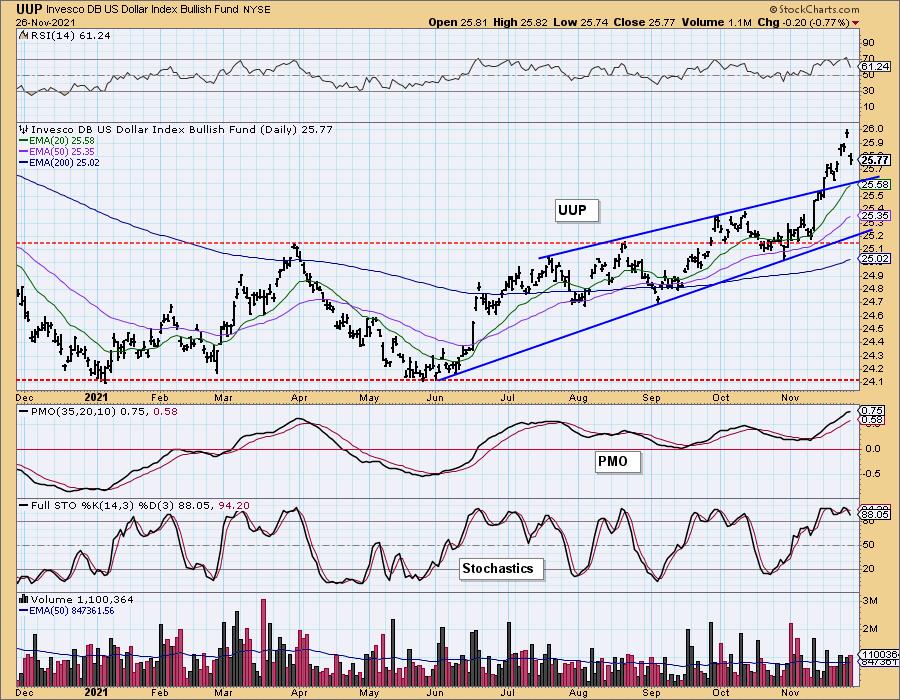
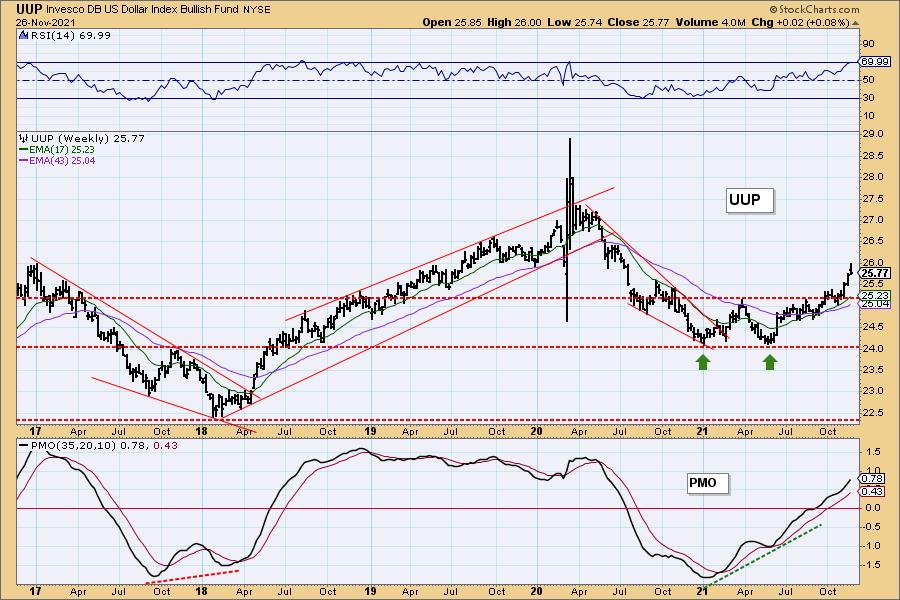
UUP Weekly Chart: The double-bottom was confirmed three weeks ago and is headed toward the minimum upside target of $26.50. There's nothing on the chart to suggest that won't happen.
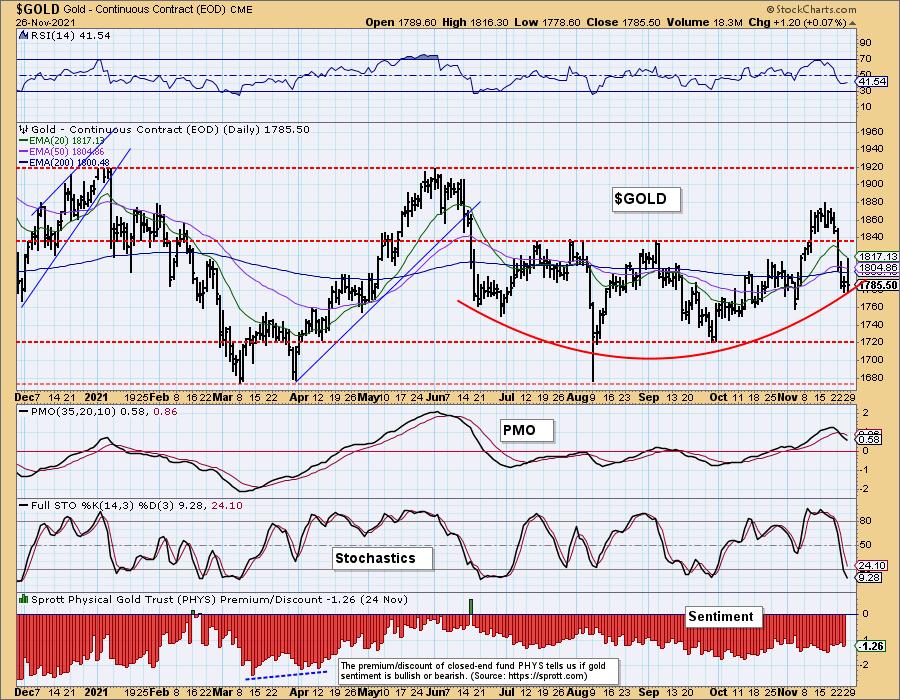
GOLD
IT Trend Model: BUY as of 10/28/2021
LT Trend Model: BUY as of 11/16/2021
GOLD Daily Chart: GLD was lower on the day. After three days closing below the 200-EMA, the Long-Term Trend Model "Golden Cross" BUY signal is in jeopardy. The short-term rising trend is holding up which, in turn, is keeping the intermediate-term rounded bottom in play.
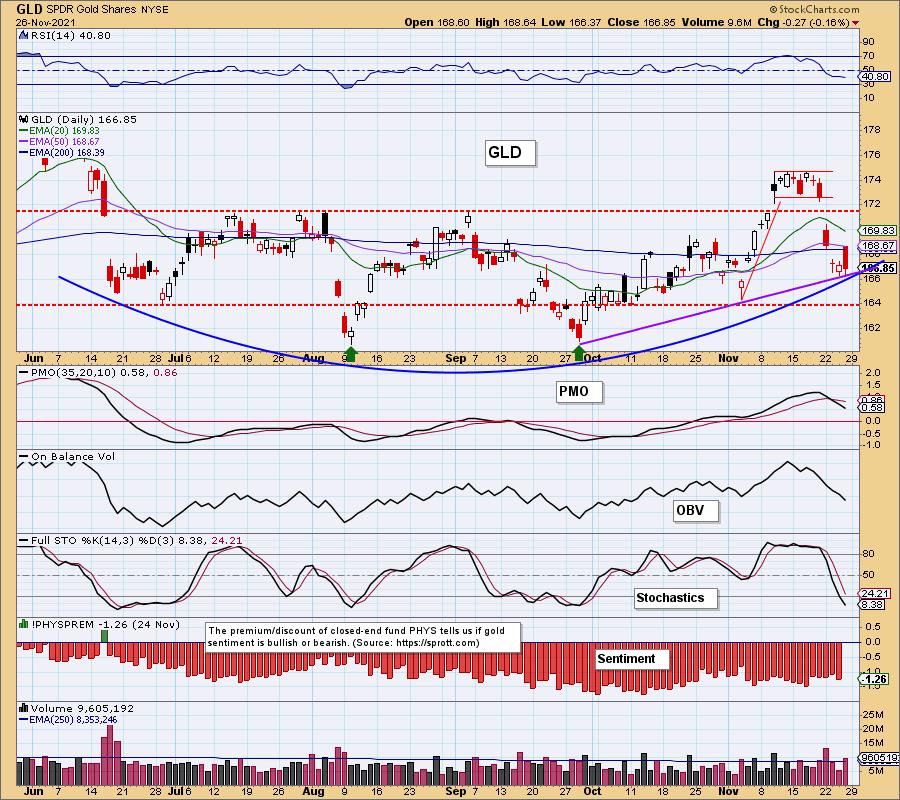
Indicators are very bearish, with the RSI moving sideways in negative territory and PMO falling on a SELL signal. Stochastics are very short-term indicators and they are still pointed downward. A reversal here is possible, but indicators tell us not to expect one yet.
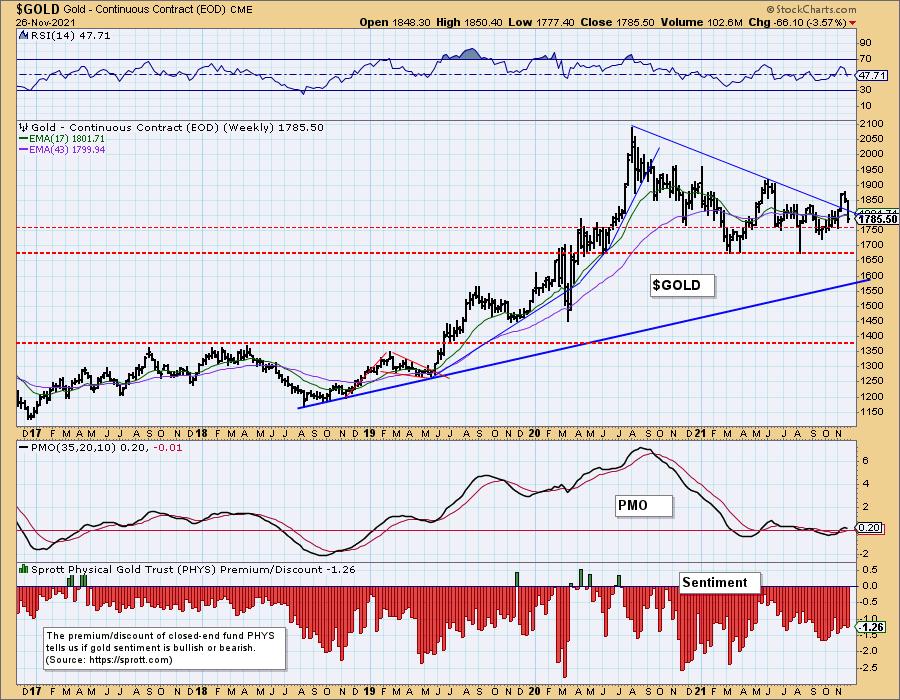
GOLD Weekly Chart: The Discount on PHYS hasn't been posted yet. Since the September low, discounts have been trending lower, which suggests investors are less bearish on Gold. We have to wonder if those discounts will expand on this week's 3.5% decline. In any case, the breakout from the declining trend failed and Gold is once again traveling within a bearish descending triangle. The weekly PMO has turned down and the weekly RSI is now negative. $1750 seems the most logical stopping point on this decline, but the weekly chart tells us strong support doesn't arrive until $1675.
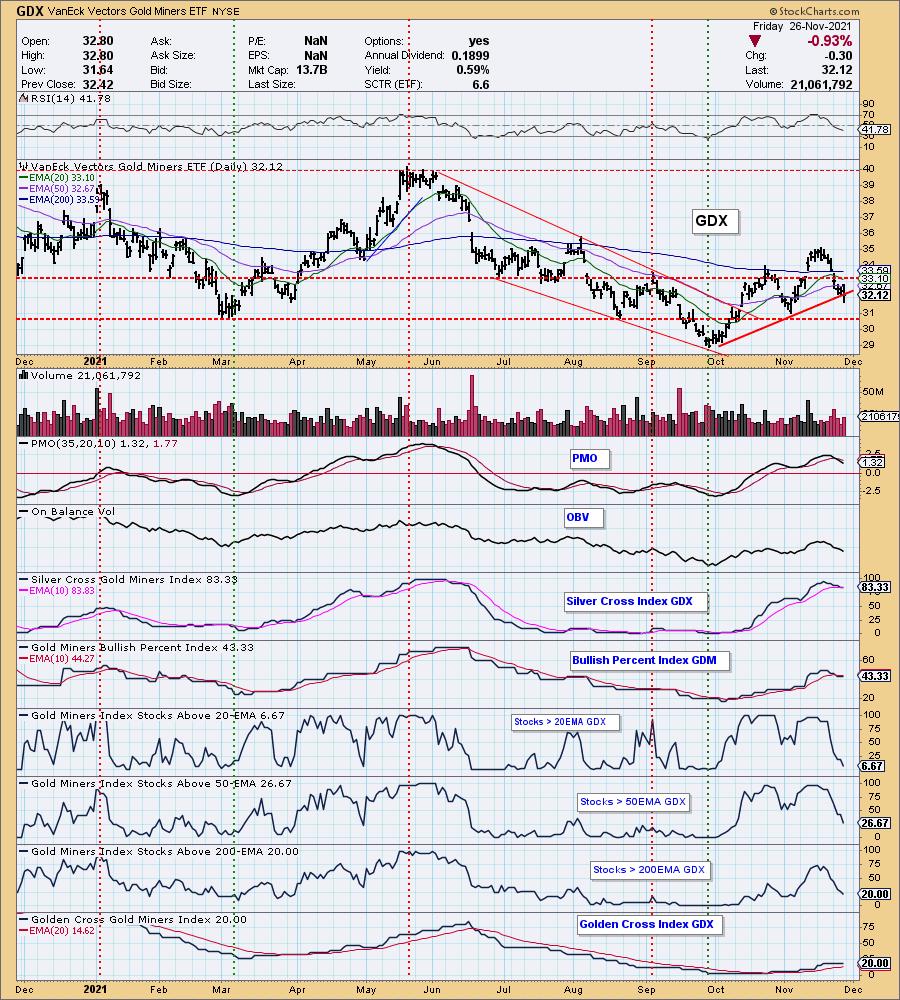
GOLD MINERS Golden and Silver Cross Indexes: Gold Miners compromised their short-term rising trend but managed to close on it. We now have a negative crossover on the SCI and, given the poor participation, more downside should be expected.
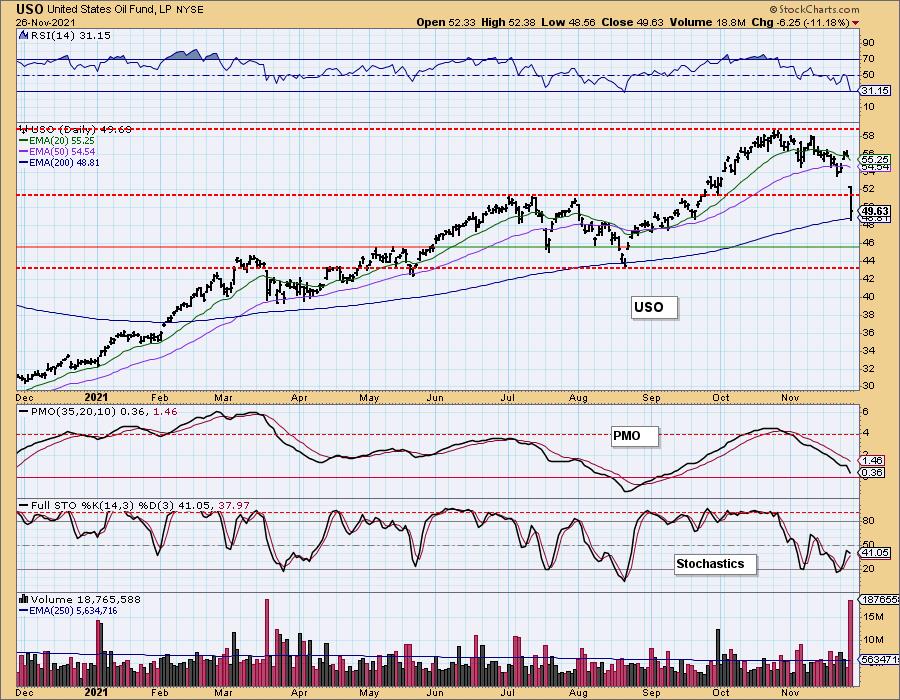
CRUDE OIL (USO)
IT Trend Model: BUY as of 9/3/2021
LT Trend Model: BUY as of 3/9/2021
USO Daily Chart: Crude Oil crashed, dropping more than 11% to foray below the 200-EMA. Price managed to close above it, but important support at the July highs was obliterated. The PMO sharply turned lower and the RSI plunged into negative territory. Stochastics are topping below net neutral (50).
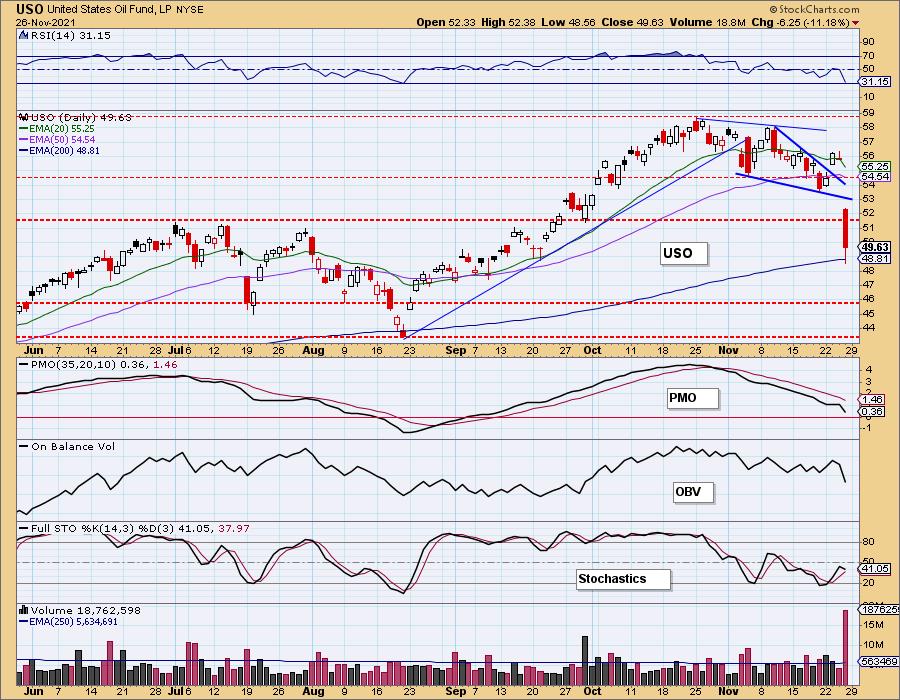
There is tenuous support at the May tops and July low. Strongest support lies below $44.
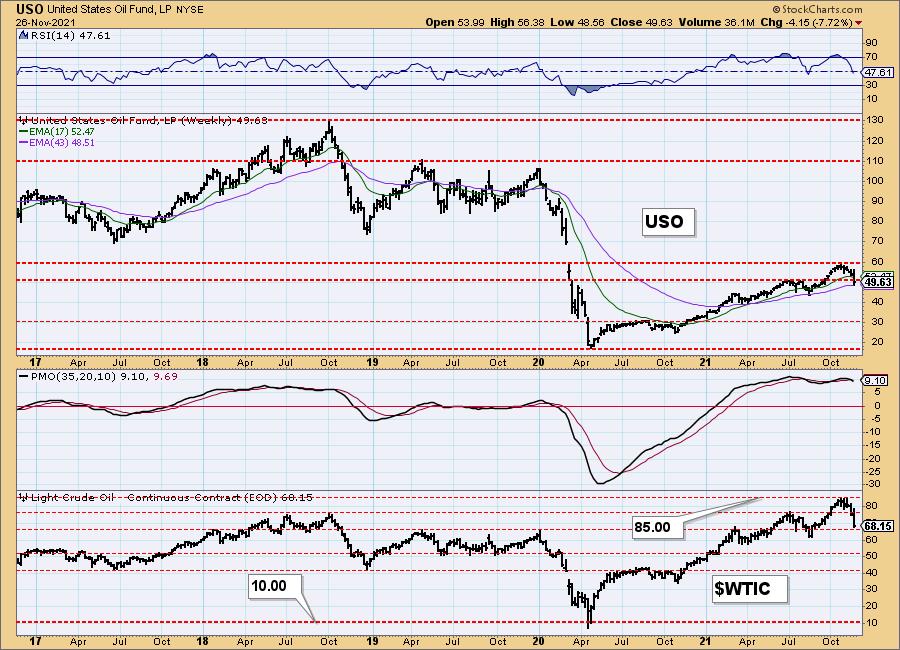
USO/$WTIC Weekly Chart: $WTIC is now testing long-term support at the 2019 highs. The weekly PMO had a negative crossover in overbought territory and the weekly RSI has hit negative territory. The last time we saw these conditions, it resulted in a reversal. Given supply and demand issues, we aren't overly bearish on Crude Oil.
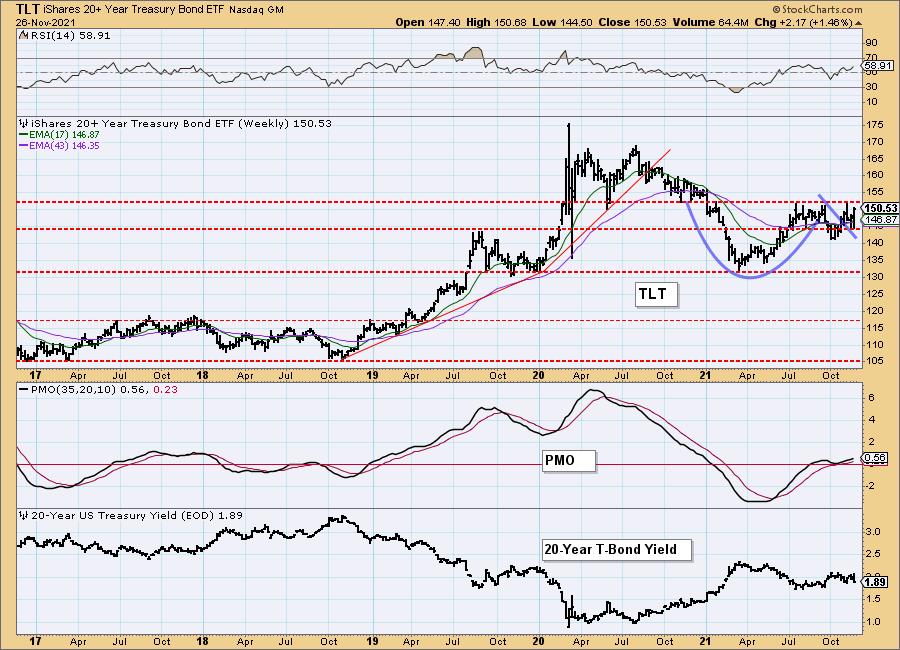
BONDS (TLT)
IT Trend Model: BUY as of 11/8/2021
LT Trend Model: BUY as of 11/5/2021
TLT Daily Chart: There was a clear flight into Bonds with today's sell-off in the broad markets. The TLT chart was already beginning to look bullish. In particular, TLT formed a bullish falling wedge. Price broke strongly from it and is now headed to test overhead resistance at $151.75.
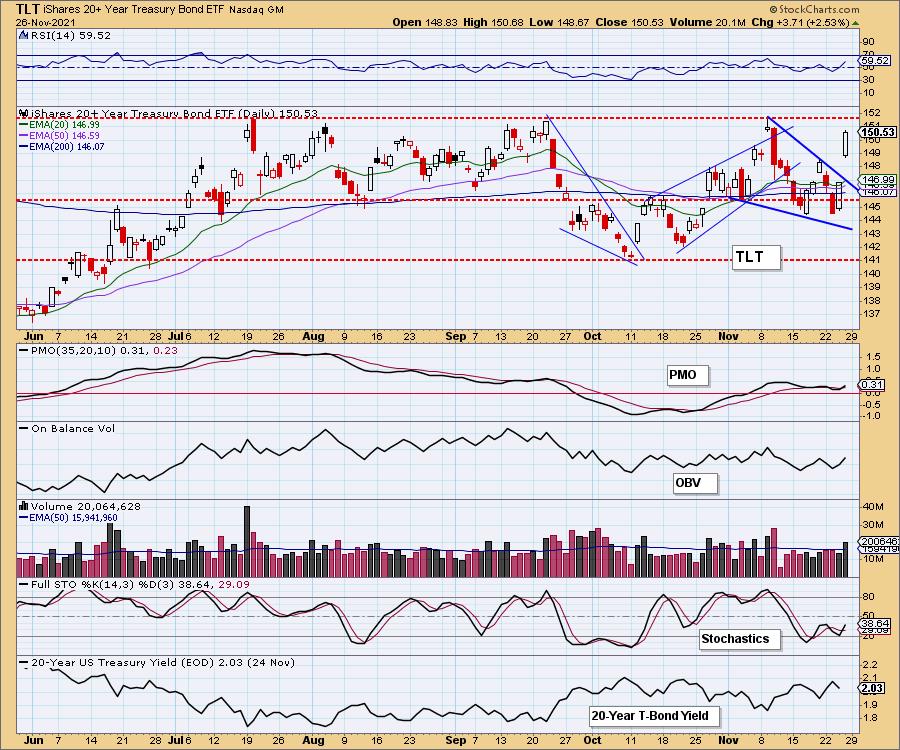
The PMO triggered a fresh crossover BUY signal and the RSI is now firmly in positive territory. We do see a bearish ascending triangle forming--flat tops and rising bottoms--so resistance could be difficult to overcome.
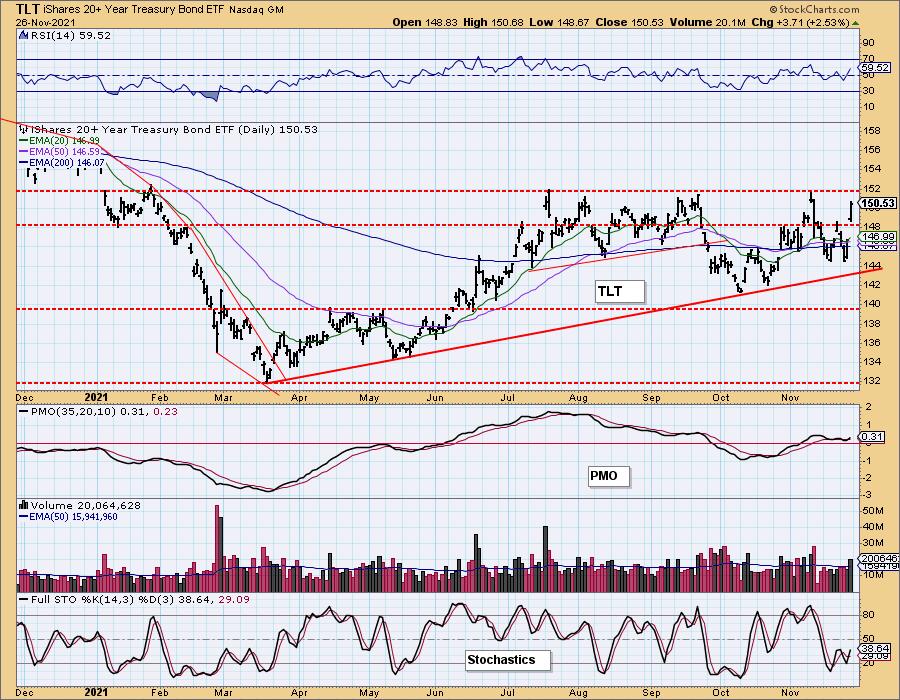
TLT Weekly Chart: The weekly chart has a bullish cup-with-handle pattern. While price has technically broken out of the "handle", it's still being held up at resistance. The indicators are looking good. The weekly RSI is positive, while the weekly PMO formed a bullish bottom above the signal line and is rising.
Technical Analysis is a windsock, not a crystal ball.
-- Carl & Erin Swenlin
(c) Copyright 2021 DecisionPoint.com
Disclaimer: This blog is for educational purposes only and should not be construed as financial advice. The ideas and strategies should never be used without first assessing your own personal and financial situation, or without consulting a financial professional. Any opinions expressed herein are solely those of the author, and do not in any way represent the views or opinions of any other person or entity.
NOTE: The signal status reported herein is based upon mechanical trading model signals, specifically, the DecisionPoint Trend Model. They define the implied bias of the price index based upon moving average relationships, but they do not necessarily call for a specific action. They are information flags that should prompt chart review. Further, they do not call for continuous buying or selling during the life of the signal. For example, a BUY signal will probably (but not necessarily) return the best results if action is taken soon after the signal is generated. Additional opportunities for buying may be found as price zigzags higher, but the trader must look for optimum entry points. Conversely, exit points to preserve gains (or minimize losses) may be evident before the model mechanically closes the signal.
Helpful DecisionPoint Links:
DecisionPoint Alert Chart List
DecisionPoint Golden Cross/Silver Cross Index Chart List
DecisionPoint Sector Chart List
Price Momentum Oscillator (PMO)
Swenlin Trading Oscillators (STO-B and STO-V)
DecisionPoint is not a registered investment advisor. Investment and trading decisions are solely your responsibility. DecisionPoint newsletters, blogs or website materials should NOT be interpreted as a recommendation or solicitation to buy or sell any security or to take any specific action.


