I practiced in public accounting for 20 years and was involved in a number of company valuations. I worked very little with public companies, but did have to value private companies on occasion. Most of the valuation metrics that I used in the 1980s and 1990s remain absolutely the same today. Some industries present few obstacles in determining an approximate value; others can be extremely difficult and judgment can vary greatly from one valuation analyst to another.
Utilities, for instance, have fairly steady earnings, which is why you don't see the volatility associated with utilities that you see with other sectors, whose earnings can accelerate or contract very quickly with the economy. When you're performing valuations, there are really three key drivers: (1) future earnings/cash flows, (2) rate of earnings growth and (3) interest rates. Valuations are complex, so I can't go into everything to consider, but using some arbitrary price earnings (PE) multiple is a MAJOR mistake. Some might say that an overall S&P 500 PE multiple of 20 is a fair valuation. That is just plain WRONG, in my opinion.
One of the key valuation metrics is interest rates. The 10-year treasury yield ($TNX) was 6.5% at the beginning of this century. Today, it's less than 1.5%. That alone will send equity valuations much, much higher. You will pay much more for a company that's growing its earnings 20% a year in a 1.5% rate environment than in a 6.5% rate environment. That is a FACT.
Here are the last 25 years of the TNX:
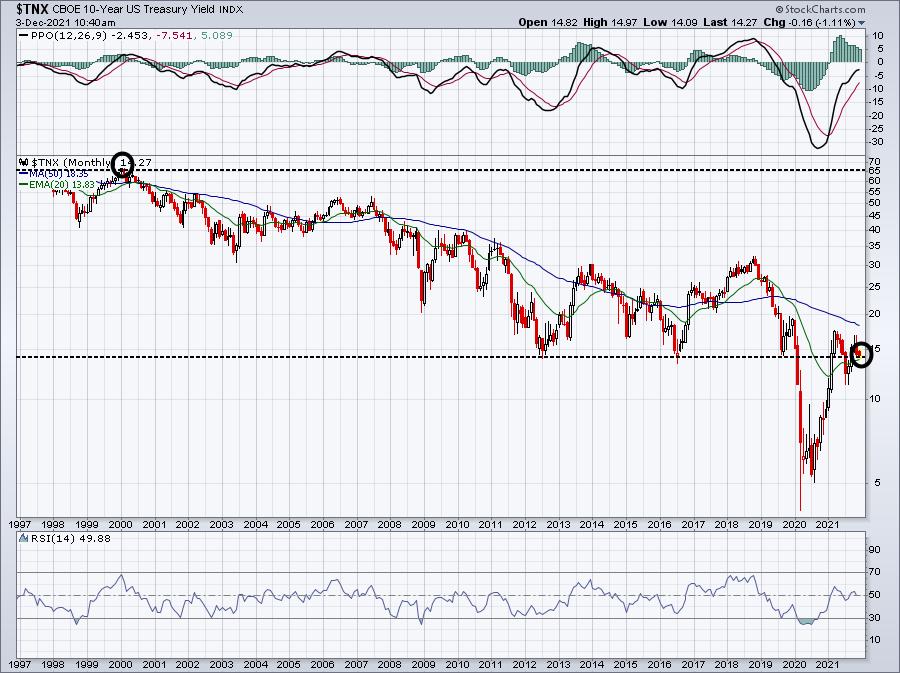
If earnings and earnings growth are exactly the same in 2000 and 2021, valuations will differ immensely. Why? Because the lower interest rate environment will "value" those earnings and growth rates much, much higher. The problems begin when growth companies warn about slowing revenue and earnings growth ahead. We want to own companies that are beating revenue and earnings estimates and raising forecasts.
Because these companies tend to outperform over time and are less likely to provide warnings, we keep ChartLists at StockCharts.com to organize our research. We have one ChartList to track companies that beat revenue AND earnings forecasts -- our Strong Earnings ChartList (SECL). We also have a second ChartList to track companies that have raised guidance -- revenues and/or earnings -- and we keep those in our Raised Guidance ChartList (RGCL). Wall Street also has a much better chance of identifying companies that will beat and raise estimates as they meet with company management teams throughout the quarter. In addition to rising prices, a rising AD line (accumulation/distribution) can signal to us companies that Wall Street is accumulating. We track those companies in a third ChartList, our Strong AD ChartList (SADCL).
When a company is on each of these 3 ChartLists, I believe there's a much better chance to justify its valuation (market cap), so I created a fourth ChartList, our Bullish Trifecta ChartList. This is a ChartList of all companies that appear on each of our other three ChartLists. It's a powerful list of companies that, quite honestly, are being trashed with the rest of the market right now, but I'd keep an eye on their AD lines during this period of selling. If those AD lines remain strong, I believe these companies will be among the best performers when the stock market rebounds.
This Bullish Trifecta ChartList is updated on our site periodically, but once our EarningsBeats.com members have the first three ChartLists, they can run a scan against these ChartLists to find the common stocks on the three. Currently, there are 59 companies on this list, of which more than half (31) have SCTR scores of 90 or better. Only 4 have SCTR scores less than 50. The top SCTR score (99.7) belongs to ON Semiconductor (ON), which is one of the few growth stocks that has been largely unaffected by the selloff the past 10 days or so. Check out ON's chart:
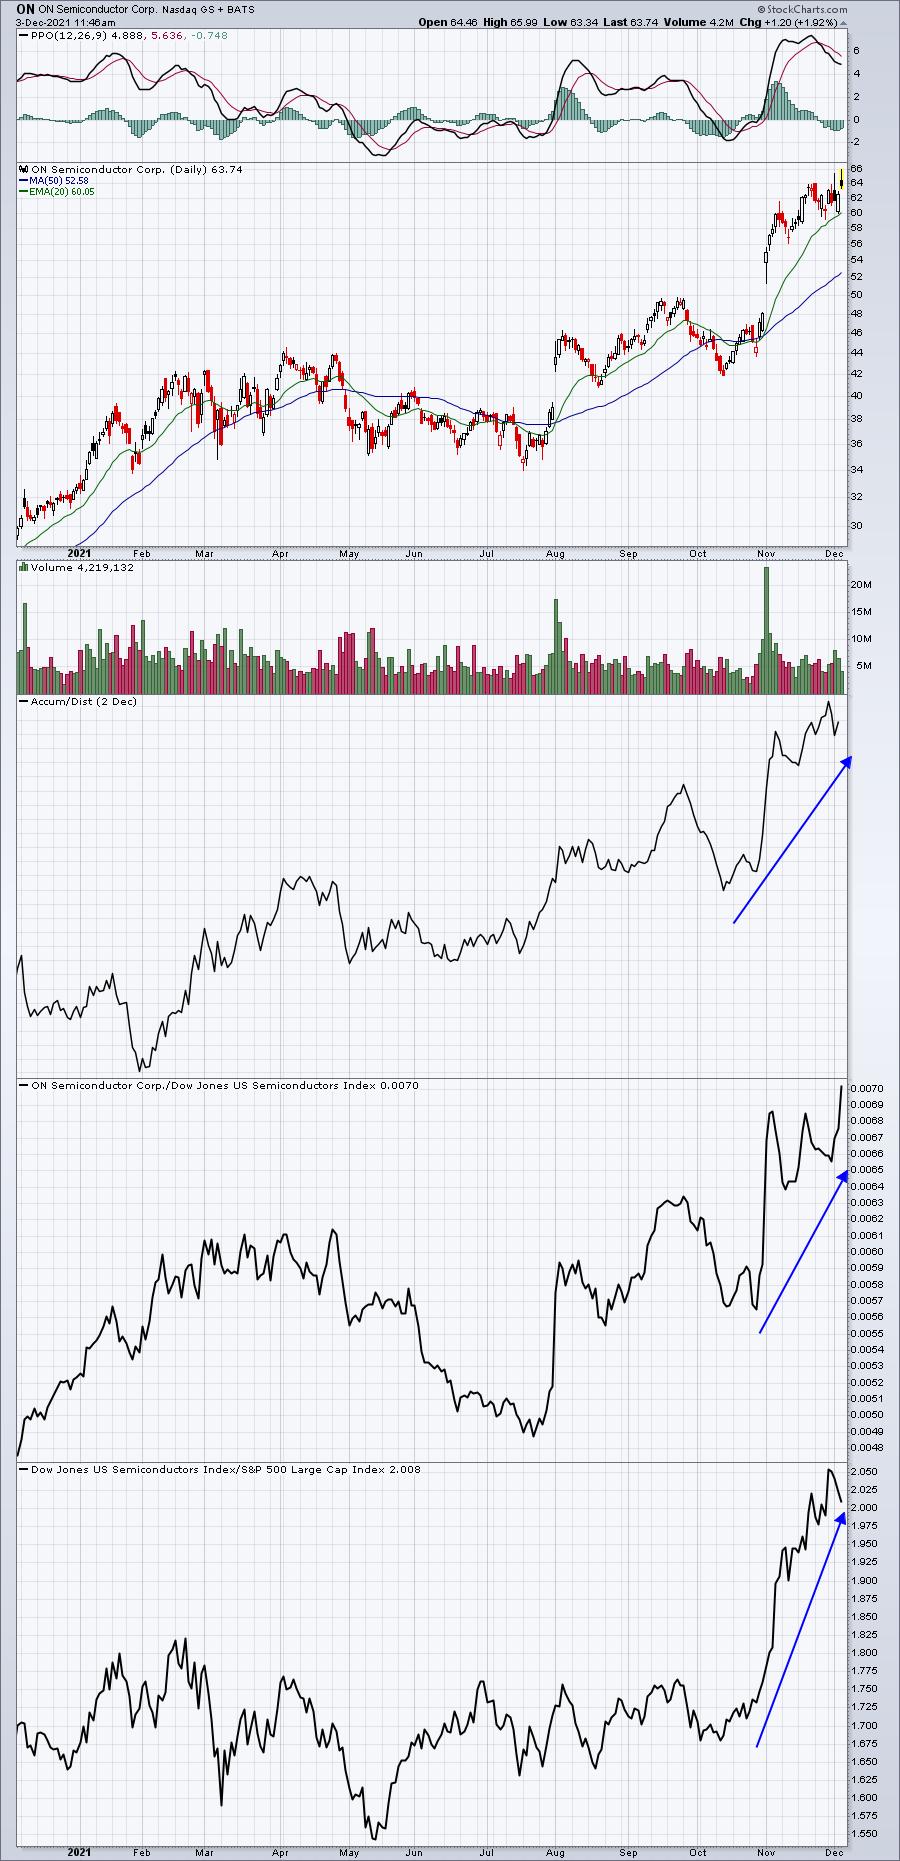
ON has been an excellent absolute and relative performer and could certainly see some profit taking soon, but there's little doubt about its leadership. Part of that reason is that Wall Street loves the fundamentals here and is able to justify a high market valuation based on its continuing increasing earnings and positive revisions.
For one day only, I will provide our Bullish Trifecta ChartList to everyone in our EarningsBeats.com community. Members already receive this ChartList periodically, but on Monday I'll provide it to everyone on our FREE EB Digest subscriber list. It's 100% free with no credit card required. Simply CLICK HERE to provide your name and email address to subscribe. You can unsubscribe at any time. I'll send you the link to this powerful list in our EB Digest on Monday!
Happy trading!
Tom


