Thursday's action was quite positive for several sectors, as they experienced positive two-day price formations. These patterns are only of a short-term nature and usually have an effect for between 5 and 10 days, so they do not represent major signals. However, since this action is coming off an oversold 9-day RSI, these positive implications could buy some time for both these sectors and the overall market. Think of its as a kind of reverse domino effect.
Three Turnaround Candidates
For example, Chart 1 shows that the SPDR Energy ETF (XLE) has experienced a bullish two-bar reversal. These patterns are formed after a decline. The first bar opens near its high and closes near its low, reaffirming that the sellers are in control. The second bar does the exact opposite by opening near its low, which is also near the previous close, but ending the session near its high. That action indicates that the buyers now have the upper hand. Both bars should be relatively wide, indicating a large battle between buyers and sellers. The two for the XLE are okay, but not impressively so. Finally, it's better (but not mandatory) for the volume to pick up on the second day of the pattern, which it does.
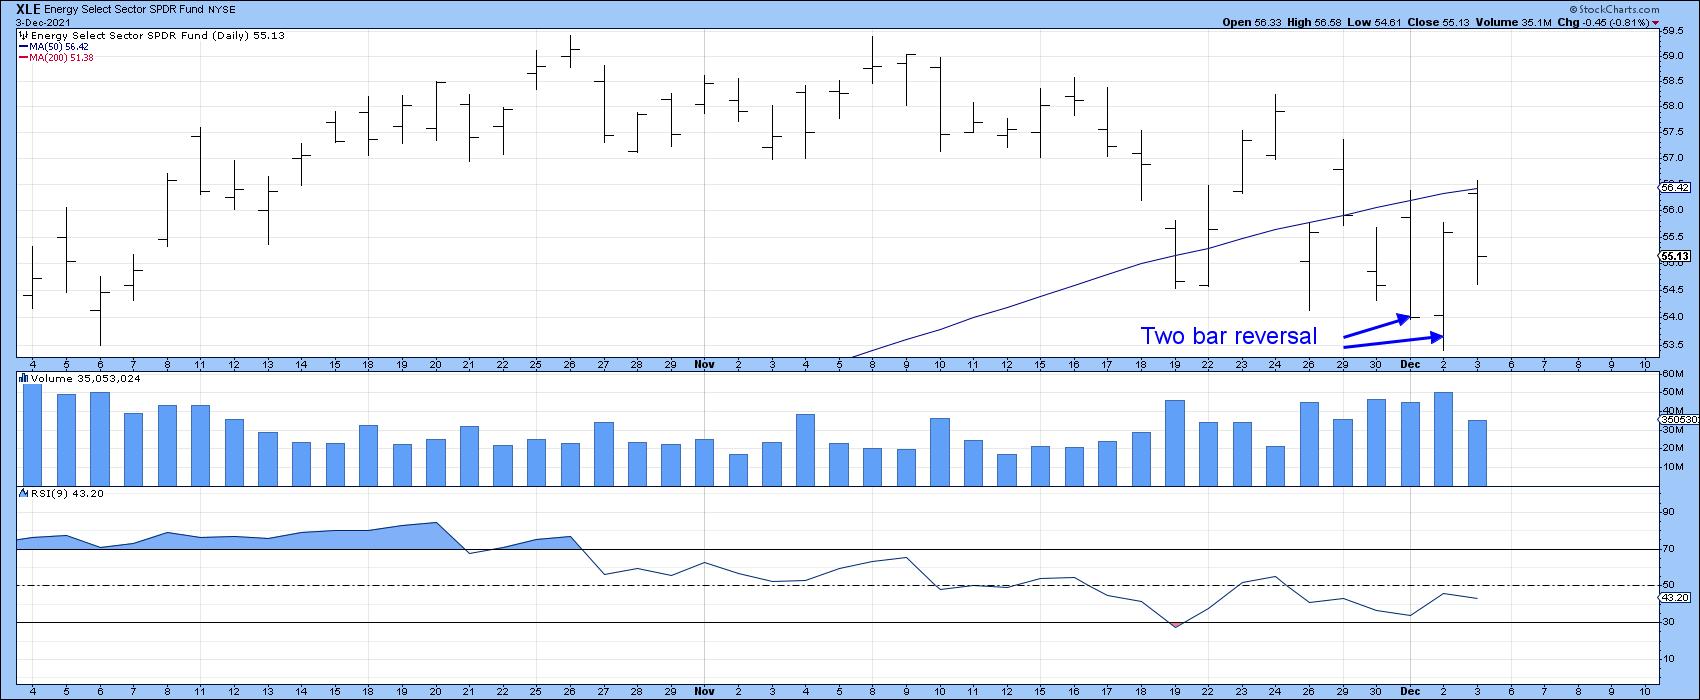 Chart 1
Chart 2 backs up this bullish action with the US Oil Fund (USO). In this case, the two-day pattern comes in candlestick format, with a pattern known as a bullish piercing white line. These are whipsaw-type formations, which occur when the opening price develops under the low of the previous candle, but closes more than halfway up its real body. Note also that the close developed just slightly above the red 200-day MA and that the RSI is deeply oversold. A little more strength from here would indicate that the downside MA crossover was a whipsaw.
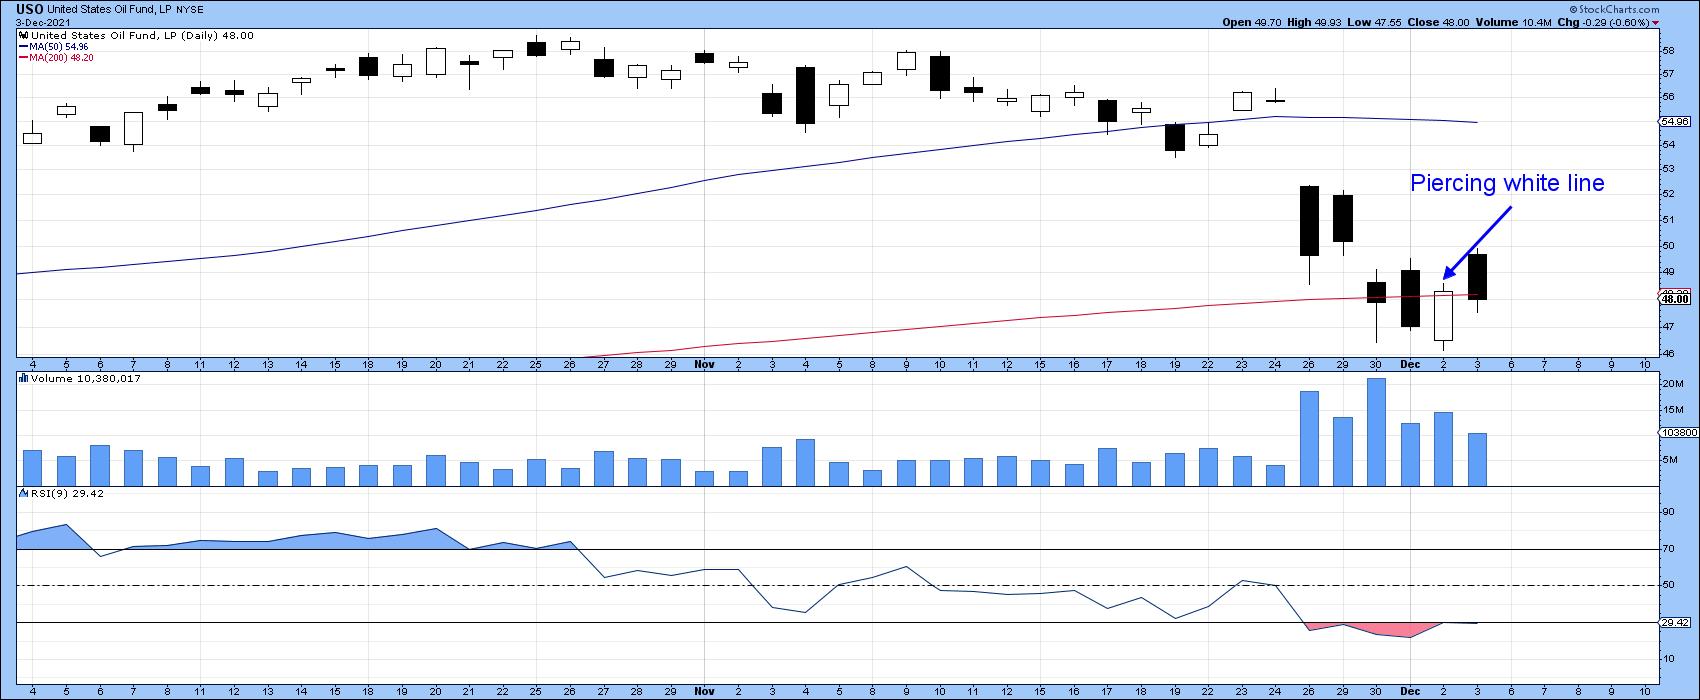 Chart 2
The SPDR Industrials are also sporting a bullish two-bar reversal coming off an oversold RSI. The three heavy volume bars this week are suggestive of a selling climax.
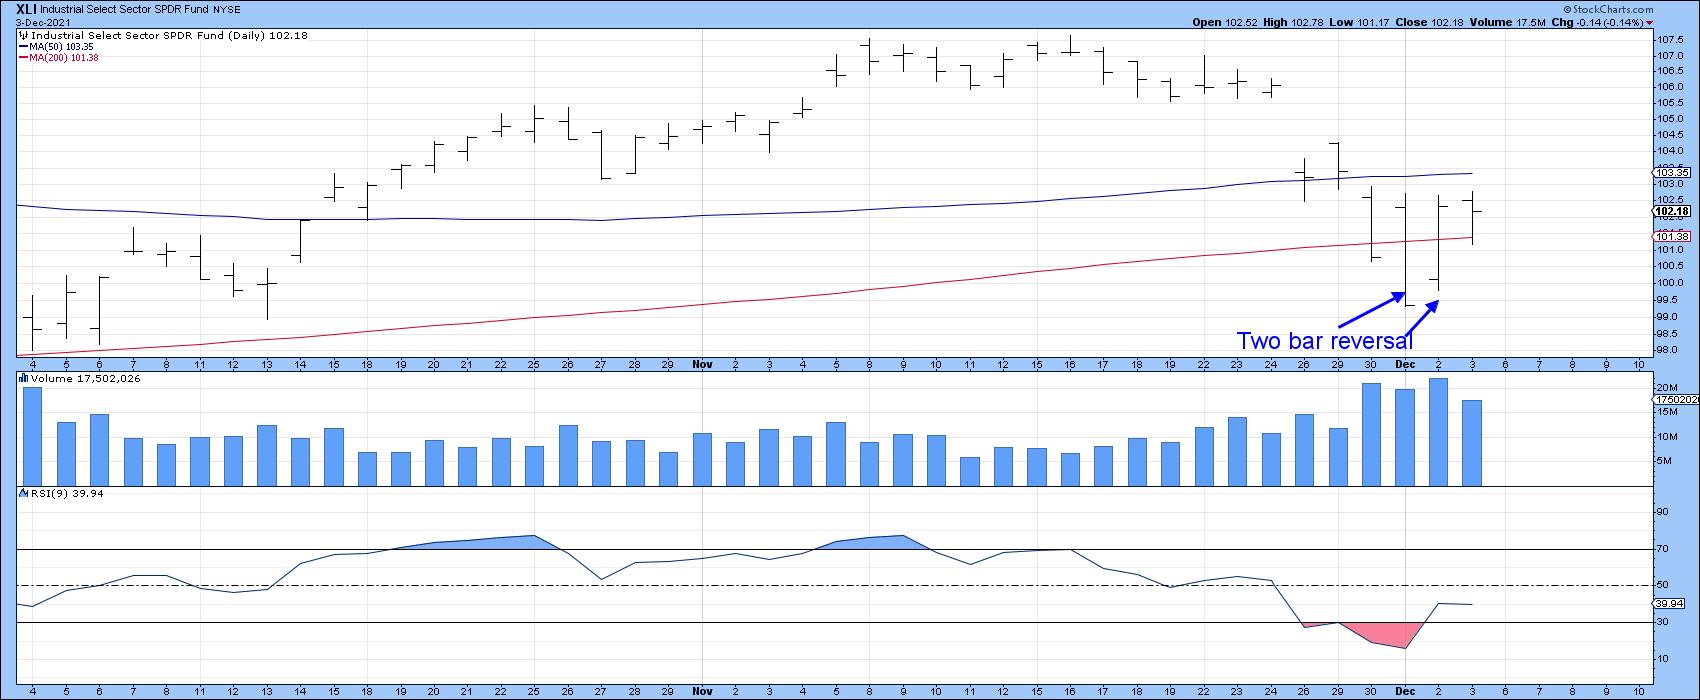 Chart 3
The SPDR Financial ETF (XLF) also has a mild case of a two-bar reversal, but Chart 4 features the iShares Broker dealers ETF (IAI), which is one of its components. This pattern is also forming with slightly higher activity on the second bar, as the RSI bounces off its oversold zone.
 Chart 4
Short-Term Market Indicators
To be sure, very few short-term market indicators have yet to show signs of life. Take the 10-day EMA of the NYSE Percent of Stocks Above their 200-day MA. It has fallen to a new low under its October bottom. That's not a good sign. The NYSE Composite itself is close to its red support trendline, so, unless it continues to bounce, things could turn ugly again.
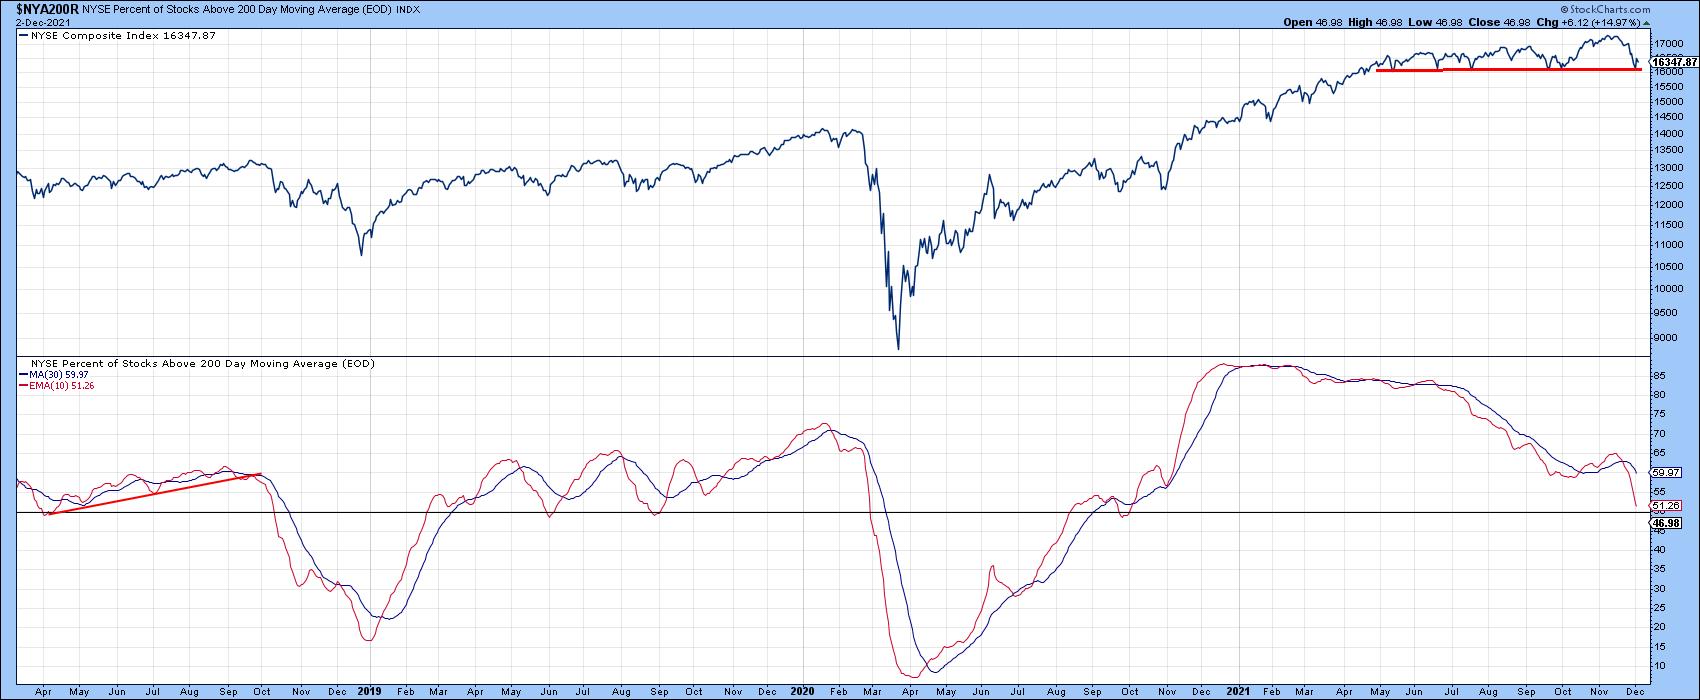 Chart 5
On the other hand, some shorter-term indicators are deeply oversold and, therefore, look more likely to reverse to the upside. In this respect, Chart 6 shows that the 10-day EMA of the NYSE common stock McClellan Volume Oscillator has fallen below the green horizontal line marking the buying zone. It's therefore likely to turn up at any point. Note that most previous reversals have been followed by a nice rally. A reversal hasn't happened yet, of course, but it's possible that those two-bar reversals will buy enough time to enable that to happen.
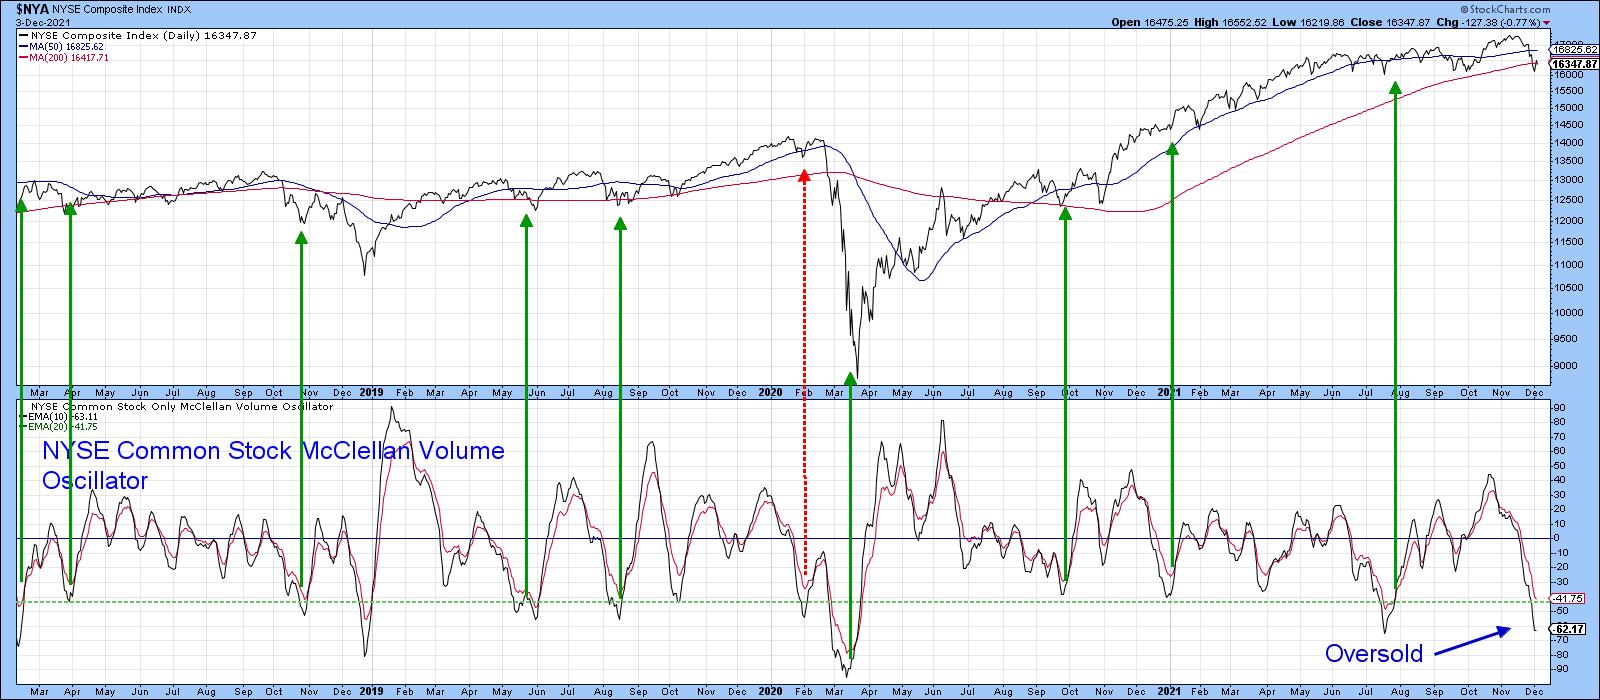 Chart 6
Chart 7 shows that this week's action has resulted in a selling climax for the DJIA ETF (DIA). In this instance, the arrows show when the price volume oscillator (PVO) is overbought and the RSI is oversold. Except during extremely weak technical positions, such as that of February 2020, such action is positive.
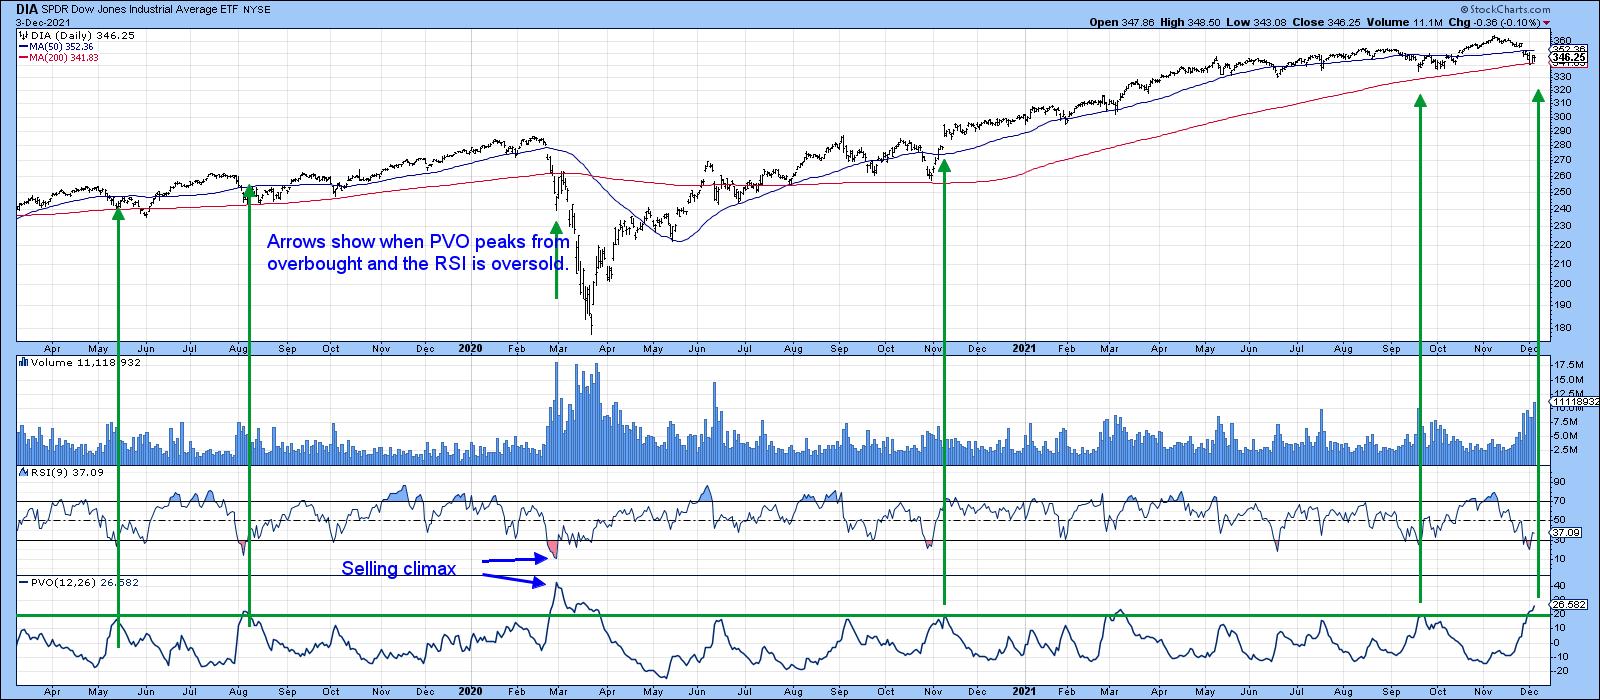 Chart 7
Finally, Chart 8 features a 10-day ROC of the VIX. Previous reversals from a position above the +25% line have usually resulted in a rally. If the positive indications being given from the three positive sectors are valid, then that should mean that the VIX ROC has peaked again.
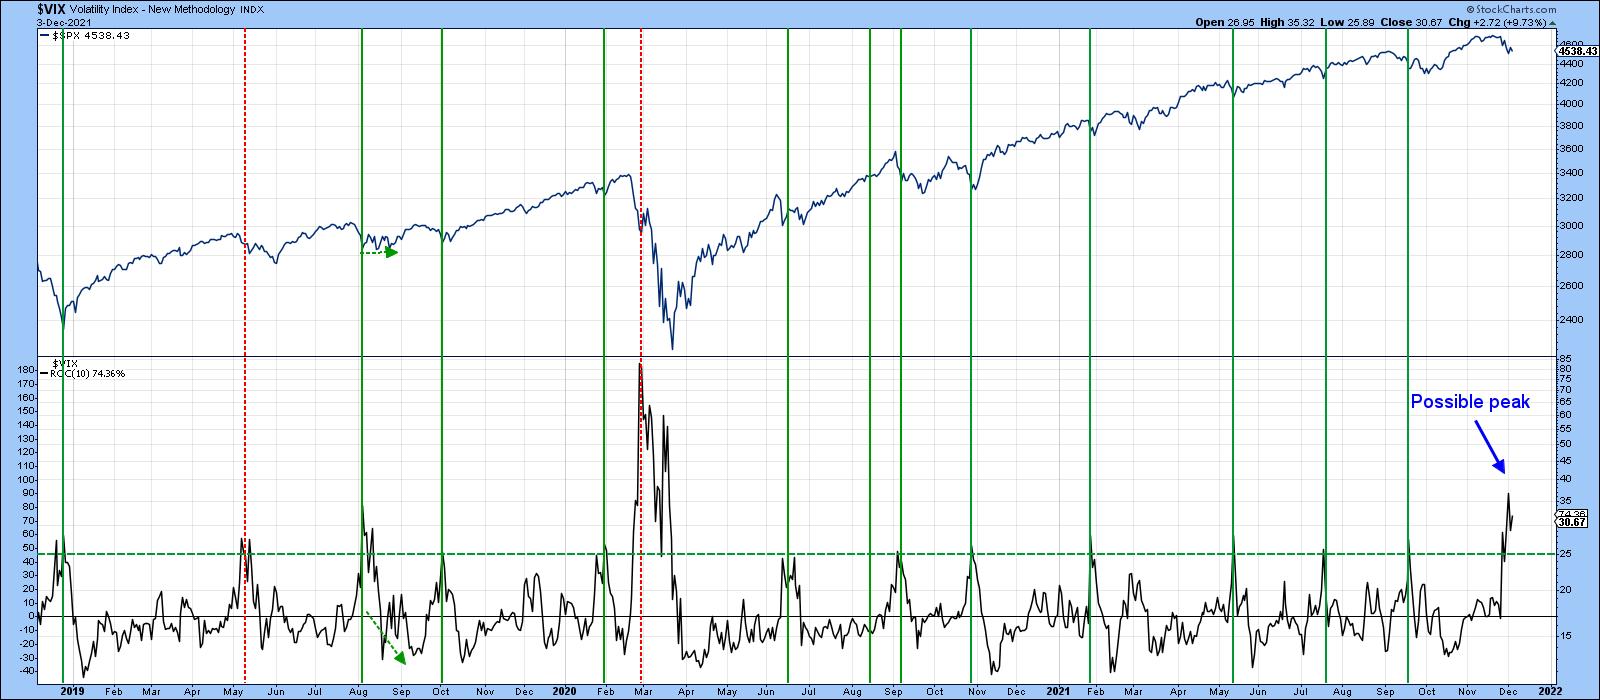 Chart 8
Conclusion
After a nasty short-term drop, several indicators are showing signs of bottoming. So far, these indications are tentative, but, since it's a bull market until proven otherwise and we are entering the positive year-end period, there is a pretty good chance that the worst may be over. If, on the other hand, the market immediately takes out these two-bar reversals, all bets of a bottom forming would be off. Even worse, a rally to a new high with little conviction, followed by a move below last week's lows, would represent a characteristic usually found in bear markets.
This article is an updated version of an article previously published on Thursday, December 2nd at 7:05pm ET in the member-exclusive blog Martin Pring's Market Roundup.
Good luck and good charting,
Martin J. Pring
The views expressed in this article are those of the author and do not necessarily reflect the position or opinion of Pring Turner Capital Group of Walnut Creek or its affiliates.


