
Here we are, on the last day of the year, writing my last ChartWatchers newsletter contribution for 2021.
By the time you are reading this, it will be 2022. So let me kick off by...
wishing you a very happy and above all healthy new year!!
Given the situation the world is in at the moment, things can get a lot better in a lot of areas!!
Of course, I have been thinking about some New Year's resolutions with regard to the RRG charts, the RRG blog, and Sector Spotlight. I don't think any of these are "broken", so we don't have to "fix" anything. But we can always try to improve.
One of the things I am really looking forward to is working with the dev team at StockCharts.com, both to add new features and generally improve the RRG charting capabilities both on SharpCharts and bringing RRG to ACP. We have a ton of ideas!!
On the content side (blog and video) I am thinking of having more "structural" segments. In Sector Spotlight, there are a few, like the seasonality segment I do every last Tuesday of the month and the monthly charts that I talk about every first Tuesday of the month. But I believe there can be more of those. Maybe as simple as maintaining a table with "+ / = / -" per sector at the end of each episode of Sector Spotlight or setting up a public chartlist for that. And/or break that down to groups -- and maybe even stocks as well.
The biggest problem, probably, will be to keep up with the writing. Finding and researching all the sectors, groups and stocks is one thing, but writing an article or presenting them in Sector Spotlight on the how, why and what takes up a lot of time. So I need to find a way that balances out getting interesting content and findings in a more structural way without getting boring for readers of the blogs and watchers of the show.
Another one of my plans is to write a "living article" that is essentially an inventory of more educational (parts of ) blog articles and SSL (and other videos). This will also be an investment for me, as many emails that I receive are related to "where can I find more info on .....?" Being able to refer to an article that lists all, or at least a lot, of resources will be a time saver!!
I'm sure we'll get there and if you have any brilliant ideas... just let me know.
Stocks Remain Strong
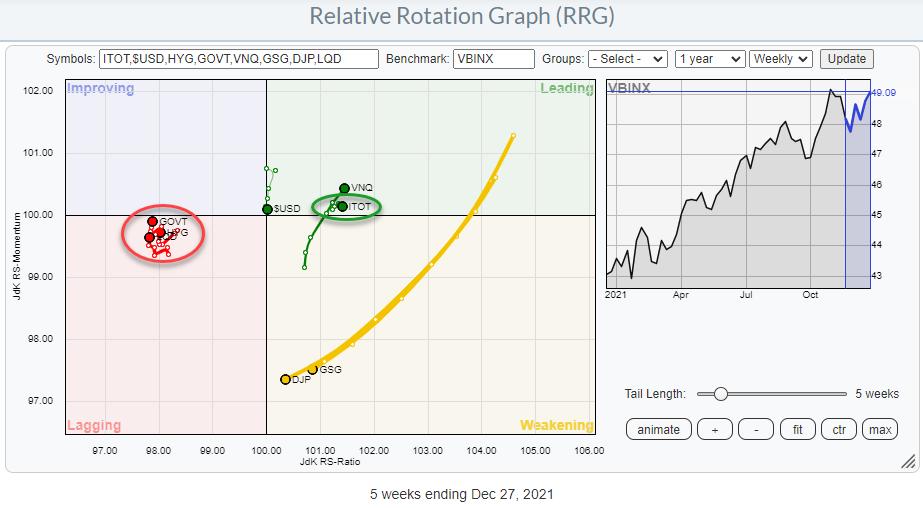
Going into the new year, the rotation for stocks (ITOT) on the Relative Rotation Graph for asset classes remains positive.
Looking at the RRG above, we find stocks inside the leading quadrant at a very short tail. That means that a stable (short tail) relative uptrend (right-hand side of the graph) is still in play. The opposite is found for Government bonds (GOVT), as well as the other fixed-income related asset classes (HYG, LQD) on the left-hand side of the graph.
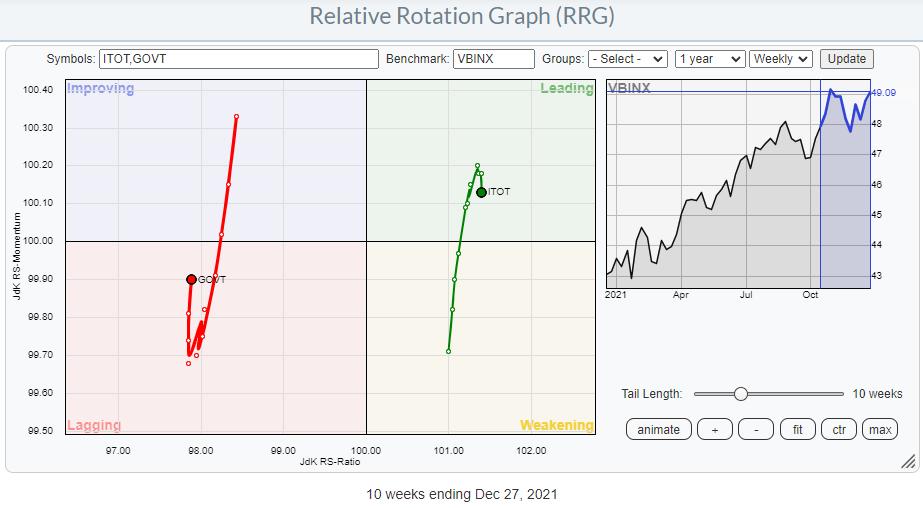
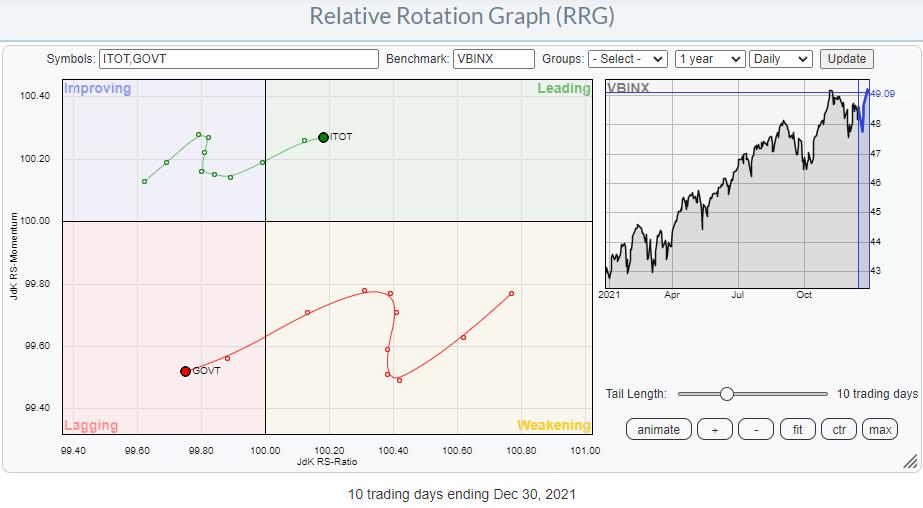
If we zoom in and blow up the rotation for ITOT and GOVT, we can see a slight weakening for ITOT and improvement for GOVT over the last few weeks. At the moment, that does not change the preference for stocks over bonds. As a matter of fact, plotting the same ETFs on a daily RRG already shows renewed strength for ITOT vs GOVT.
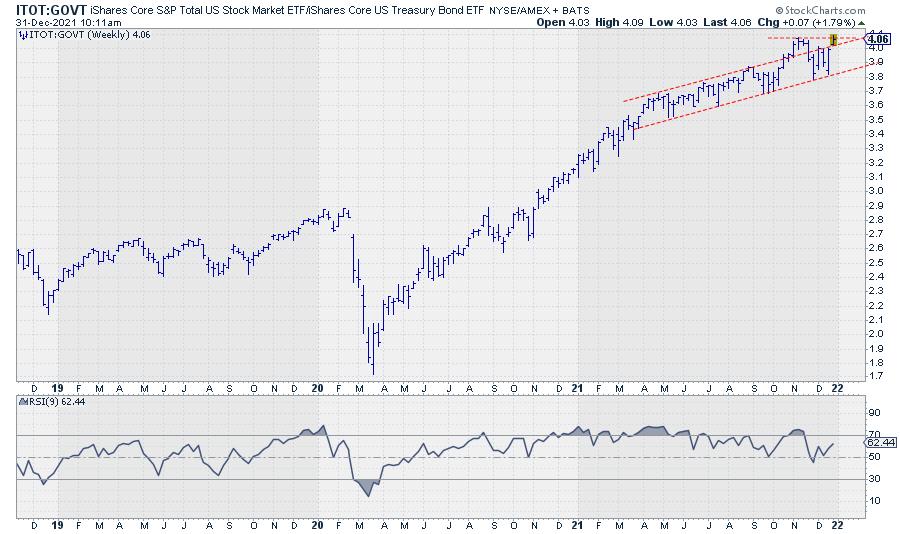
The outright comparison between stocks and bonds in the graph above shows the recent improvement for stocks, as the ratio just jumped away from a small correction, which brought it down to the lower boundary of the rising channel that was in play for most of 2021.
Breaking convincingly above its previous high will very likely set the stage for the first few weeks of 2022.
#StaySafe, --Julius
My regular blog is the RRG Charts blog. If you would like to receive a notification when a new article is published there, "Subscribe" with your email address.
Julius de Kempenaer
Senior Technical Analyst, StockCharts.com
Creator, Relative Rotation Graphs
Founder, RRG Research
Host of: Sector Spotlight
Please find my handles for social media channels under the Bio below.
Feedback, comments or questions are welcome at Juliusdk@stockcharts.com. I cannot promise to respond to each and every message, but I will certainly read them and, where reasonably possible, use the feedback and comments or answer questions.
To discuss RRG with me on S.C.A.N., tag me using the handle Julius_RRG.
RRG, Relative Rotation Graphs, JdK RS-Ratio, and JdK RS-Momentum are registered trademarks of RRG Research.
