While charting is always an interesting look back, it looks like the solar charts have had a bit of shade, with two real peaks and valley's in 2021. As the world energy crisis adds continent after continent to its grasp, I would expect these charts to gather some power for another rally in 2022. As I roll through the list of companies, the charts still look weak, but shopping is part of the process, watching for the change in investor sentiment.
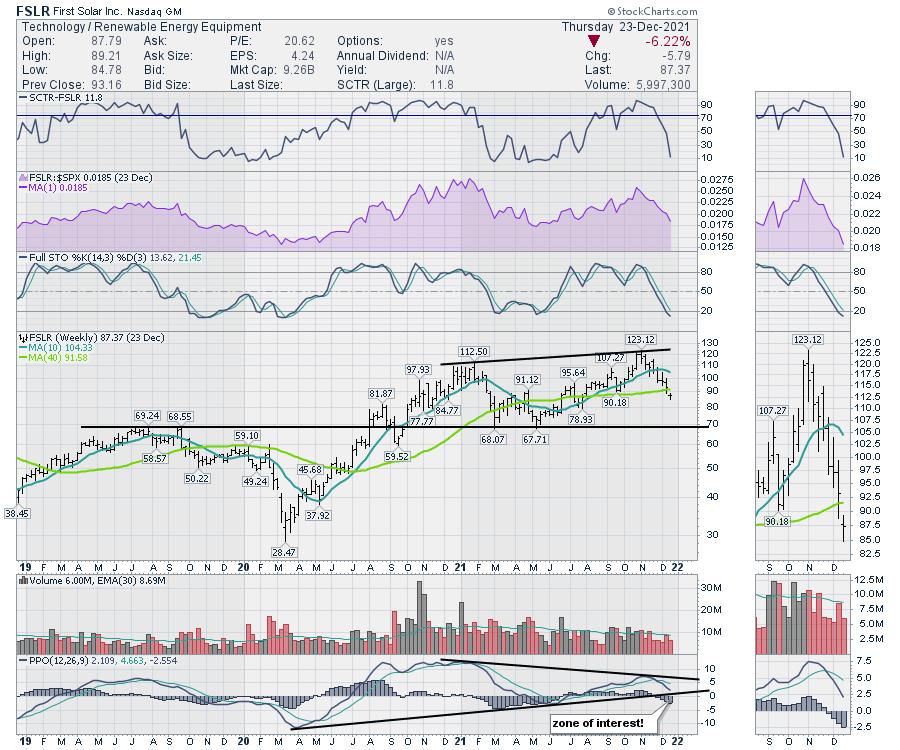
I noticed First Solar (FSLR)'s offices in Phoenix a few weeks ago. Let's start there. First Solar had a massive run in 2020, topping out in early 2021. After a big pullback, it soared to a new high in late October, made a higher high the next week and then dropped 30% in under 2 months. You'd think the sun stopped shining in December! There is a low at $80 that might provide support, but the big horizontal area is $70. For the PPO momentum indicator, the trend line and the zero level are both in play here. The full stochastic is already under 20%, so we have numerous reasons to keep watching this name for an upside ride.
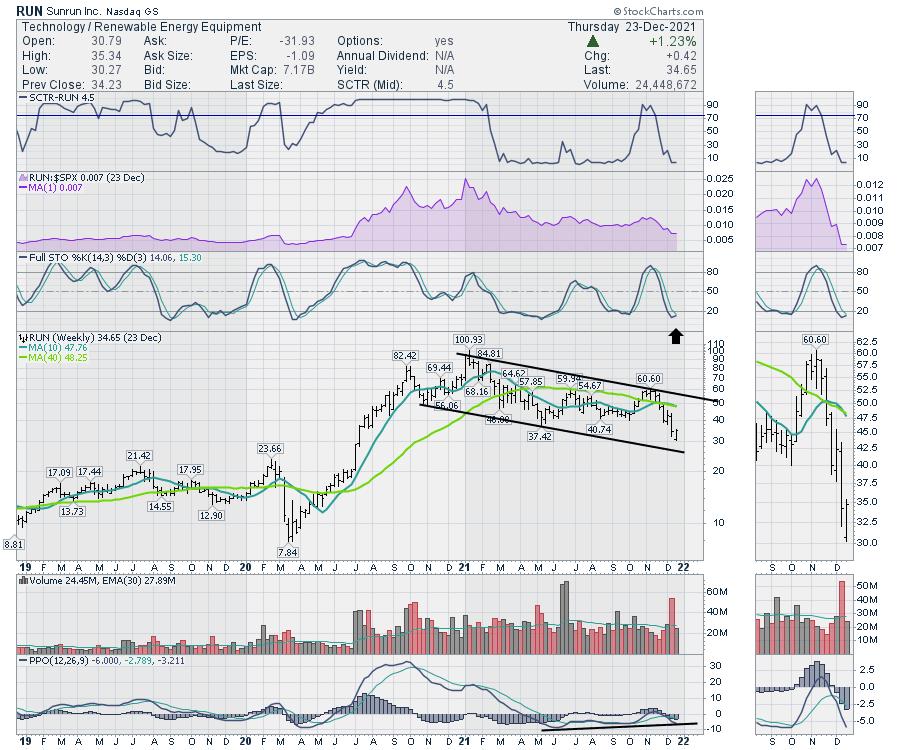
Sun Run (RUN) is a big one. The problem with the chart below is the developing downward channel since the beginning of the year. While there is hope for a bounce off the lower trend line, all the major support areas are broken until you get to $22. The huge volume last week occurred almost every day, so it was not just an Options Expiration Day.
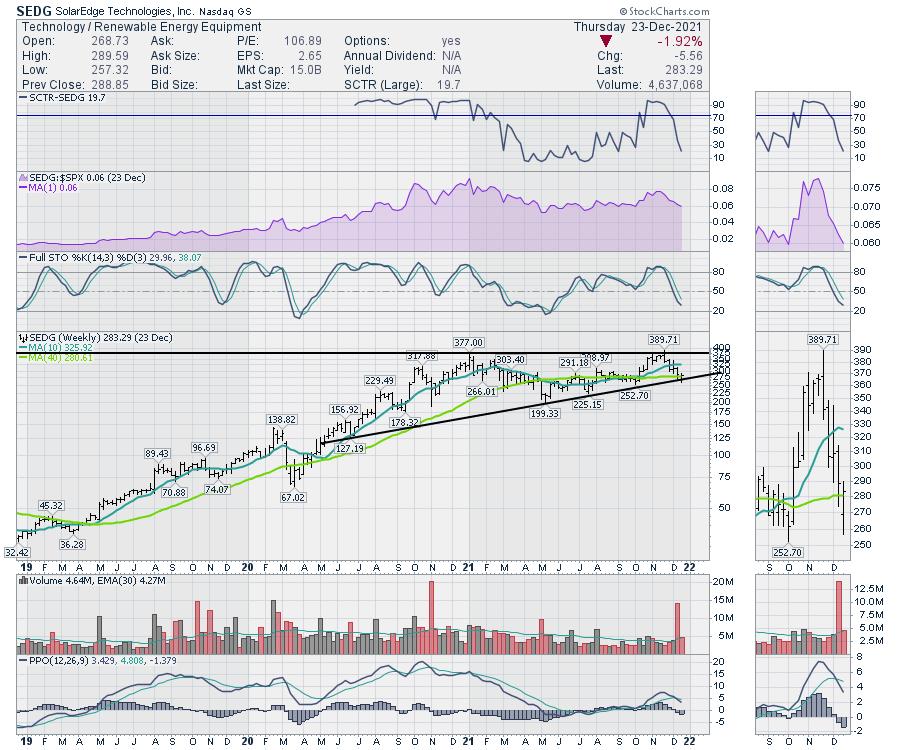
SolarEdge (SEDG) has been a strong name in the industry, but it is moving lower right now. There is a small reason for optimism as it comes to rest on the up-sloping trend line. If the stock can push higher after making a big push off the lows this week, this is not a bad area to expect a bounce. But this stock also failed to hold a breakout, much like FirstSolar. Perhaps we need to see some stocks improving over multiple weeks before getting interested.
I think the larger question here is "Why are all the stocks in the industry group so weak, and what would have to change to get them to start improving?" I will look for the charts to change shape rather than examine the macro factors facing the industry. When the more astute investors start supporting the stocks and build some momentum higher, then I'll be interested. Until then, it looks more like watching a sunset is in order.
Wishing you all the best for the holiday season and may 2022 be the best year yet!
Good trading,
Greg Schnell, CMT, MFTA
Senior Technical Analyst, StockCharts.com
Author, Stock Charts For Dummies
Want to stay on top of the market's latest intermarket signals?
– Follow @SchnellInvestor on Twitter
– Connect with Greg on LinkedIn
– Subscribe to The Canadian Technician
– Email at info@gregschnell.com


