 The Nasdaq 100 ETF (QQQ) reversed its uptrend signal from April 17th, 2020 as two trend-following indicators turned bearish this week. The chart below shows QQQ with the deepest decline from a high since the 10.9% decline in February-March 2021. Prior to that, the deepest decline was in September 2020 (-12.6%).
Even though these two declines were deeper than the current decline (10.4%), they did not trigger downtrend signals and were deemed pullbacks within the bigger uptrend. This decline is different because the Trend Composite turned negative (-3) this week, which means four of the five indicators triggered downtrend signals. Also note that StochClose moved below 40.
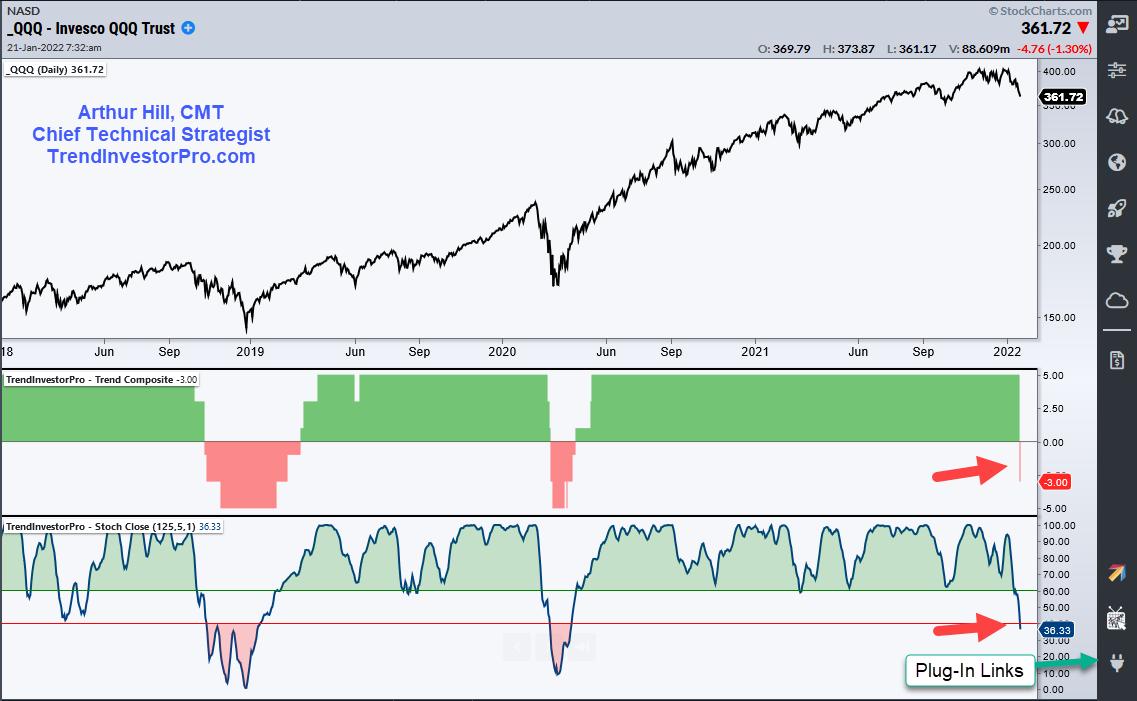
The green and red shadings show the prior trend signals for the indicators. We will focus on the Trend Composite signals. On the last two completed bullish signals, QQQ gained some 69% from April 2020 to January 2022 and 52% from July 2016 to October 2018. The two downtrend signals were mixed. The bearish signal on October 24th avoided the meltdown in late 2018. The downtrend signal on March 12th was near the covid low (March 23rd), but it perhaps preserved a little sanity by having a strategy in place.
Keep in mind that trend-following indicators by definition lag. They will not catch the exact bottom or top, but will catch an extended trend should it develop. Trend-following indicators can also limit drawdowns. Note that QQQ experienced two drawdowns in excess of 50% since 2000 (2003 and 2009), as well as a 28% drawdown in March 2020. Having a strategy for entry and exit can help capture the upside and limit the downside.
The Trend Composite and ten other indicators are available on the TIP Indicator Edge Plugin for StockChartsACP (here). The Trend Composite aggregates trend signals in five trend-following indicators: Bollinger Bands, Keltner Channels, Moving Average Direction, StochClose and CCI Close. The Trend Composite turns bullish when at least three of five signal uptrends (+1) and bearish when at least three of five signal downtrends (-1). Different indicators work at different times and the Trend Composite is designed to capture the combined signals.
TrendInvestorPro specializes in finding bullish setups within bigger uptrends in our core list of 129 ETFs. We also have a Composite Breadth Model for broad market timing as well as an ETF Ranking and Trend Signal Table. Click here for more information.
---------------------------------------------------
Choose a Strategy, Develop a Plan and Follow a Process
Arthur Hill, CMT
Chief Technical Strategist, TrendInvestorPro.com
Author, Define the Trend and Trade the Trend
Want to stay up to date with Arthur's latest market insights?
– Follow @ArthurHill on Twitter


