Normally, the stock market is humming along and we have indicators all supporting the sustainability of that move higher. But things aren't normal right now.
It started with the rotation into defensive sectors to lead the S&P 500 higher on that last final leg in December. These types of signals do not provide me a guarantee; they simply help me to manage risk. Once I saw the defensive leadership spurring the S&P 500 to new all-time highs, I'd seen enough. The fundamental red flags were already out there with rising inflation and the Fed turning more hawkish, but I don't buy and sell based on those. I need to see it on the charts, and, in November and December, I began to see exactly that. Wall Street turned to defense -- and when they play defense, they do it like the 1985 Chicago Bears.
This is just the start of the problems we face ahead. Technical breakdowns have been occurring by the hour and, as more technicians sell and begin shorting, that'll start a period of disbelief. After all, we've been going straight up since March 2020. The Reddit folks don't even know what a correction looks like, let alone a bear market. Sentiment has reached heights of bullishness that we've never seen before and, unfortunately, could result in a stunning and painful drop here in Q1.
As the Volatility Index ($VIX) heats up, you should expect big moves in both directions, but, for now, I'd view the U.S. stock market as downtrending until we can reset sentiment.
Equity Only Put Call Ratio ($CPCE)
The CPCE is a big problem. Options traders have been pouring into calls, despite the fact that they've been growing more and more expensive. The VIX is a measure of expected volatility. When the VIX rises as the S&P 500 rises, it's a warning, because it means that the stock market is growing much more nervous even though prices continue to rise. Historically, that's a pretty significant warning sign.
Since 2018, we've made four consecutive tops (all-time highs) with four consecutive higher VIX readings. Eventually, that will catch up with us and it is....now. As the VIX rises, options see their premiums rise and they become more expensive. Yet options traders just keep buying them -- at any price. It reminds me of someone buying crack; they don't care what the price is, they just have to have it.
Many retail options traders are greedy. They can't step back and look at the big picture. They don't know when to tone it down. They just buy because the only way to make a LOT of money is to keep buying calls. Well, in a bear market, that strategy is one that will ruin a lot of traders. Unfortunately, I see it coming.
So let's look at a couple charts. The first one may be a refresher to some of you, but it's important not to lose sight of it to keep everything in perspective. Perspective will be critical over the next 3-6 months, in my opinion.
S&P 500 -- 15-year weekly chart:
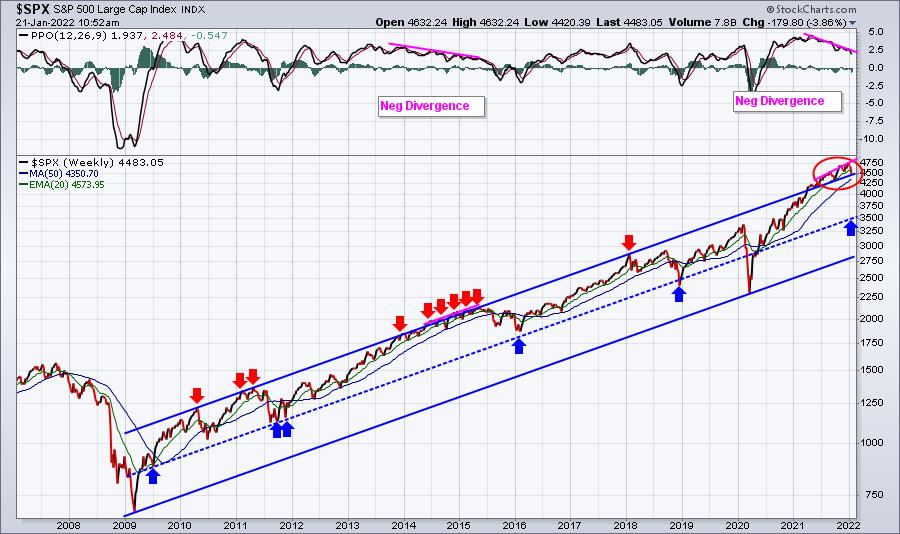
I see many similarities to the 2013-2016 period, a straight-up market with weekly negative divergences and very bullish sentiment. In 2015 and 2016, you can see the drops that took us back fairly close to that blue-dotted centerline in the 13-year trend higher. The 2007-2009 financial crisis and the March 2020 pandemic collapse established key long-term trend support, while we've seen several tests of that blue-dotted centerline. I'd consider that to be the real downside potential during any period of selling. That number, right now, is close to 3500 on the S&P 500, which is another 20% or so lower from current prices. I don't believe we'll reach that rising dotted line, but we could get close.
It's important to understand that we see significant swings in sentiment and investor psychology in the stock market, and it can have VERY significant implications on market performance in both the short-term and long-term. We have experienced a run-up in U.S. equities like very few others. The S&P 500 was at 2191 in March 2020 and just recently set an all-time high at 4818 on the second trading day of this year. That's a 120% gain in 22 months! Even if we consider the S&P 500 all-time high of 3393 on February 19th, before the pandemic collapse, the S&P 500 still rose 55% from that date through January 2nd. Given the massive run up, don't you think it's at least possible that the market could trend lower for awhile?
I believe the biggest problem we face is that we need to reset sentiment to a more bearish level before the stock market can truly take off again. We've simply been too bullish in the options world and we're about to pay the price.
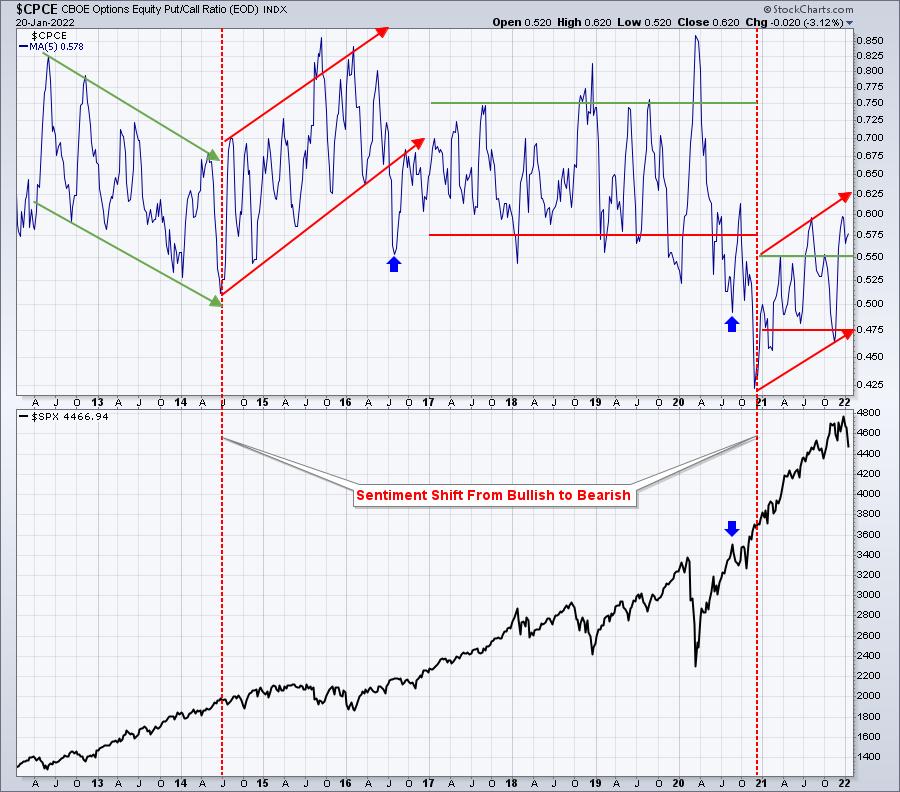
At the far left side of the chart, back in 2012 into 2013, you can see the CPCE dropping over time, moving from a bearish sentiment to a more bullish sentiment. That change in sentiment drove the S&P 500 soaring higher. But the red-dotted vertical lines both highlight changes from extreme bullish sentiment readings to more bearish readings. I think it's significant that the transition began in 2014, but market bottoms weren't reached until bearish sentiment peaked. I believe that's the road we have ahead. We are in the midst of sentiment transitioning. In weather parlance, we have to go from a Category 3 hurricane approaching to a Category 5 devastation. When it's approaching, you think, "how bad can it really get?" But after it's hit, you just look around at the ruins. Is it worth the risk to take that chance? That's the question I'd be asking myself right now.
I do believe there are investments that will work while we make this transition and I'll feature one of them on Monday morning in my free EB Digest newsletter. If you're not already a subscriber, simply CLICK HERE and type in your name and email address. It's that simple. There's no credit card required and you may unsubscribe at any time.
Enjoy your weekend and happy trading!
Tom


