 Setting expectations is part of a strategy and this includes expectations for the number of signals we can expect in any given year. Signal frequency, of course, depends on your strategy and timeframe. Short-term mean-reversion strategies generate more signals than swing strategies and swing strategies generate more signals than long-term trend following. Today I would like to share my signal expectations based on a swing trading strategy.
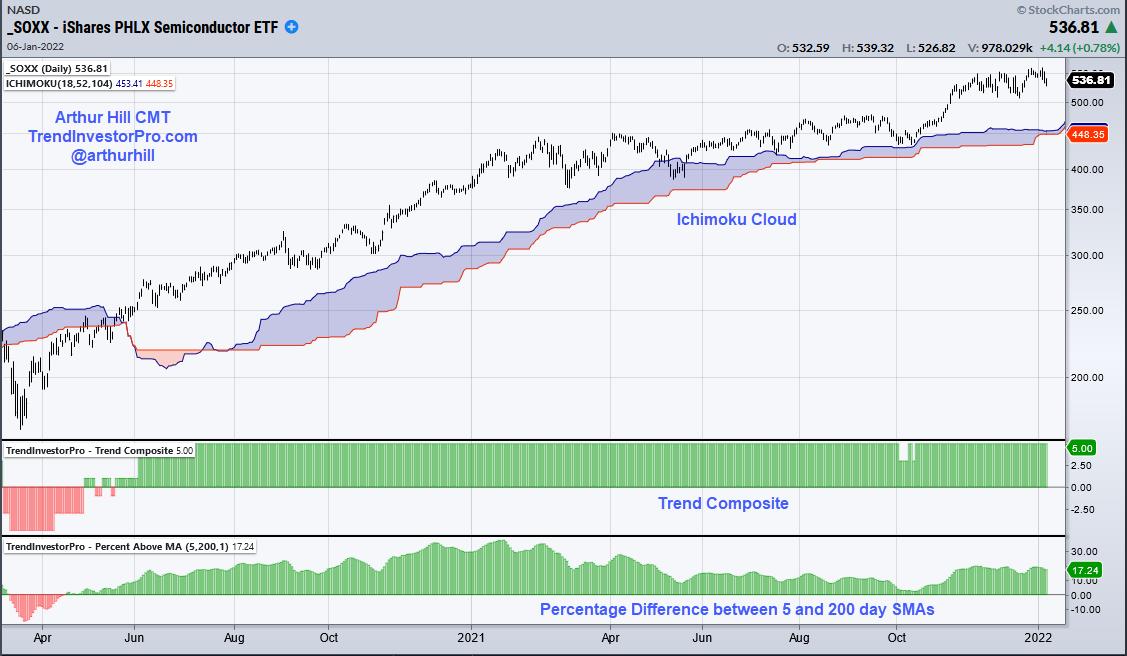
For swing trading, I am looking for tradable pullbacks within bigger uptrends. That's it. The first step is to choose an indicator to define the long-term uptrend. This could be the 5/200 day SMA cross, the Ichimoku Cloud (18,52,104) or the Trend Composite. Indicator selection and parameters are personal choices that should suit your strategy. Just make sure the signals are unambiguous. The trend is either up or down. The 5-day is either above the 200-day SMA or it isn't. Price is above the cloud or below the cloud. The Trend Composite is either positive (uptrend) or negative (downtrend). Of these three, my preference is for the Trend Composite because it aggregates trend signals in five trend-following indicators. You can learn more about this indicator and the TIP Indicator Edge Plugin here.
Using the Trend Composite as the first filter, I then look for pullbacks when the bigger trend is up. Downtrends are ignored because I am not interested in short positions. The first step is to have rules to identify a trading setup and I have two rules. First, I am looking for the Momentum Composite to hit -3 or lower, which signals a short-term oversold condition. Second, I am looking for a tradable pattern on the price chart (falling flag, wedge, triangle). The entry signal triggers when there is a short-term upside catalyst or breakout.
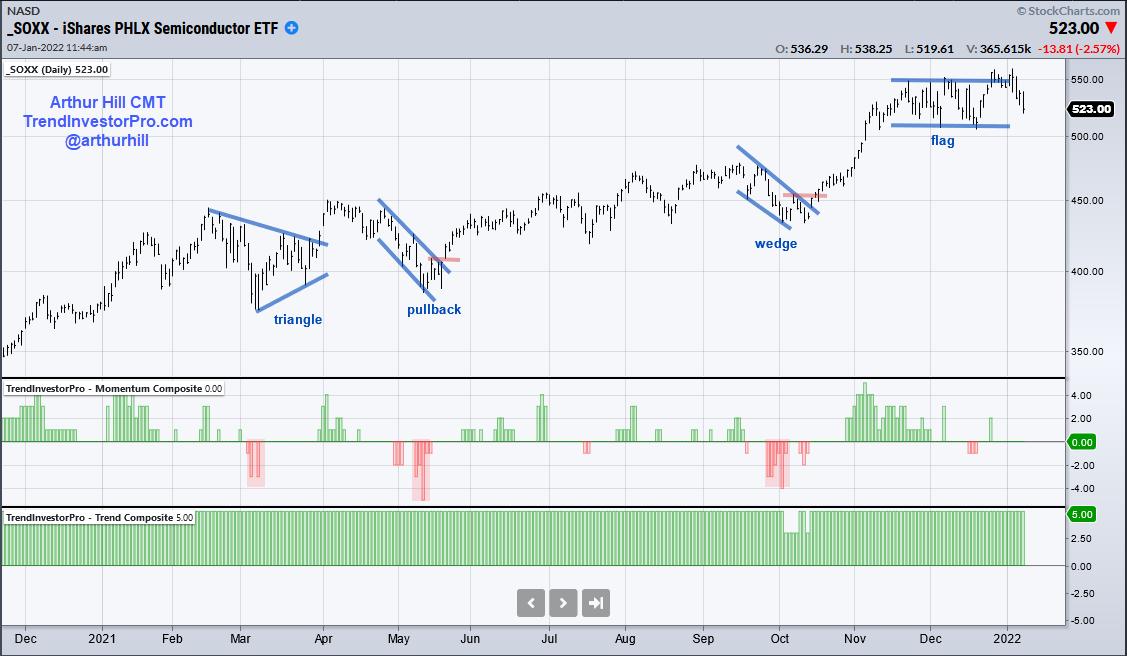
The chart above shows the Momentum Composite dipping to -3 or lower three times last year (red shading). Thus, there were only three setups in 12 months. A triangle formed in March and there was a breakout in April. This breakout did not hold and the trade failed. There was another oversold condition in May and a breakout that succeeded. There was then an oversold condition in October and a wedge breakout that succeeded. SOXX is currently forming a rather wide flag, but this setup does not meet my requirements because it did not become oversold first. Pass.
Three to four signals per year might seem limited, but there are over 100 ETFs in my core list covering most bases (stocks, bonds, commodities, currencies). This means there will be plenty of signals in any given year. In fact, we just had some setups and signals in energy-related ETFs. Trading is all about having a process that involves a definable and repeatable strategy. Check out TrendInvestorPro.com to see this process in action.
Thanks for tuning in and best wishes for 2022!
-----------------------------------------------------------
Choose a Strategy, Develop a Plan and Follow a Process
Arthur Hill, CMT
Chief Technical Strategist, TrendInvestorPro.com
Author, Define the Trend and Trade the Trend
Want to stay up to date with Arthur's latest market insights?
– Follow @ArthurHill on Twitter


