Copper continues to be frustrating. While copper is in high demand, China is a big consumer of raw copper. It's a bit like viewing a mine site from a railway track. Can't see much, so is all we have is the price charts of the stocks to go on.
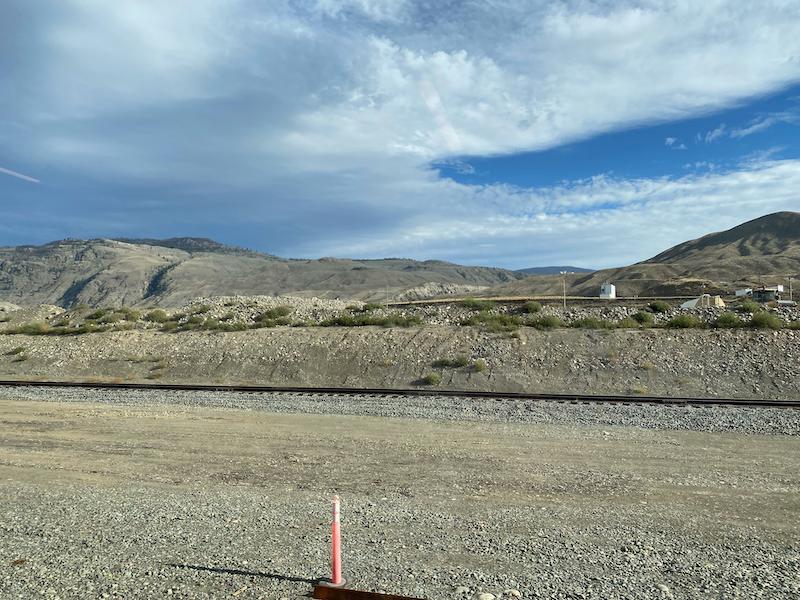 Highland Valley Copper Mine - British Columbia, Canada
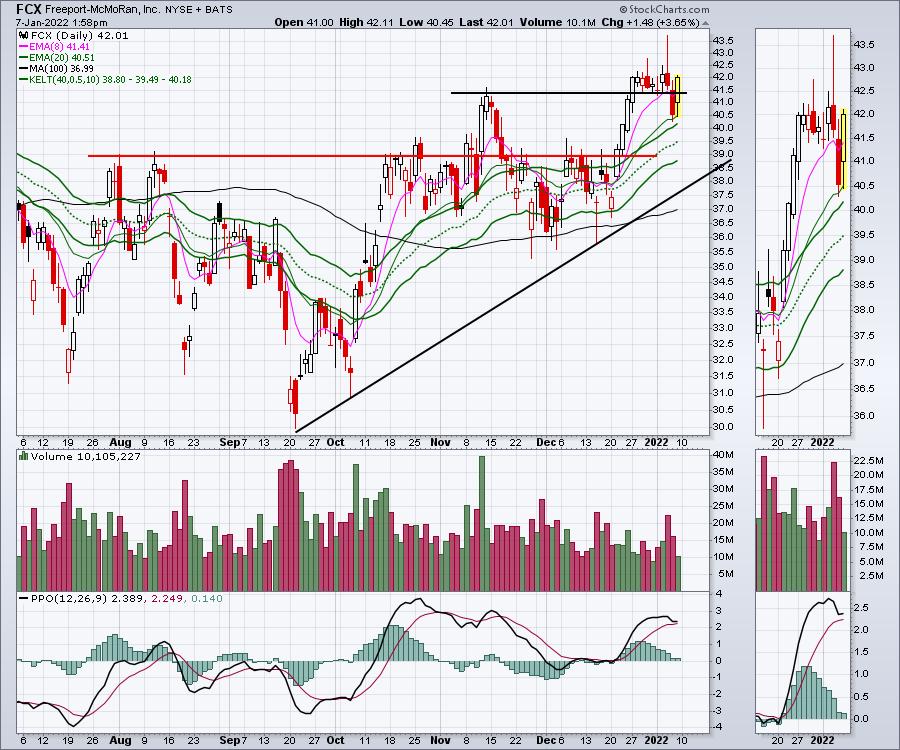
Looking in on FCX, the chart keeps trying to break out. Nobody said trading was easy! Just follow how hard this name has been to trade based on a breakout to a higher high.
The failed breakout in August above the red line was a good example, where it jumped up and immediately reversed. That also happened in the 3rd and 4th week of October. Then, in the second week of November, FCX makes a surge, retreats back below a breakout level, then another huge two-day surge and fails again. Late December, it goes on another run, only to fail to hold the breakout on the first Thursday in January after a church spire candle on the Fed minutes day. Friday it recovers the drop. Whew... tough trading if you are buying breakouts. The quick view is the chart made new highs already in 2022.
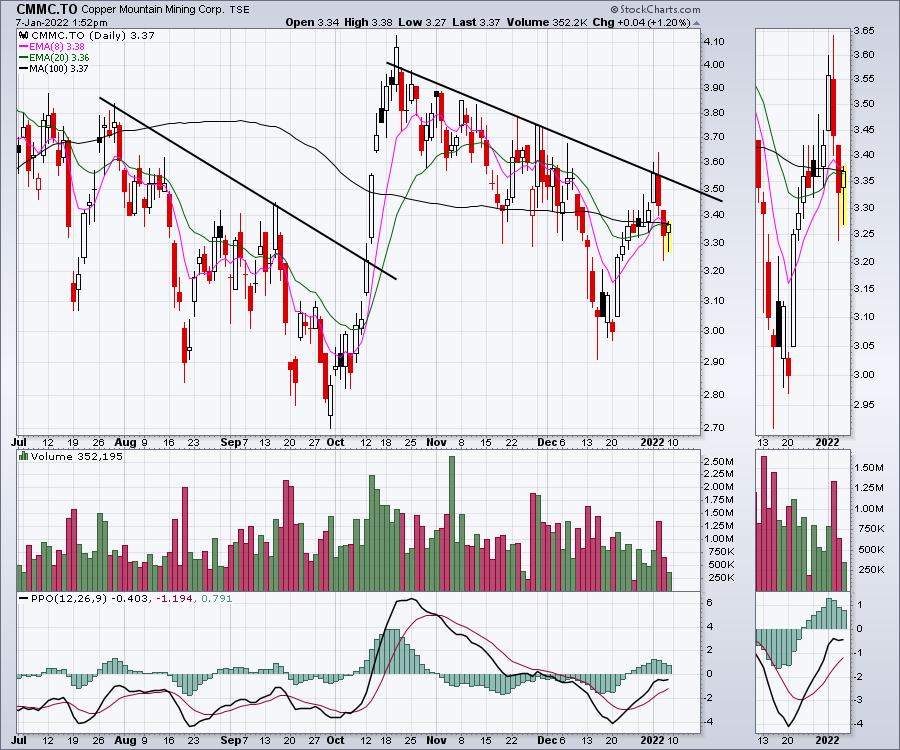
I tried a trade in Copper Mountain in Canada. It gave us a nice firm trend line to work off, but that didn't help. Trading these copper names is not for the weak of heart.
What makes this trade more compelling than ever is the closing down of nuclear plants in California and other places around the world. Many are of the belief that solar and wind can make that power up. Recently, an article I read suggested France had battery backup for less than 2 minutes of consumption at a grid level. So the majority of the entire grid infrastructure from production to storage will need to be completely upgraded.
All of this keeps building into part of the world's looming energy crisis. There is positive news, but the projects need to be vast in size and scale. On my travels today, I found two new grid level power installations of massive scale that were not there two years ago.
The new solar installation near the Hoover Dam in Nevada was vast. It covered massive acreage. The installation continued on both sides of the highway. The power line infrastructure above the solar array was part of the Hoover Dam power generation, so not all these towers were from the solar addition. I will comment on a scale of 1000 acres that have plants removed and call it green energy. Large scale sterilization of the soil or continuous elimination of the plant species? Either way, let's not pretend this is all eco-good.
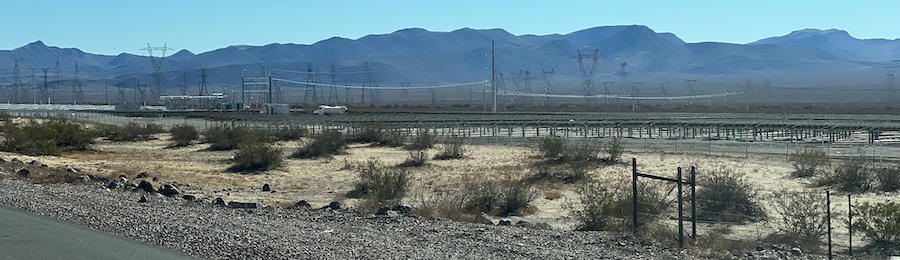
Here is another shot showing how far the panels go. They extend all the way back to the mountain in the distance!
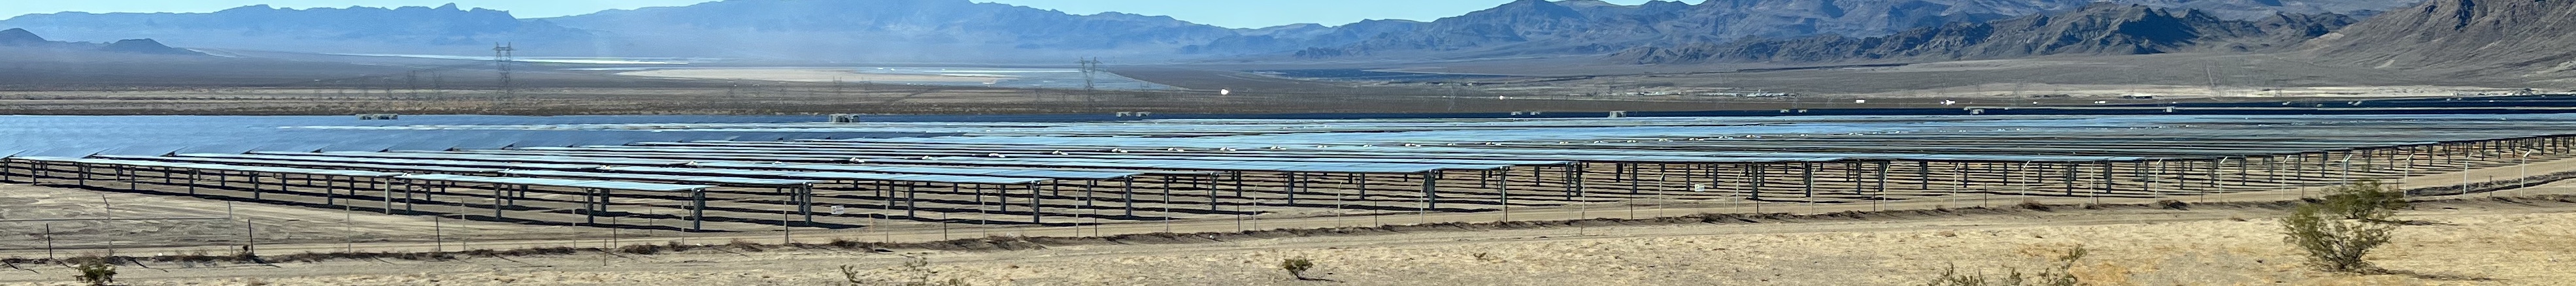
The point to make from these photos was the size and scale of the power generation and all of this requires massive land as well as large amounts of copper, steel and aluminum elements. This site also had a large battery storage facility on the east end of the property.
After crossing to the east side of the Hoover dam, I found a completely new wind farm that was not there two years ago. The picture doesn't do it justice. I took a picture of 75% of the windmills as it stretched farther left and right. All of this requires copper, aluminum, steel and concrete. This is also spread over multiple sections of land. Infrastructure roads are built into all these sites and power lines are constructed to tie into the existing grid. Once again, this one was close to the Hoover Dam, so I am guessing that it ties into the main transmission line network near there.
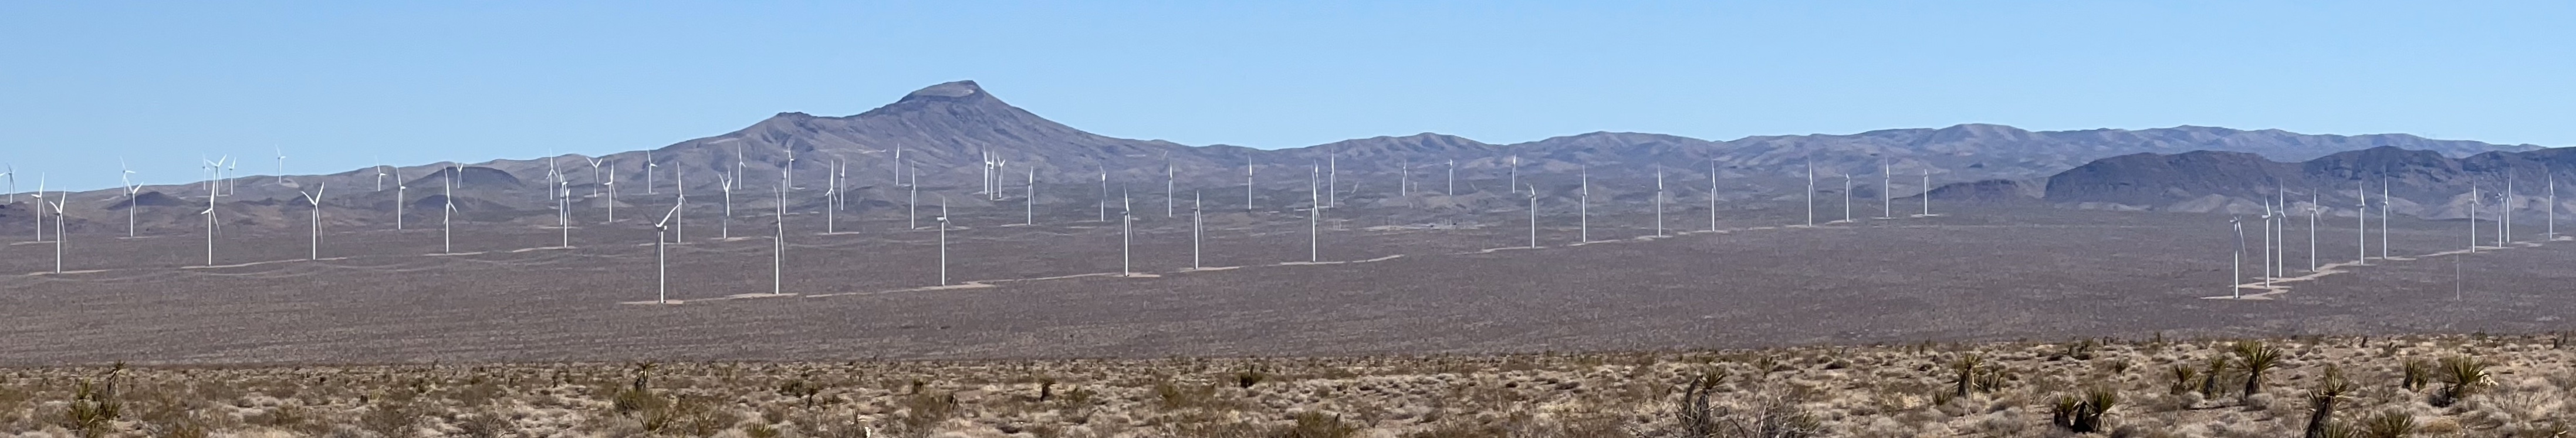
While desert landscaping isn't considered agricultural, this vast suction of land for two large infrastructure projects highlights how much new to industry construction is yet to come. Blessed with plenty of sunshine and lots of unowned tracts of land in the desert, I can see these desert valleys filling up with solar and wind infrastructure. I'll let someone else argue about whitewashing the land to build out this urbanized desert infrastructure, but it's hardly a greening of the landscape when everything is bulldozed.
If we are serious about power infrastructure, the speed and scale of this infrastructure installation needs to rise exponentially. When will the global demand for these elements exceed new supply? The copper chart is pushing into the top right corner at all time highs. I expect 2022 to be just the next wave of higher copper prices. That will rely on China also increasing their demand for copper.
This Copper chart pushing and holding near all-time highs suggests this might be the calm before the storm.
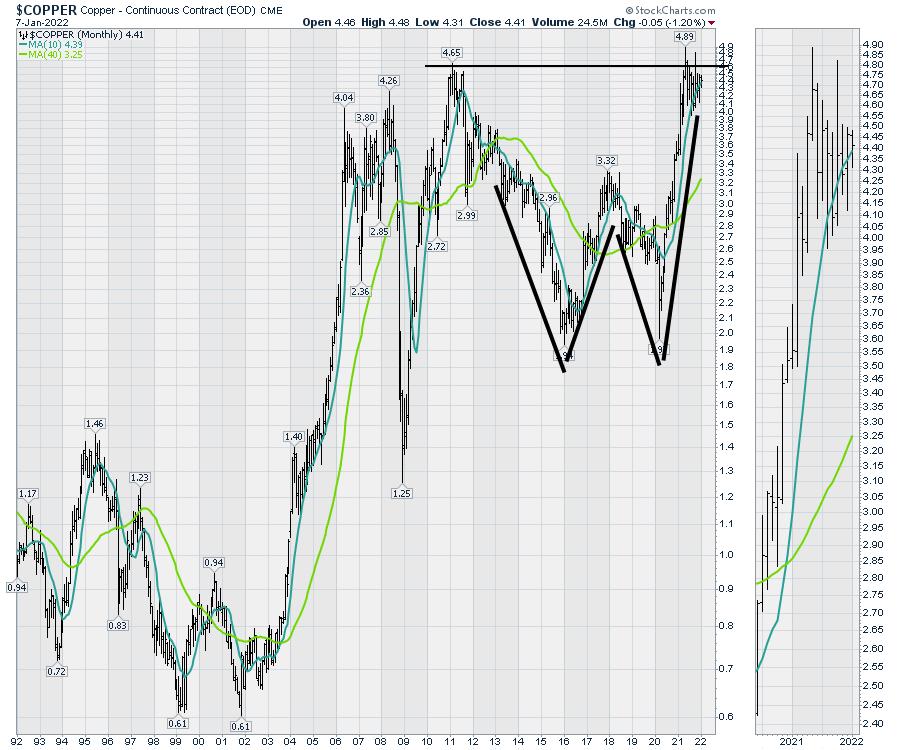
So for 2022, I am keeping my eye on the copper miners. As FCX continues to push up above previous highs, it seems only a matter of time before this explodes higher.
Good trading,
Greg Schnell, CMT, MFTA
Senior Technical Analyst, StockCharts.com
Author, Stock Charts For Dummies
Want to stay on top of the market's latest intermarket signals?
– Follow @SchnellInvestor on Twitter
– Connect with Greg on LinkedIn
– Subscribe to The Canadian Technician
– Email at info@gregschnell.com


