
Relative Rotation Graphs are mostly used to show exactly that -- the RELATIVE Rotation of securities against a benchmark and against each other. However, they offer many more possibilities.
One of the options is to change the benchmark to $ONE. That is essentially a straight line at value 1. This takes out the relative comparison to the benchmark, making the graph absolute price-based.
When you do this, you will notice that the nice even spread of the securities in a universe around the benchmark is now gone and, given the direction of the original benchmark, the majority of the securities will move in one direction, aligned with the move of the original benchmark.
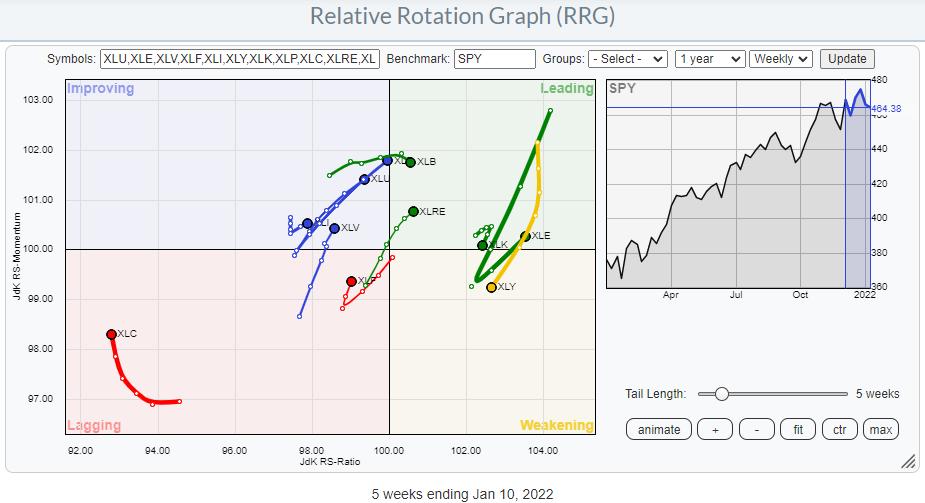
Let's start with the S&P sectors. The RRG below is the RRG as we use it most of the time, using weekly data.
The next RRG shows the same universe, but now using $ONE as the benchmark.
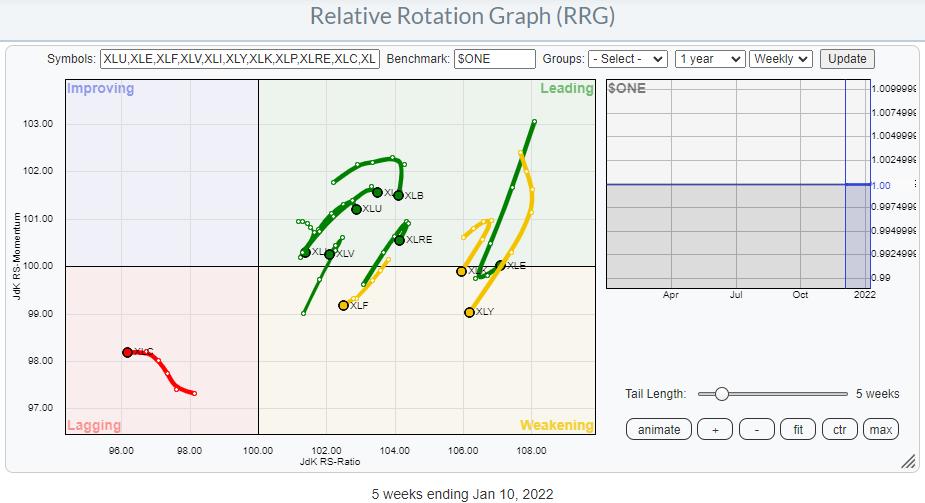
At first sight, the majority of the tails "just" seem shifted to the right. But when you look a bit closer, you will find that many tails have different shapes. XLC, for example, is pointing upward on the Relative RRG but heading due West on the $one version. The defensive sectors XLV, XLP, XLU are all at strong rotations on the relative graph, but they have started to roll over on the $one version.
The main takeaway, IMHO, from this comparison is that all sectors but XLC are still in uptrends, as they are positioned at the right-hand side of the plot. However, all of them are going through a correction, given the drop in (relative) momentum. Only XLE has sharply hooked back up.
Switching the time frame to daily makes this rotation much more pronounced, as seen in the RRG below.
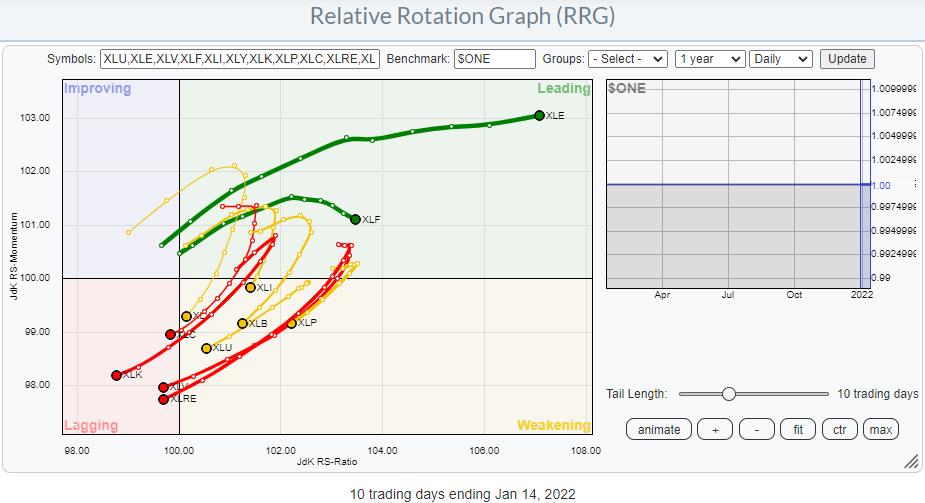
This approach clearly shows the weakness in all sectors, with the exception of XLE and XLF, over the last two weeks. Thinking in terms of market breadth this means that the majority of sectors are moving down and, thus, dragging the market lower on broad participation.
In the next step, I am going to do the same for the stocks in each sector and show all these RRGs side by side. Click on the image to enlarge it.
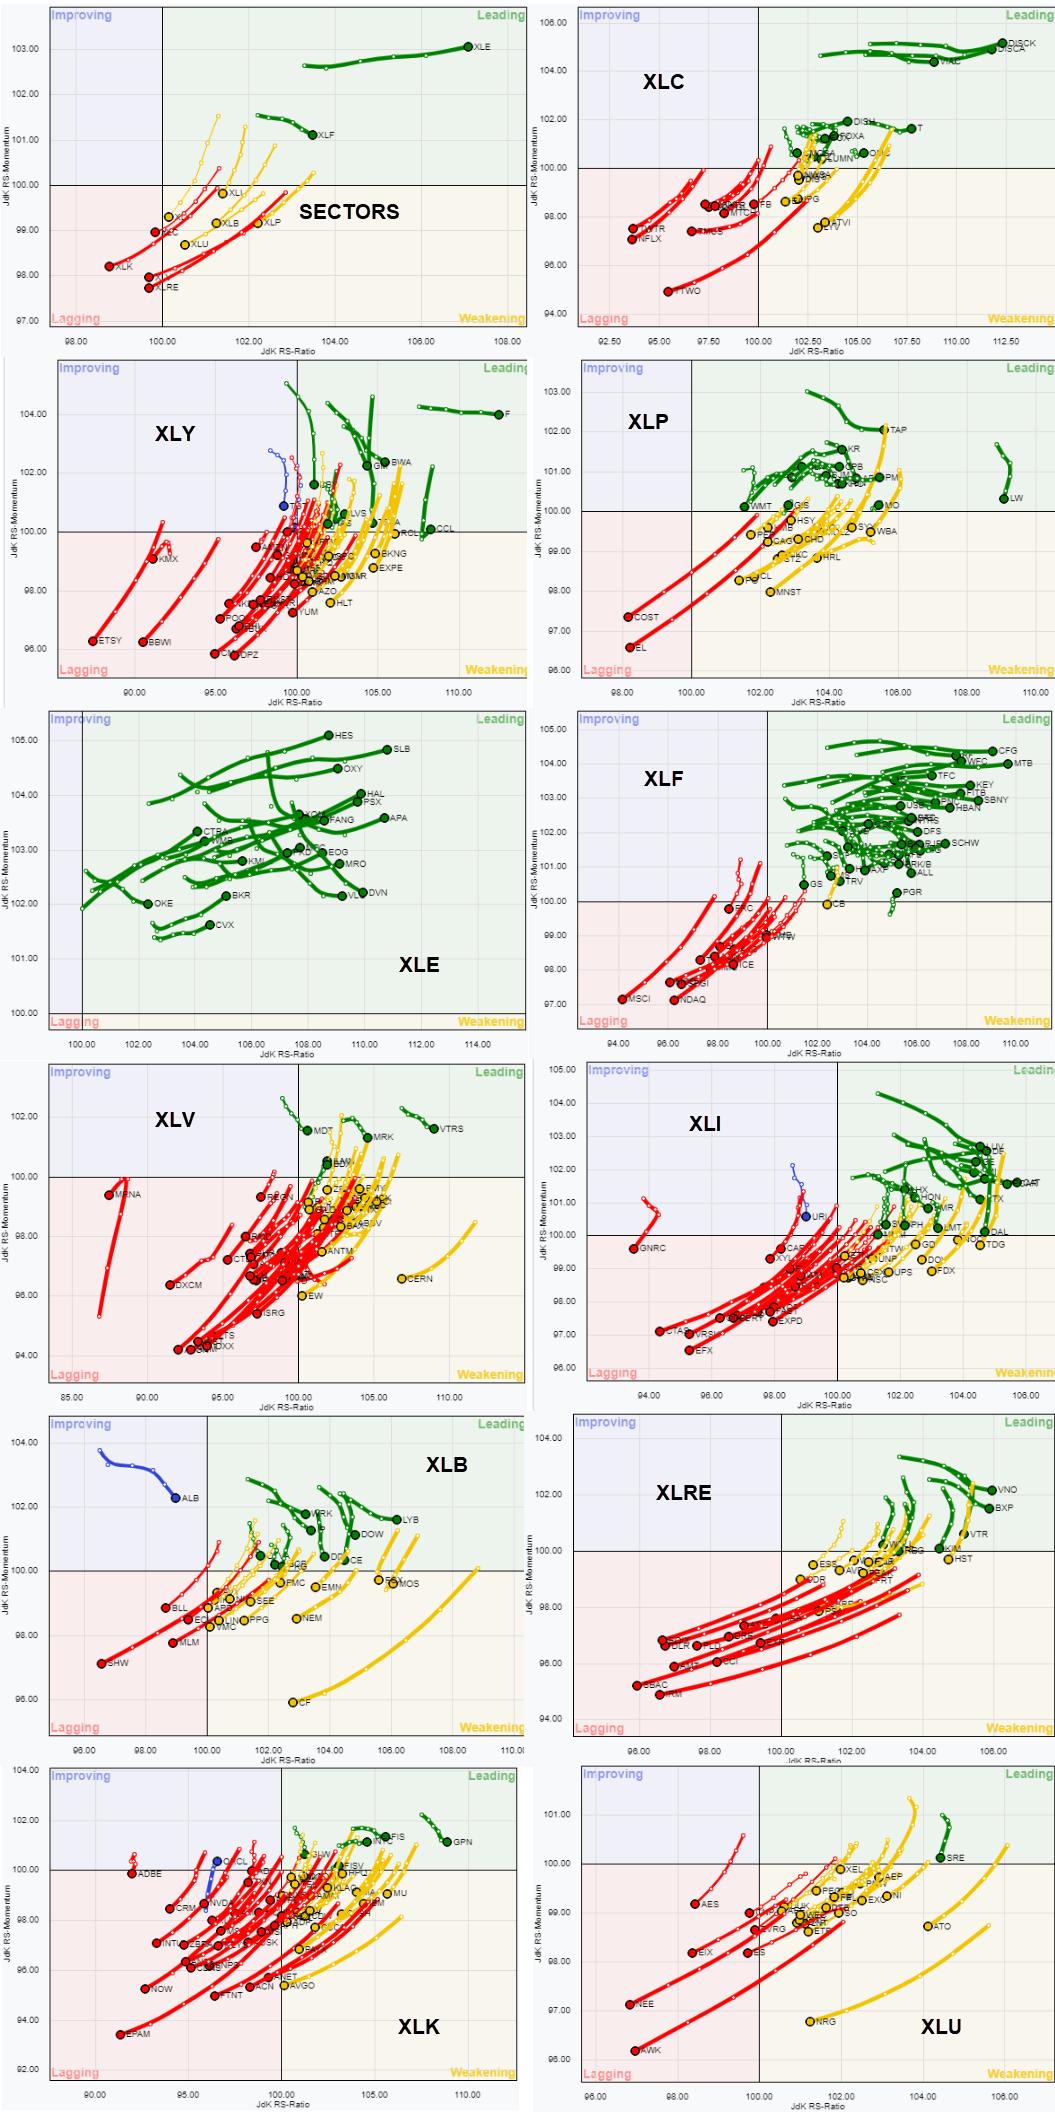
When you look at each sector, you can very quickly judge how broadly-based the rally or, in most cases now, the decline is.
A few that stand out are Energy (XLE), with all tails inside the leading quadrant and moving higher on the RS-Ratio scale. Financials (XLF) has the majority inside leading, but there is a clear distinction between the stocks inside leading and a cluster that is inside lagging and moving opposite the ones in leading. A few good pair-trading ideas can probably be found in that sector.
Clear negative rotations are seen in XLU, XLK, XLRE, XLV, XLI, XLY. But a more mixed pattern is visible on XLC, XLP, XLB.
I hope this gives you a bit of insight into what you can do with RRGs beyond the basics and maybe experiment for yourself.
Have a great weekend and #StaySafe, --Julius
My regular blog is the RRG Charts blog. If you would like to receive a notification when a new article is published there, "Subscribe" with your email address.
Julius de Kempenaer
Senior Technical Analyst, StockCharts.com
Creator, Relative Rotation Graphs
Founder, RRG Research
Host of: Sector Spotlight
Please find my handles for social media channels under the Bio below.
Feedback, comments or questions are welcome at Juliusdk@stockcharts.com. I cannot promise to respond to each and every message, but I will certainly read them and, where reasonably possible, use the feedback and comments or answer questions.
To discuss RRG with me on S.C.A.N., tag me using the handle Julius_RRG.
RRG, Relative Rotation Graphs, JdK RS-Ratio, and JdK RS-Momentum are registered trademarks of RRG Research.


