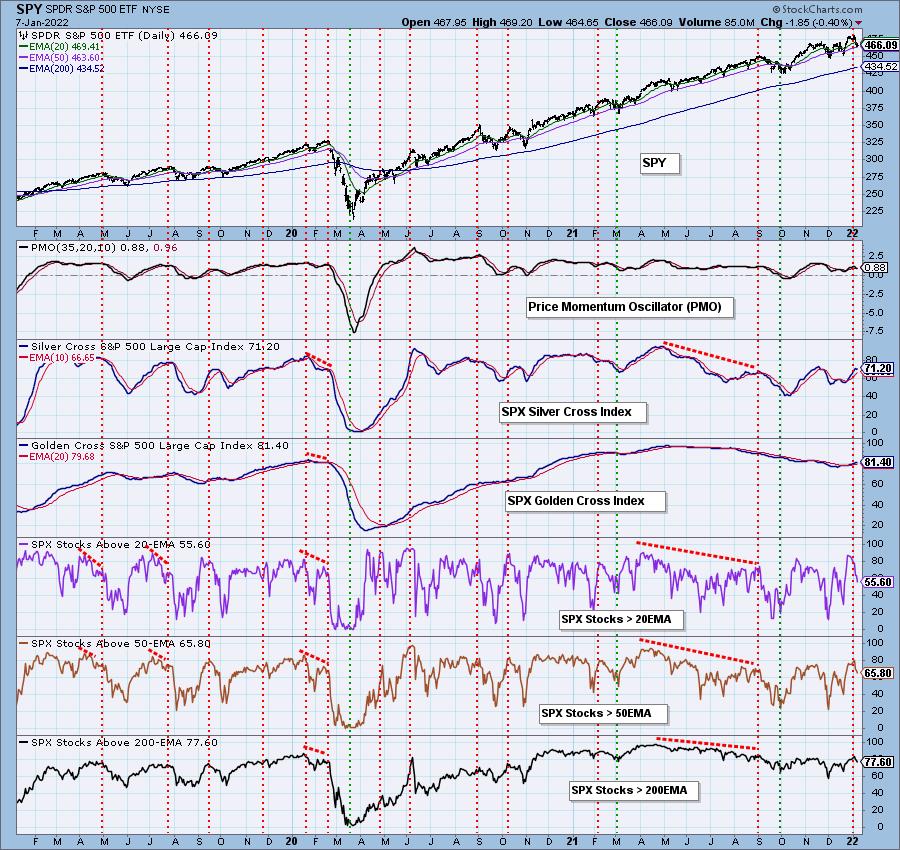
Included in our DP Alert daily report is a section on "Bias Assessment". We've found that, by analyzing the Golden/Silver Cross Indexes (GCI/SCI) along with Participation of Stocks > 20/50/200-day EMAs, we can determine the market bias in all three timeframes.
The GCI measures how many stocks within an index have "golden crosses", 50-day EMAs greater than the 200-day EMA. A stock with this configuration has a long-term bullish bias. The SCI measures how many stocks have a "silver cross", a 20-day EMA that is greater than the 50-day EMA. A stock with this configuration typically has a short-to-intermediate-term bullish bias.
In order to get a golden cross, a stock needs to have price above both the 50/200-day EMAs. Therefore, if we have a lower percentage of stocks below those EMAs, a bearish bias is developing. In order to get a silver cross, a stock needs to have price above both the 20-/50-day EMAs. Therefore, a lower percentage of stocks > 20/50-day EMAs suggests a short- and intermediate-term bearish bias developing.
Now that we know what we're looking for, let's look "under the hood" at four of the major indexes -- SPY, Nasdaq 100 (QQQ), NYSE and Dow 30. We will compare the participation percentages of stocks > 20/50/200-day EMAs to the GCI and SCI.
The SPY displays shows an SCI that is turning down at 71%. Note that %Stocks > 20/50-day EMAs are much lower at 56% and 66%. This means that we have a short- and intermediate-term bearish bias. Long term, the bias is bullish, moving toward neutral. The GCI is at a bullish 81% and is still rising, but we have fewer stocks > 200-day EMAs. This tells me that the prior bullish bias is deteriorating, but, given the high number of stocks with golden crosses, it isn't bearish yet.
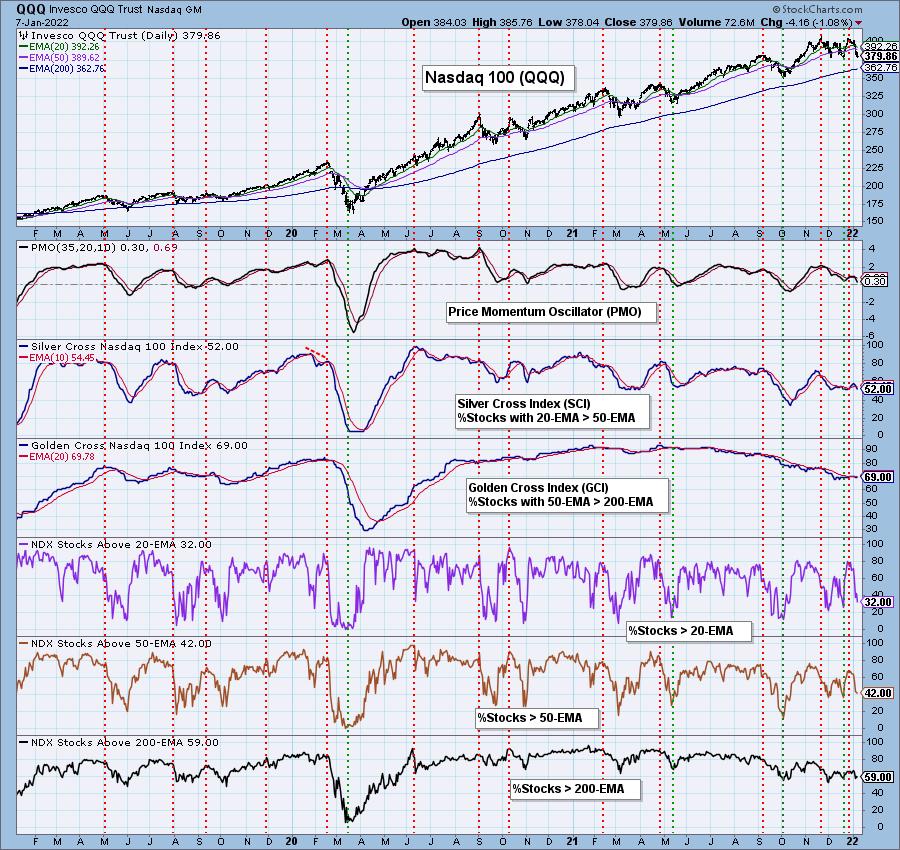
Participation is extremely weak within the QQQ and, unfortunately, those participation numbers are not oversold. They can get much worse. The SCI is at 52%, but stocks > 20/50-day EMAs is much lower, giving us a bearish bias in the short- and intermediate-terms. Long-term, there is also a bearish bias, given the GCI is reading below 70% and %Stocks > 200-day EMA is lower.

Click here to register in advance for the recurring free DecisionPoint Trading Room! The link to last Monday's trading room is below!
Free DP Trading Room (12/27) RECORDING LINK:
Topic: DecisionPoint Trading Room
Start Time: Jan 3, 2022 09:00 AM
Meeting Recording Link.
Access Passcode: January#3
For best results, copy and paste the access code to avoid typos.
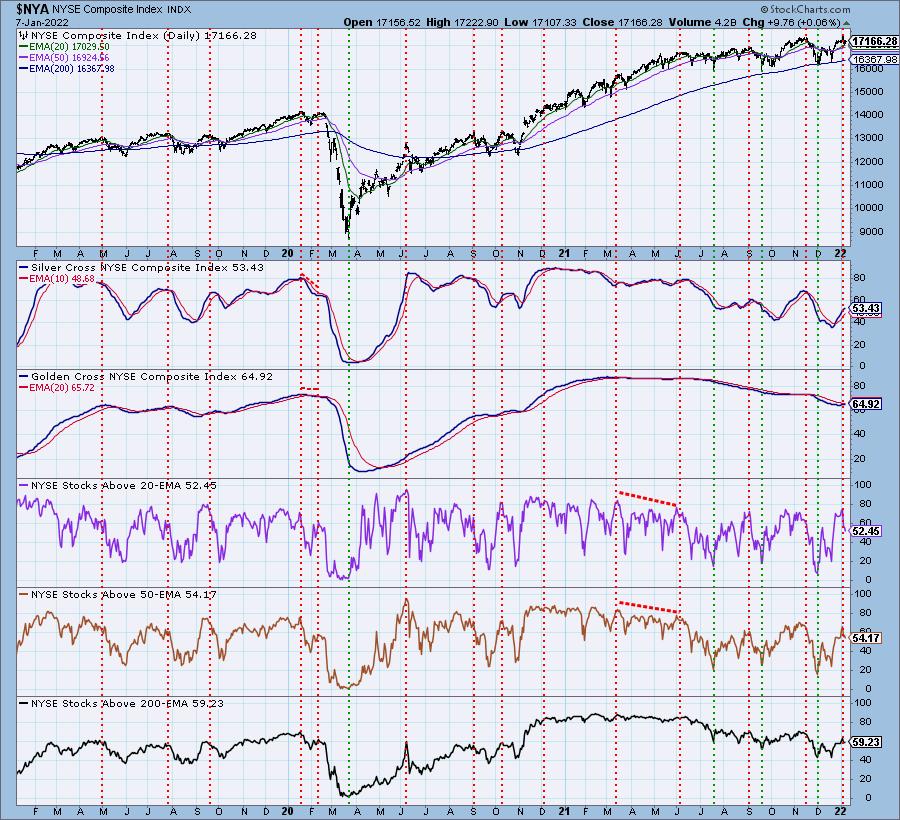
The NYSE has a bearish 53% reading on the SCI, but it is still rising. Given the percent stocks > 20/50-EMAs is about the same, but moving lower, we would read this as a neutral to bearish bias in the short and intermediate terms. The long-term bias is also bearish given the GCI is below 70% and there are fewer stocks > 200-day EMAs in comparison to the GCI.

The Dow 30 is still looking alright. The %Stocks > 20/50-day EMAs is higher than the SCI, giving us a somewhat bullish bias in the short and intermediate terms. Unfortunately those participation numbers are very overbought. The GCI is at a somewhat bullish 70%, but we know based on 83% having price above their 200-day EMA that we still have a bullish bias in the long term.
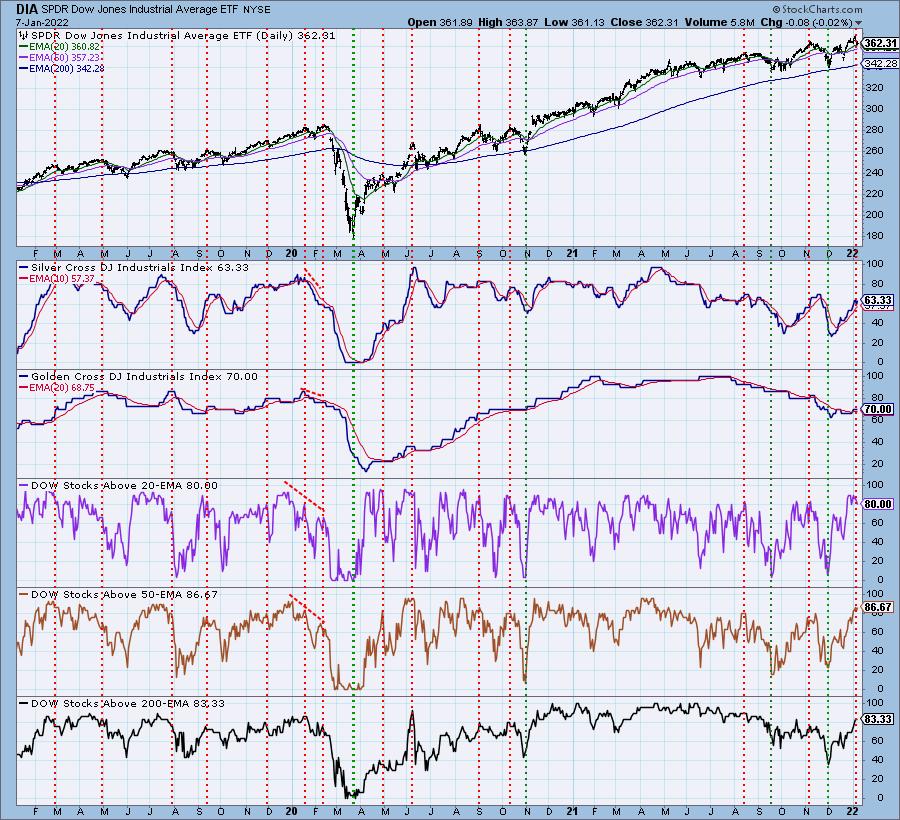
All of the charts above are available to our subscribers on our website along with similar charts for all of the sectors, other indexes and Gold Miners. Carl updates the annotations regularly so you can see what he sees.
Happy Charting!
Erin Swenlin, VP and Sr Technical Analyst - DecisionPoint.com
erin@decisionpoint.com
Technical Analysis is a windsock, not a crystal ball. --Carl Swenlin
(c) Copyright 2022 DecisionPoint.com
Helpful DecisionPoint Links:
Price Momentum Oscillator (PMO)
Swenlin Trading Oscillators (STO-B and STO-V)
DecisionPoint is not a registered investment advisor. Investment and trading decisions are solely your responsibility. DecisionPoint newsletters, blogs or website materials should NOT be interpreted as a recommendation or solicitation to buy or sell any security or to take any specific action.


