A common question I am receiving via email and the Monday free DecisionPoint Trading Rooms (register here to be a part and/or receive the recordings): "How will we know it is safe to expand exposure or when seas aren't so stormy?" In this week's DecisionPoint show, Carl and I discussed the signs we are going to be looking for. The title of the video was "This Indicator Called the 2020 Bear Market Low". In this article, I will show you that indicator!

What is this magical indicator? It's the New Highs/New Lows indicator.
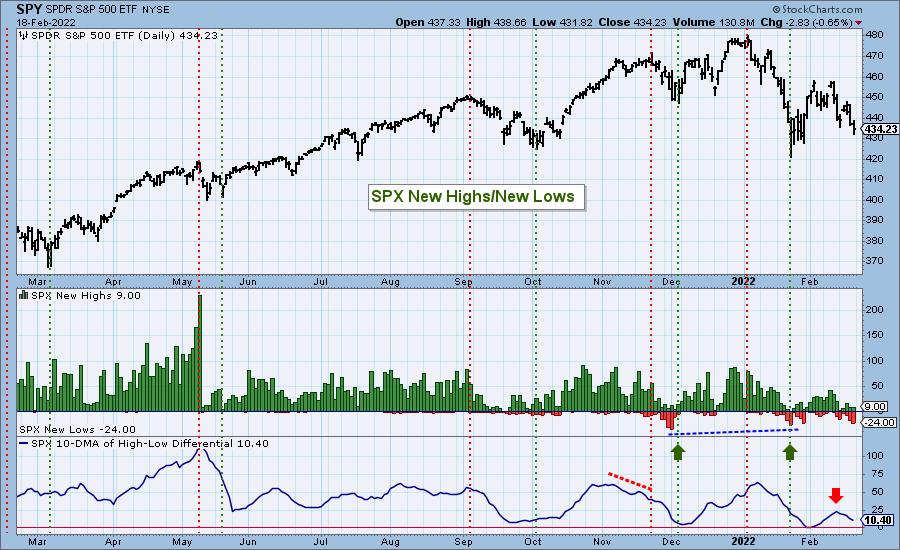
Below is the latest NH/NL chart. Notice the positive divergence we had with New Lows contracting over time and price lows going lower. We were very encouraged by this chart in the short term. But (there's always a "but")...
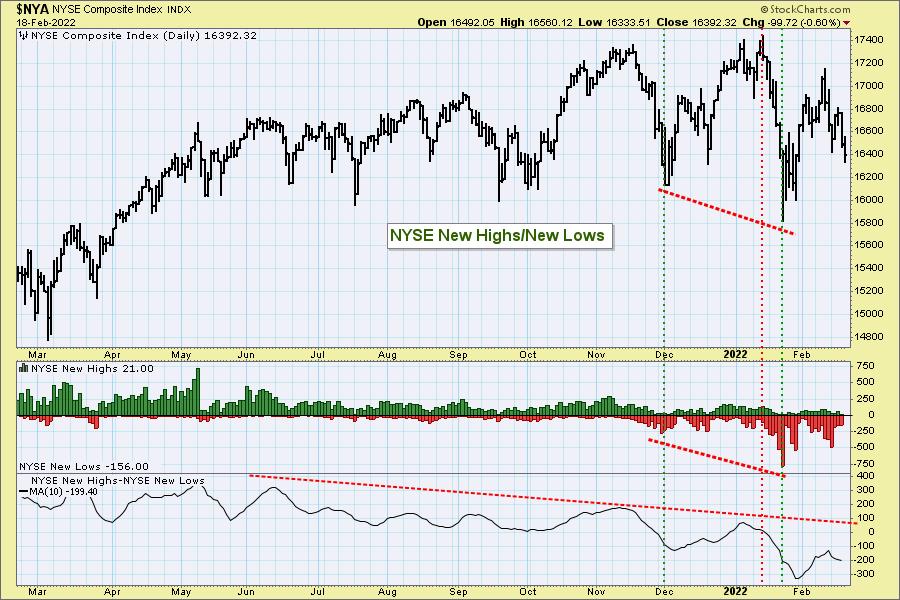
The NYSE New Highs/New Lows chart did not confirm with its own positive divergence. In fact, it was clearly confirming that this isn't over yet.
But wait! There's more!

Click here to register in advance for the recurring free DecisionPoint Trading Room! Recordings are available!
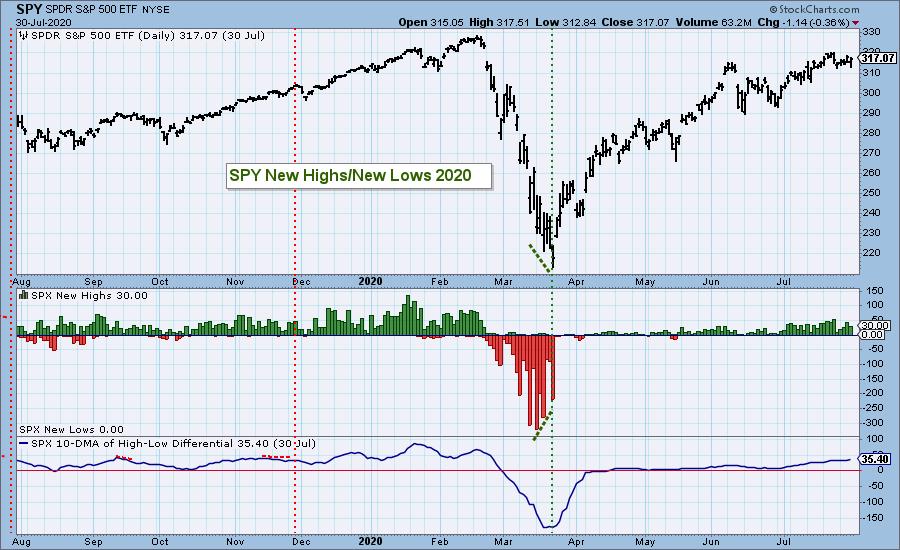
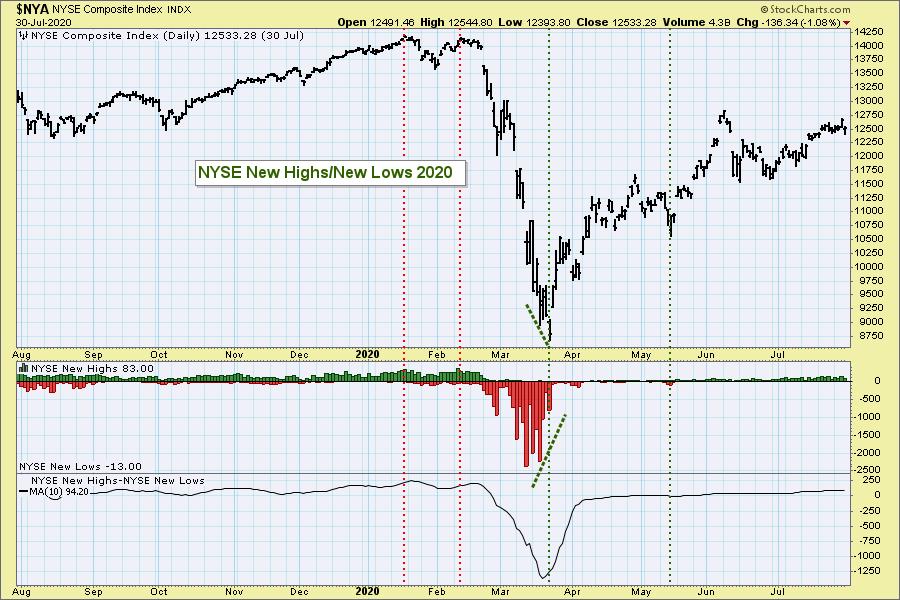
Look at these same charts at the end of the 2020 Bear Market. We steeply lower price bottoms, yet New Lows were contracting anyway. Boom! It was the end of the bear market.
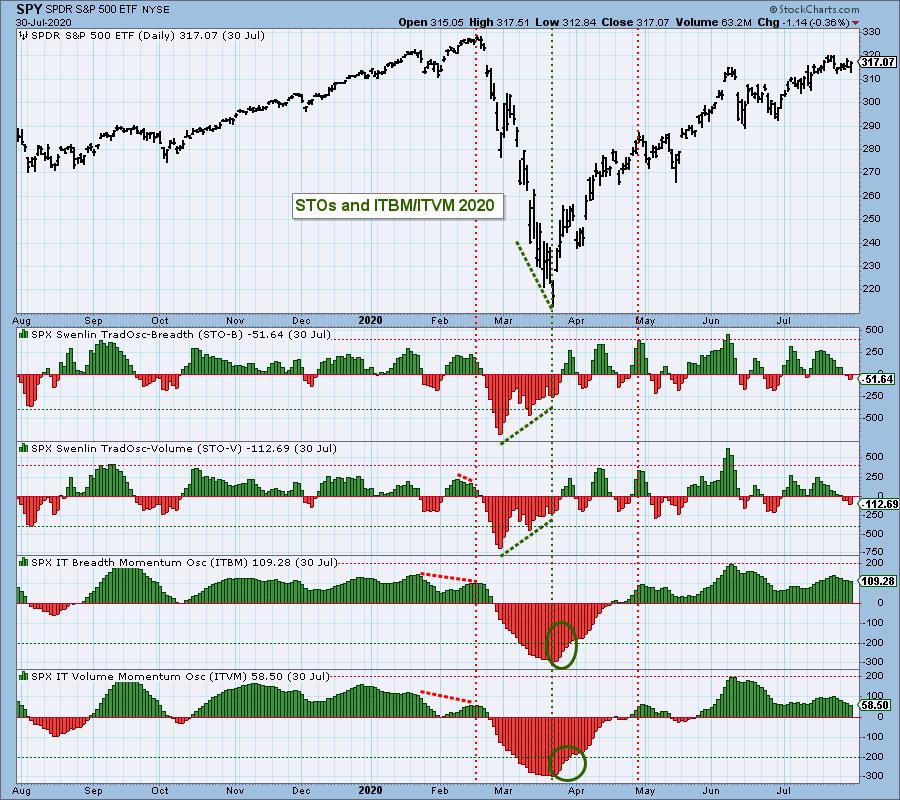
We're not done yet. Below, I have our primary short-term and intermediate-term indicators, the Swenlin Trading Oscillators (STOs) and ITBM/ITVM. The shorter-term STOs started confirming a possible bottom arriving, but it was actually confirmed by the retreat of the ITBM/ITVM.
Carl and I are of the opinion we are in a bear market. It may not be "official" with a 20% decline, but why wait to play defense? These indicators called the end of bear market conditions last time. There is no guarantee they will this time, but at least we know what we are looking for. DP Alert subscribers will be the FIRST to know when the conditions are ripening and it is safe to dip our toes back in.
Good Luck & Good Trading!
Erin Swenlin
Technical Analysis is a windsock, not a crystal ball. --Carl Swenlin
(c) Copyright 2022 DecisionPoint.com
Helpful DecisionPoint Links:
DecisionPoint Alert Chart List
DecisionPoint Golden Cross/Silver Cross Index Chart List
DecisionPoint Sector Chart List
Price Momentum Oscillator (PMO)
Swenlin Trading Oscillators (STO-B and STO-V)
DecisionPoint is not a registered investment advisor. Investment and trading decisions are solely your responsibility. DecisionPoint newsletters, blogs or website materials should NOT be interpreted as a recommendation or solicitation to buy or sell any security or to take any specific action.


