The chip leaders of 2021 are at risk of losing their throne to another group. And when we measure up the double AA battery versus a fossil fuel giant, it's surprising to see who is winning in the performance race. Who could have imagined?
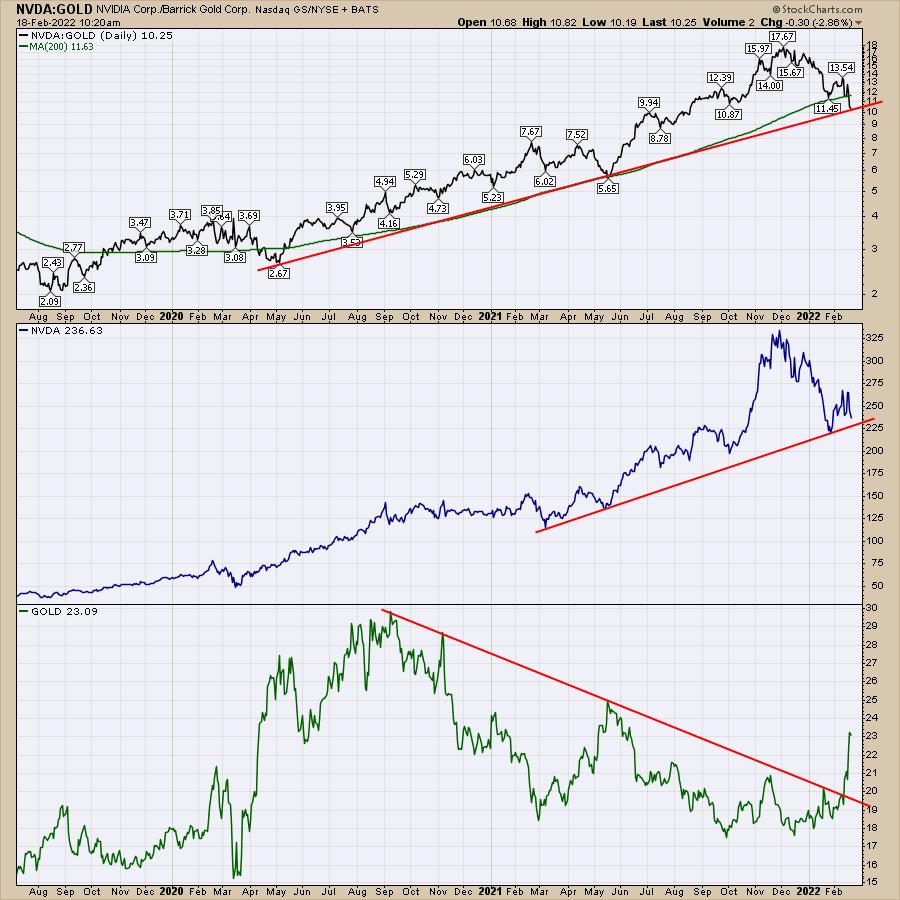
The first chart compares the big gun, Nvidia (NVDA), to Barrick Gold (GOLD). After the earnings for both on February 15th, the two charts are diverging meaningfully. The ratio chart on the top panel is on the two-year trend line. Who would have thought this would be even close? It is still an uptrend in favour of NVDA, but, as we'll see below, that can change.
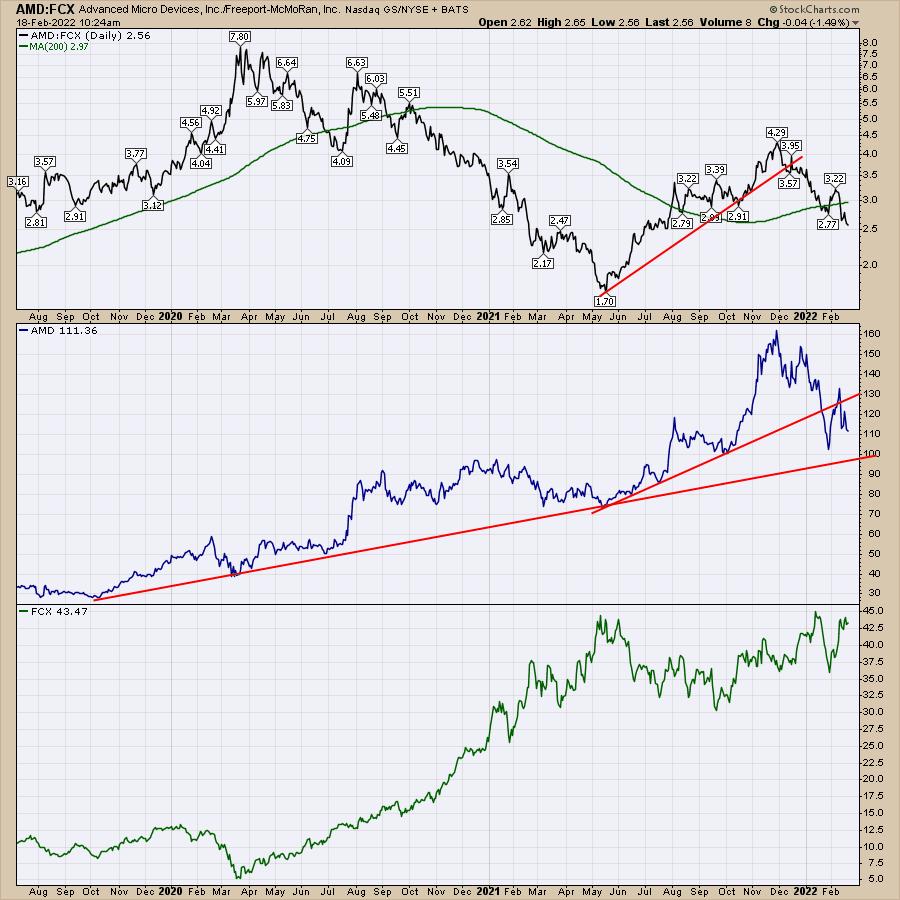
The second chip leader is Advanced Micro Devices (AMD) and I have paired it up with a copper stock -- Freeport McMoRan (FCX). Working through the panels, the ratio is clearly showing AMD underperforming Freeport for almost two years. The ratio high was in 2020 at the COVID lows. AMD recently topped in December, but Freeport continues to power higher. Freeport looks ready to break out to new highs, where AMD broke the 10-month uptrend and now looks like it will test the three year uptrend.
Lastly, we have the golden child, Tesla (TSLA), against the fossil fuel relic, ConocoPhillips (COP). As the ratio shows, they have been somewhat similar for almost two years, but the ratio is starting to break lower. The ratio has a lower high on it like the AMD/FCX ratio, but you could have done equally well since Sept. 2020.

While technology lovers will always love technology, these ratio charts are pointing out some significant changes in the heartbeat of the market. For more information, you can head over to our new website at OspreyStrategic.org to monitor these changes more closely. With the launch of the website, I have a new trial offering at $7 for the first month. Each weekly video and the accompanying newsletter discusses where the opportunities are in the market and when to protect capital. I hope you find it very interesting.
Good trading,
Greg Schnell, CMT, MFTA
Senior Technical Analyst, StockCharts.com
Author, Stock Charts For Dummies
Want to stay on top of the market's latest intermarket signals?
– Follow @SchnellInvestor on Twitter
– Connect with Greg on LinkedIn
– Subscribe to The Canadian Technician
– Email at info@gregschnell.com


