The 200-day SMA is quite the battle zone when it comes to the S&P 500. In fact, the index has crossed this key moving average 165 times since 2000. That's a lot of crosses, and a lot of needless whipsaws. Chartists can reduce whipsaws and improve performance by applying a simple filter to qualify signals. Let's investigate.
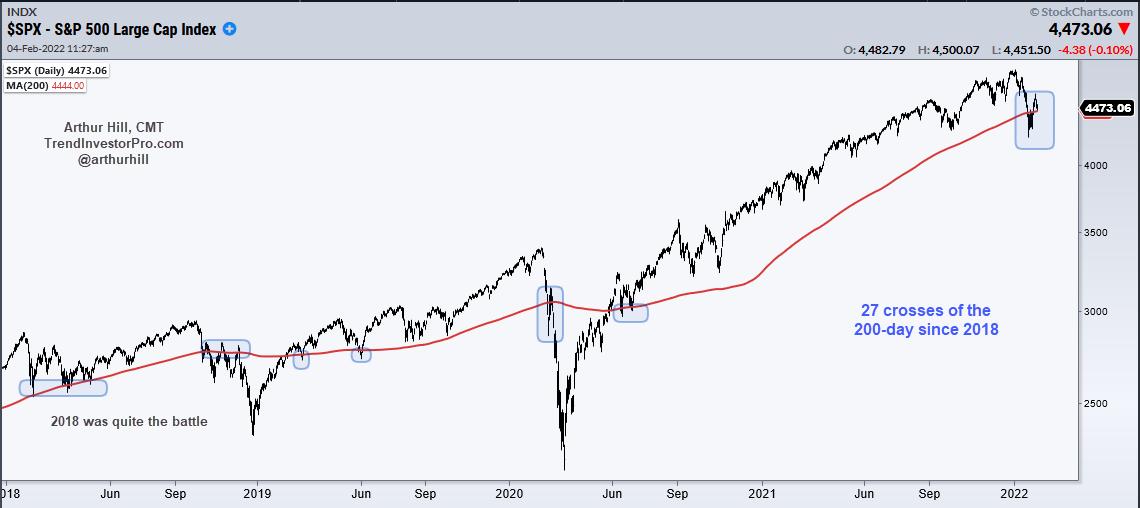
The chart above shows the S&P 500 with the 200-day SMA in red. The blue shadings show when price crosses the 200-day SMA. As we can see, there were several dips below the 200-day in the first half of 2018, but the index ultimately held. SPX plunged below the 200-day in the fall of 2018 and then returned to do battle with several forays back above. These also failed to gain traction. Overall, there have been 27 crosses since 2018 alone.
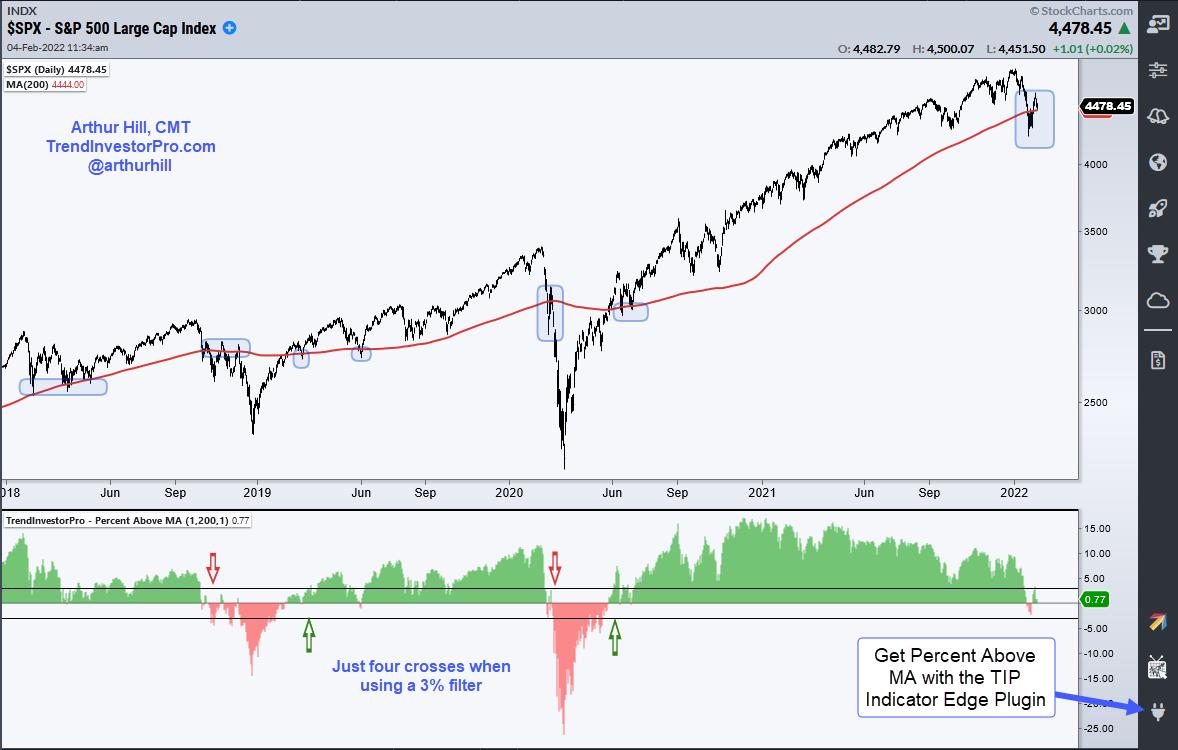
Chartists can seriously reduce these whipsaws by adding a percent filter to qualify the crosses. For example, turn bullish when the close is 3% or more above the 200-day SMA and bearish when the close is 3% or more below the 200-day SMA. Using this filter, the number of signals went from 27 to 4, which is much more manageable. The indicator in the chart below shows Percent Above MA (1,200,1), which shows the percentage difference between the close and the 200-day. The horizontal lines are set at +3% and -3%.
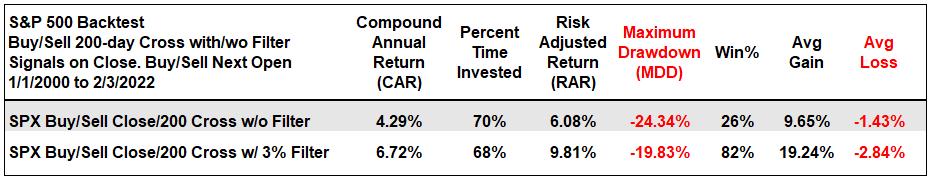
Adding this 3% filter not only reduces whipsaws, but it also increases overall performance. The table below shows a higher Compound Annual Return (4.3% vs 6.73%), a better Maximum Drawdown (24.34% vs 19.83%) and a much higher Win% (82% vs 26%). The 200-day is a big battle zone and we should not take a cross seriously until it clears the 3% threshold. This indicator and technique can be applied to any price series.
Percent Above MA is one of 11 indicators in the TrendInvestorPro Indicator Edge Plugin for StockCharts ACP. The Trend Composite, Momentum Composite and ATR Trailing Stop are also included. Click here to learn more.
This week at TrendInvestorPro we unveiled a table to track Trend Composite signals and rank more than 250 ETFs by their StochClose score. There are lots of downtrends out there right now, but we are seeing uptrends and leadership in commodities, banks, energy and some defensive groups. Click here to take your analysis to the next level.
-------------------------------------------------------------
Choose a Strategy, Develop a Plan and Follow a Process
Arthur Hill, CMT
Chief Technical Strategist, TrendInvestorPro.com
Author, Define the Trend and Trade the Trend
Want to stay up to date with Arthur's latest market insights?
– Follow @ArthurHill on Twitter
