Rallies and selloffs can be so crazy during volatile periods, and 2022 definitely qualifies as volatile. The Volatility Index ($VIX) has now been elevated and above 20 every single day since January 18th. That's roughly 9 weeks. It comes after a year in which the VIX has bottomed in the 14-16 range. The only time this century that we've seen the VIX rise off of lows beneath 15, before then trading for 9 continuous weeks or more above 20, was 2020, as the pandemic unfolded. In other words, all pandemics aside, this is new territory. There remains a TON of nervousness in the market, which is why we MUST stay on guard for the possibility of further downside action.
I remain fully convinced that we're in a secular bull market and any weakness that we see throughout 2022 will dissipate; we'll eventually return to new all-time highs later this year or in 2023. The timing of the all-time highs will be based off of whether the bottom is already in. If the February low sticks, then I think we could see a new high in 2022 after a period of consolidation. However, if we have another leg lower and we pierce that February low, then I wouldn't expect to see a full recovery to new highs until 2023.
Post-Pandemic Traders are at It Again
One big problem the stock market faces is that many new investors cannot believe the stock market could actually be in a bear market, cyclical or otherwise. Despite the nervousness displayed by the elevated VIX, traders are pouring right back into equity calls during this rally. In fact, the 5-day moving average of the equity-only put call ratio ($CPCE) has reached its lowest level of 2022, indicative of excessive bullishness. The 5-day moving average has reached a level where key tops have formed in the past:
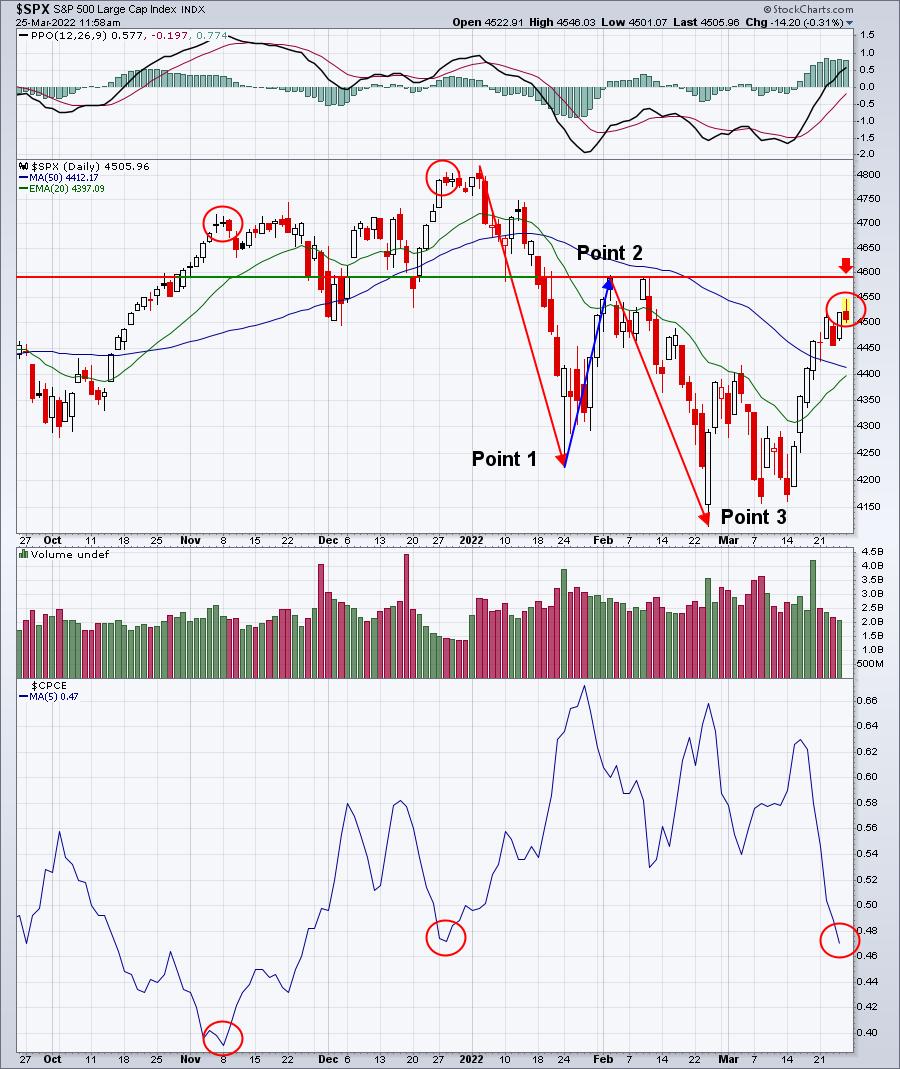
The red circles highlight the recent periods of bullishness in the options world. You can see the result each time as the S&P 500 generally tops. Will it matter this time? Probably, but we'll see. The other key point on this chart is the current 2022 downtrend. A downtrend is nothing more than a series of lower highs and lows. I've marked these above as Points 1, 2 and 3. The red arrow highlights the level that must be cleared to potentially reverse this downtrend by clearing Point 2. Until that happens, we must remain on alert for another potential leg lower in U.S. equities.
Beneath the Surface, Signals are Weakening
Listen, nothing provides us any guarantees. But Wall Street does send us messages from time to time, which will tell us a story if we're only willing to listen. I have a list of "sustainability ratios" that I like to watch to help guide me during rallies and declines. They appear in the panels below the QQQ price chart. While the more aggressive NASDAQ 100 (QQQ is the ETF that tracks this index) just keeps motoring higher, Wall Street is sending us a smoke signal. Check out this chart:
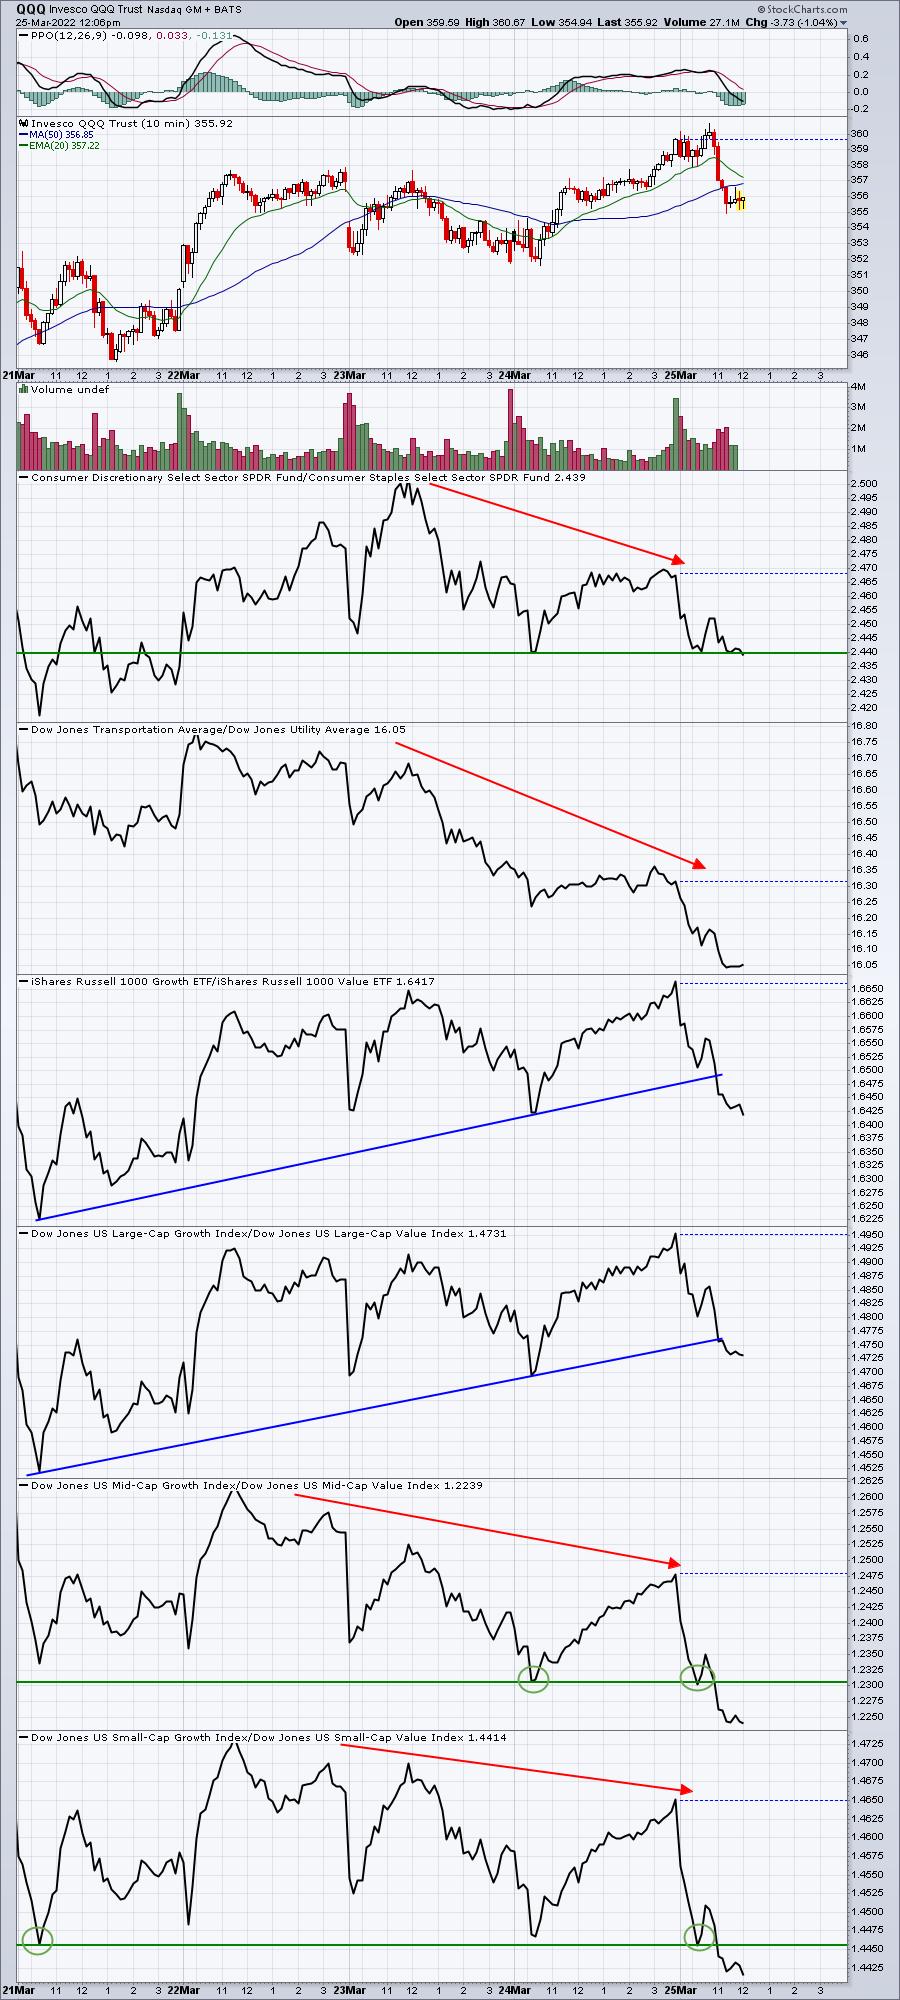
While the QQQ has been trending higher the past five days, several key ratios have put on the brakes and even shifted to reverse. Again, this isn't a guarantee that the market won't go higher, but it certainly lets us know that Wall Street's appetite for risk has changed. All I can say is that rallies don't tend to last if Wall Street isn't willing to continue taking risks.
The only real key area of remaining relative strength this week belongs to the large-cap growth names. They appear to have broken their relative uptrend line, but I wouldn't say they've completely broken down at this point.
If we do top today, or before the 4600 level on the S&P 500 is cleared, then I suspect we're going to see another rapid decline in the days ahead. How will that unfold? Well, that's what I plan to discuss in our free EB Digest newsletter on Monday. To register, simply provide your name and email address HERE. There is no credit card required and you may unsubscribe at any time. Also, we'll maintain your privacy as we do not provide email addresses to any third party.
Happy trading!
Tom


