The interest in Bitcoin or, more generally, cryptocurrencies comes and goes, and the moves are highly volatile from time to time. Nevertheless, this investment space is becoming more and more mainstream and, no matter what your personal opinion is, it is more and more a force to be reckoned with. Keeping an eye on the crypto space using Relative Rotation Graphs can easily be done.
Crypto as an Asset Class
With an increasing number of institutional investors allocating (small) parts of their portfolios to crypto investments, the case can definitely be made for Crypto as an asset class. When using a Relative Rotation Graph to plot the rotation for various asset classes, we can simply add $BTCUSD to the universe as a proxy for "crypto" investments.
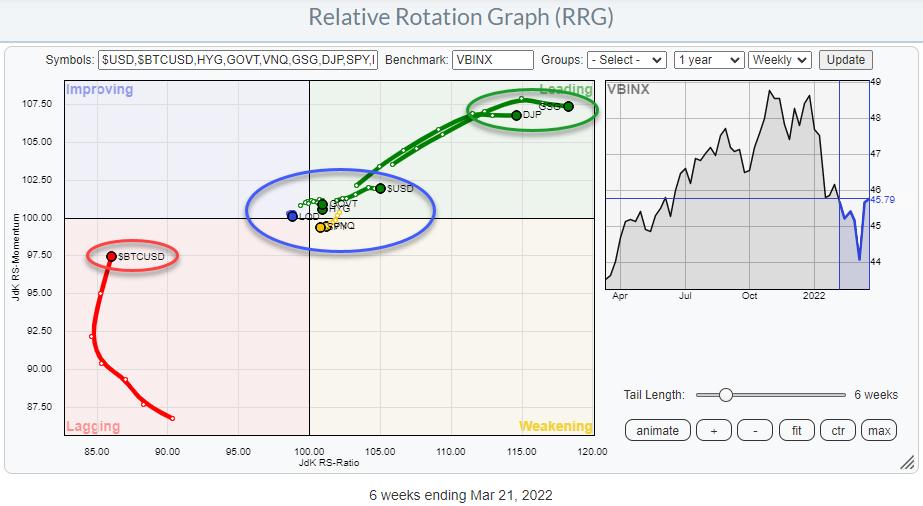
The Relative Rotation Graph above is the RRG I mostly use when looking at the rotations of asset classes. The benchmark here is VBINX, which is a 60-40 (stocks-bonds) balanced index fund.
This is a sol called "open universe", which means that the benchmark does not cover all the securities in the universe. This can cause wide rotations for certain securities which are not included in the benchmark, as there is no relation between the two.
On this RRG, you can clearly see the tails for both commodity ETFs far away inside the leading quadrant. Commodities are not included in VBINX. Additionally, the tail for Bitcoin, also not included in VBIN, is far to the left in the lagging quadrant.
Allocations to asset classes that are not included in your benchmark can offer good opportunities to outperform that benchmark, as they can move independently... BUT that can also cause a lot of pain when you have allocated money outside the benchmark and that allocation does not keep up with your benchmark. So risk management is very important in those cases. It's always important, but now even more so.
(Of course, you can argue whether BTC is the correct representation for allocations to crypto in general but I'll get to that later.)
Looking at the rotation of BTC over the last months, it is clear that it went through a rough patch vis-a-vis stocks, especially towards the end of 2021, when BTC dropped from a peak above $65k to a low near $35k at the beginning of 2022.
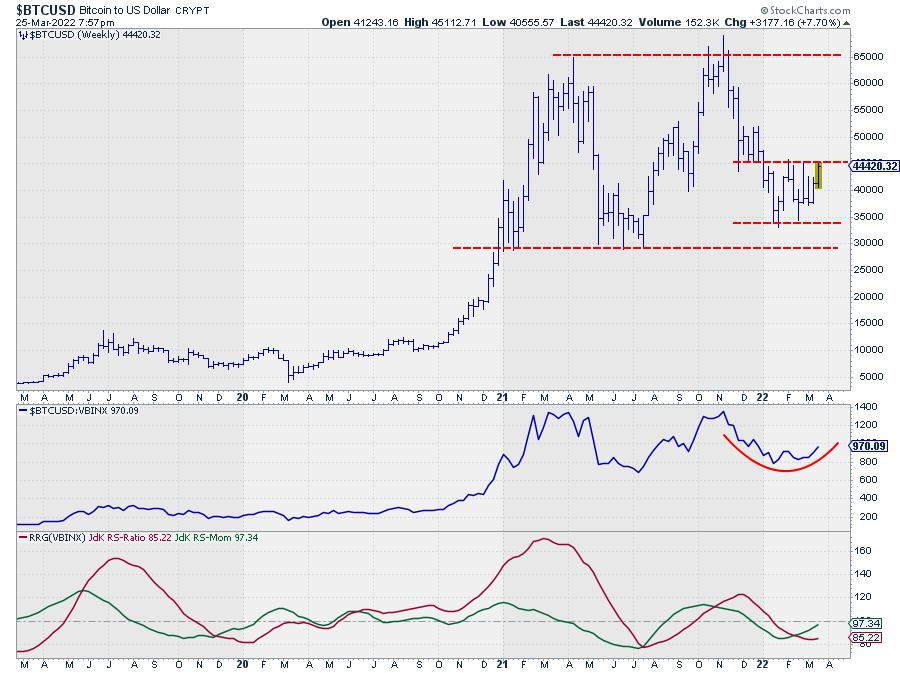
After reaching that low near $35k, BTC stabilized in a wide range between $35k-$45/46k. This stabilization is now causing the tail on the RRG to move up towards the improving quadrant. For the first time since October, the BTC tail has picked up a positive RRG-Heading (0-90) again.
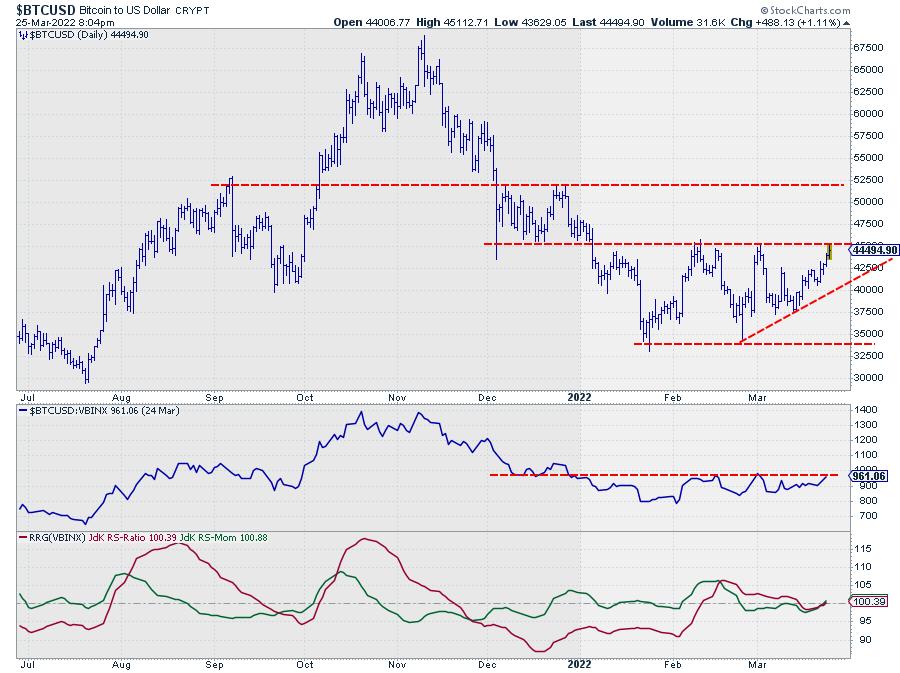
The daily chart above shows this range in a bit more detail, and also shows that the market is currently working on an attempt to break that upper boundary. No doubt that a break above roughly $46k will trigger more upside movement towards the next level near $52.5k, which will very likely also have a positive impact on its relative strength against VBINX.
Crypto is More Than Just BTC
With thousands of different coins available already, "crypto investments" are arguably more than just BTC. As BTC still is, and will probably remain for quite some time, the benchmark for crypto investments, I prefer to use $BTCUSD as the proxy for the entire asset class on the asset class RRG. However, in the next investment layer, it is very well possible to dive deeper into the crypto space to see if there are currencies/coins that are more or less interesting than BTC itself.
There is a pre-defined group of cryptocurrencies available on the RRG page, which holds a universe of widely-traded coins. One option is to plot this universe against the USD as the benchmark, but I prefer to use the second option and plot the universe of cryptos against BTC to see if any are showing especially strong or weak rotations vs. the mother of all cryptos.
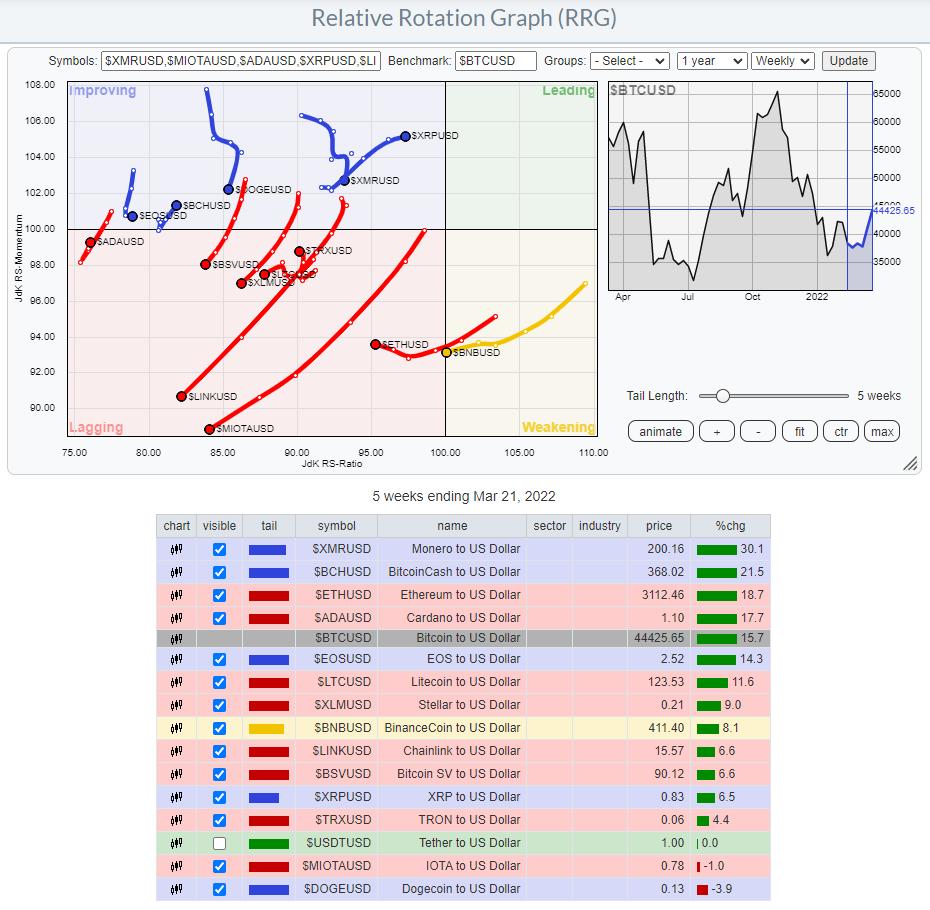
This weekly RRG does not show even one tail inside the leading quadrant, and the majority of tails are at a negative RRG-Heading vs. BTC. This is a pretty clear message saying that BTC is leading the way at the moment. And looking at the BTC chart, as discussed above, it will very likely be leading the way UP!
And this could be good news. In the past few "crypto waves" we have seen a repeating pattern where BTC would lead the initial charge which was then later followed by a new "alt season". On the weekly RRG, this is not very well visible yet. But when we switch the crypto RRG to daily, things change.
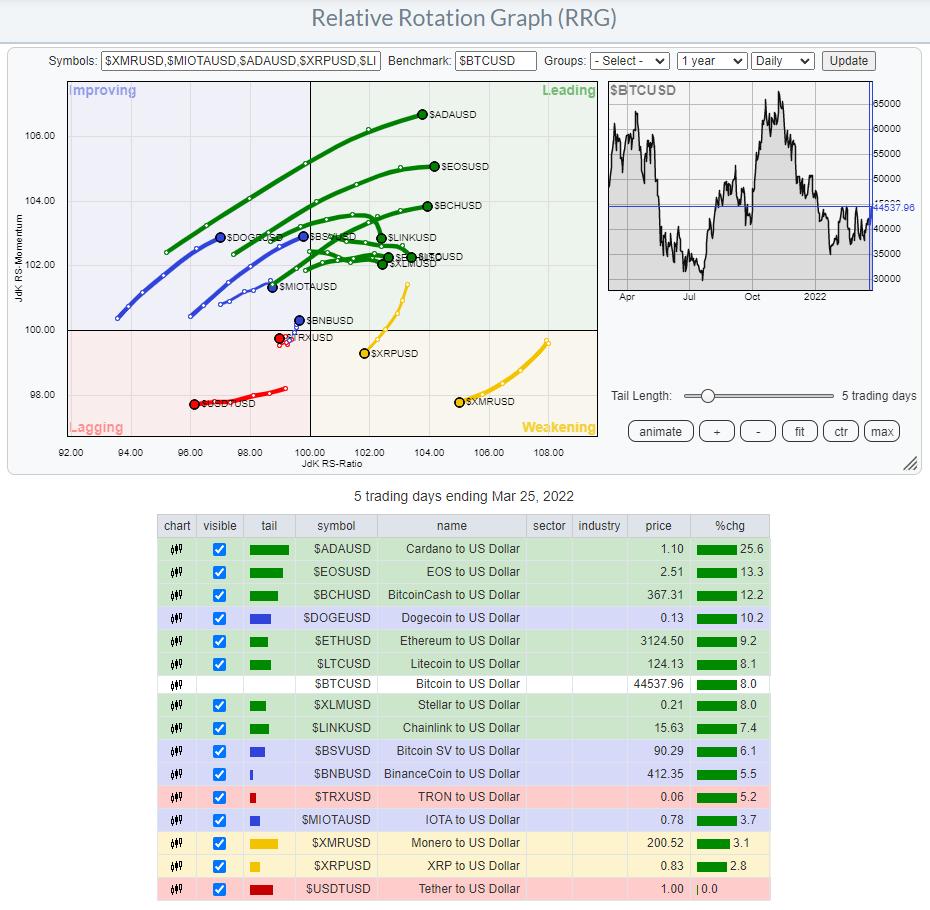
In this picture, the general direction for the tails of the alt-coins has changed to predominantly Northeast, suggesting relative uptrends and outperformance vs BTC.
Stay Mainstream or Go Alt...?
All in all, the crypto space seems to be coming to life again. Those who are not too adventurous can stick to straightforward BTC allocations (there are plenty of ways to create exposure nowadays) to benefit from the increasing strength. Those who are happy to dig a bit deeper and think/invest outside the crypto box will benefit from checking out a few of the coins with long green daily tails pushing further into the leading quadrant.
Have a great weekend and #StaySafe, --Julius
My regular blog is the RRG Charts blog. If you would like to receive a notification when a new article is published there, "Subscribe" with your email address.
Julius de Kempenaer
Senior Technical Analyst, StockCharts.com
Creator, Relative Rotation Graphs
Founder, RRG Research
Host of: Sector Spotlight
Please find my handles for social media channels under the Bio below.
Feedback, comments or questions are welcome at Juliusdk@stockcharts.com. I cannot promise to respond to each and every message, but I will certainly read them and, where reasonably possible, use the feedback and comments or answer questions.
To discuss RRG with me on S.C.A.N., tag me using the handle Julius_RRG.
RRG, Relative Rotation Graphs, JdK RS-Ratio, and JdK RS-Momentum are registered trademarks of RRG Research.
