It occurred to us, after we discussed the "Death Crosses" (50-day EMA dropping below the 200-day EMA) on the NDX and Nasdaq 100 in yesterday's subscriber-only DecisionPoint Alert, that we should investigate the actual damage done. The tech-heavy NDX and Nasdaq 100 are in bear markets, along with Technology (XLK).
We've been questioned about our discussion of the SPY being in a bear market because we don't have a 20+% decline yet. Well, if you go by that "official" 20% number, XLK, NDX and Nasdaq are all in "official" bear markets. Let's look at all three.
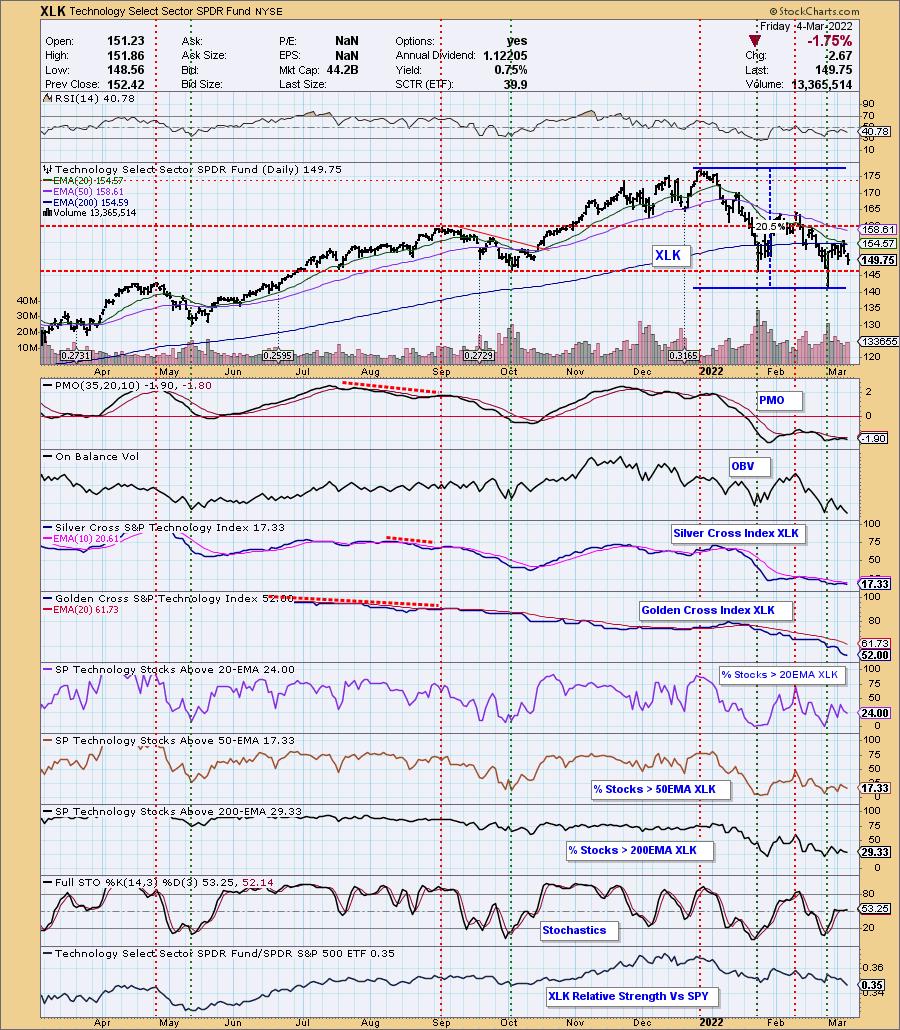
XLK looks particularly bearish right now. Price has failed at the 200-day EMA and the PMO has topped beneath its signal line. It just had a short bear market rally, but it is back to declining. From its high to its recent low, it is a slightly-more-than-20% decline. Participation is lacking, with only 17% of stocks having a 20-day EMA > 50-day EMA (a "Silver Cross") and less than a quarter with price > 20-EMA. Only about half of the sector have "golden crosses" (50-EMA > 200-EMA), meaning they are in a bull market. The rest, we assume, are in bear markets.
PARTICIPATION and BIAS Assessment: The following chart objectively shows the depth and trend of participation in two time frames.
- Intermediate-Term - the Silver Cross Index (SCI) shows the percentage of SPX stocks on IT Trend Model BUY signals (20-EMA > 50-EMA). The opposite of the Silver Cross is a "Dark Cross" -- those stocks are, at the very least, in a correction.
- Long-Term - the Golden Cross Index (GCI) shows the percentage of SPX stocks on LT Trend Model BUY signals (50-EMA > 200-EMA). The opposite of a Golden Cross is the "Death Cross" -- those stocks are in a bear market.

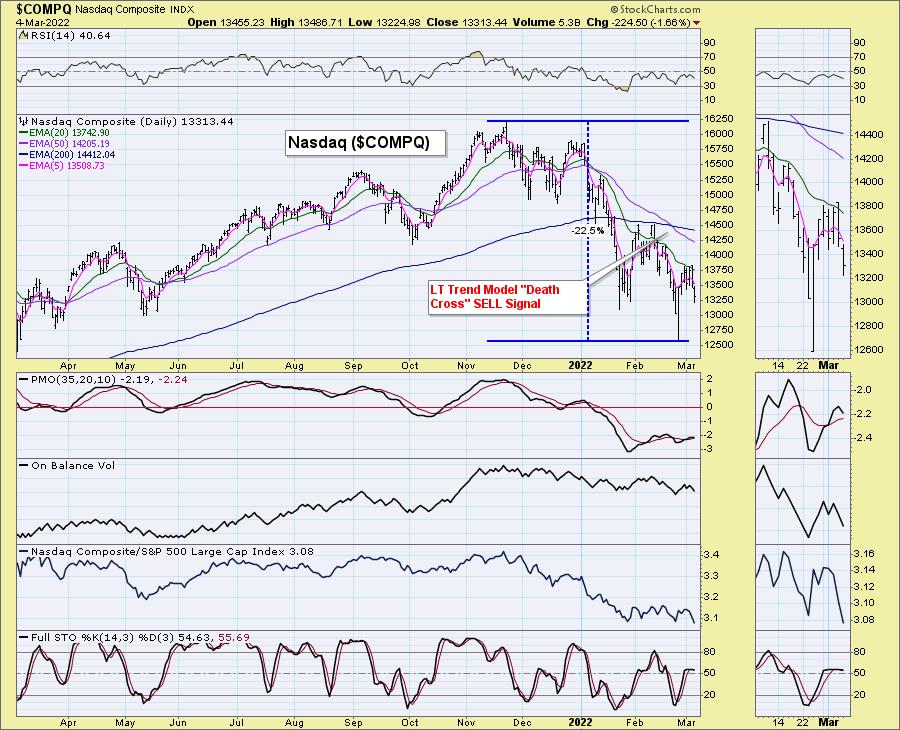
The Nasdaq ($COMPQ) had its "Death Cross" a few weeks ago. It is down over 22% from top to bottom.
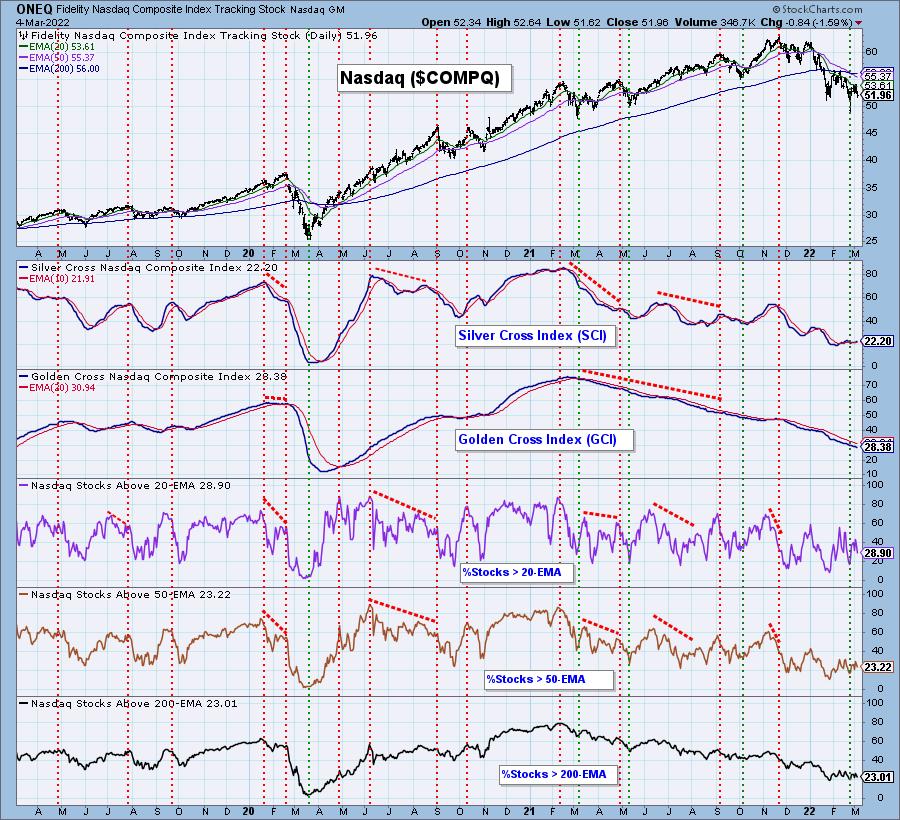
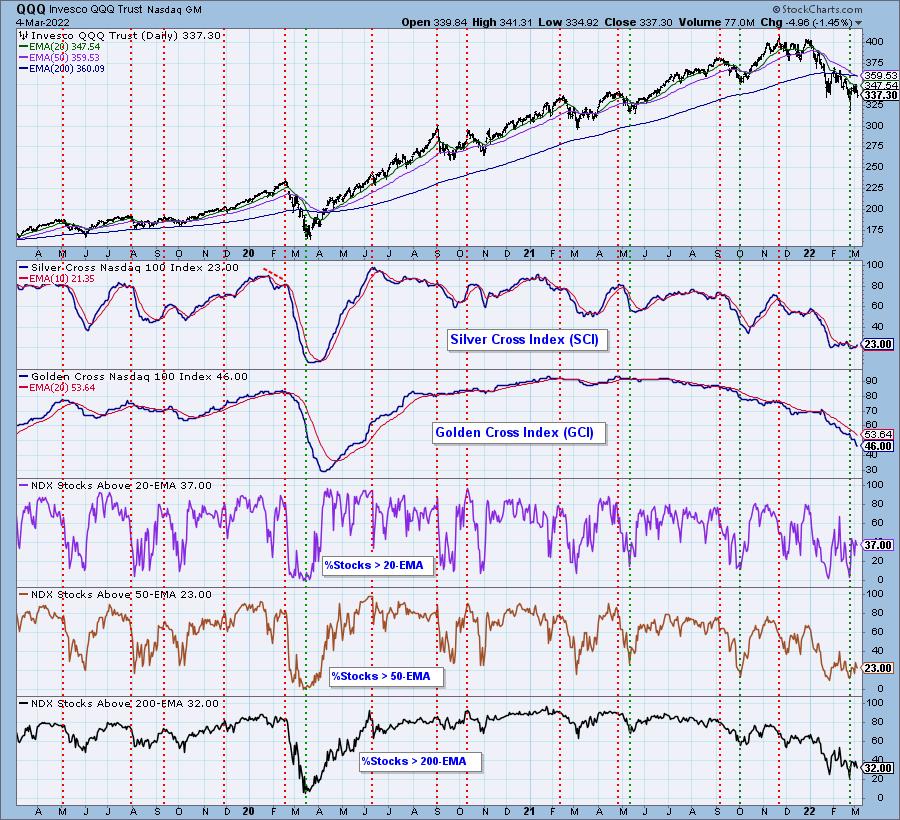
Below is the Participation chart for the Nasdaq. Both the SCI and GCI are at very bearish levels, below 30%.
The NDX had a Death Cross yesterday. It was down a little over 22% from all-time high to the last low.
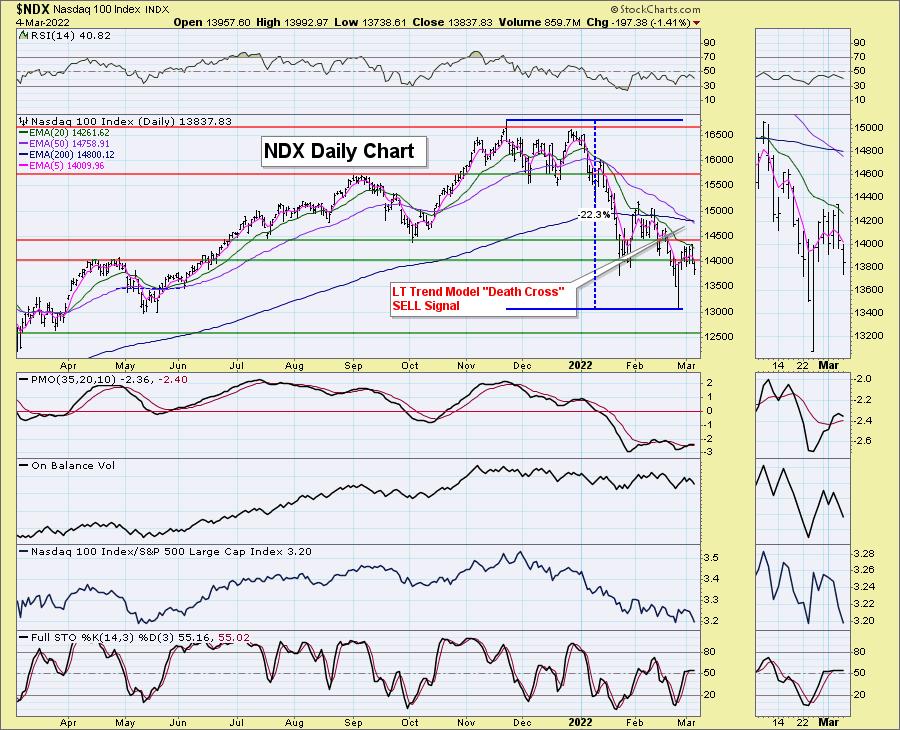
Below is the participation chart for the NDX. The SCI is at a paltry 23% and the 46% reading on the GCI tells us that more than half of the index are in bear markets themselves.
Conclusion: Aggressive sectors like Technology continue to be very weak. There are wartime beneficiaries out there like Crude Oil, Gold, Specialty Chemicals, Metals and Mining, to name a few. Erin has been following these closely in the subscriber-only DecisionPoint Diamonds reports. She had some very successful stock picks from these areas that had "Diamonds in the Rough" finishing this week in the green.
Don't miss this FREE upcoming educational opportunity to see Erin present at the "4th Annual Women Teach Investing" conference! If you can't go, the recording will be sent to registrants. She will be presenting her market timing tools that will help you improve your trading entries and exits. You'll also get a follow-up eBook where Erin covers bear market rules. Support Erin and click HERE to register for free.
Good Luck & Good Trading!
Carl & Erin Swenlin

Click here to register for the recurring free DecisionPoint Trading Room! Check out her latest recording:
- Topic: DecisionPoint Trading Room RECORDING
- Start Time: Feb 28, 2022 09:00 AM
- Meeting Recording Link.
- Access Passcode: Feb#28th
Technical Analysis is a windsock, not a crystal ball. --Carl Swenlin
(c) Copyright 2022 DecisionPoint.com
Helpful DecisionPoint Links:
DecisionPoint Alert Chart List
DecisionPoint Golden Cross/Silver Cross Index Chart List
DecisionPoint Sector Chart List
Price Momentum Oscillator (PMO)
Swenlin Trading Oscillators (STO-B and STO-V)
DecisionPoint is not a registered investment advisor. Investment and trading decisions are solely your responsibility. DecisionPoint newsletters, blogs or website materials should NOT be interpreted as a recommendation or solicitation to buy or sell any security or to take any specific action.


