Investing in March is bringing some new challenges to the world. If you have had massive success in Technology investing in the last ten years, then this article is for you. I am trying to divert your attention to the explosive setup showing up right now!
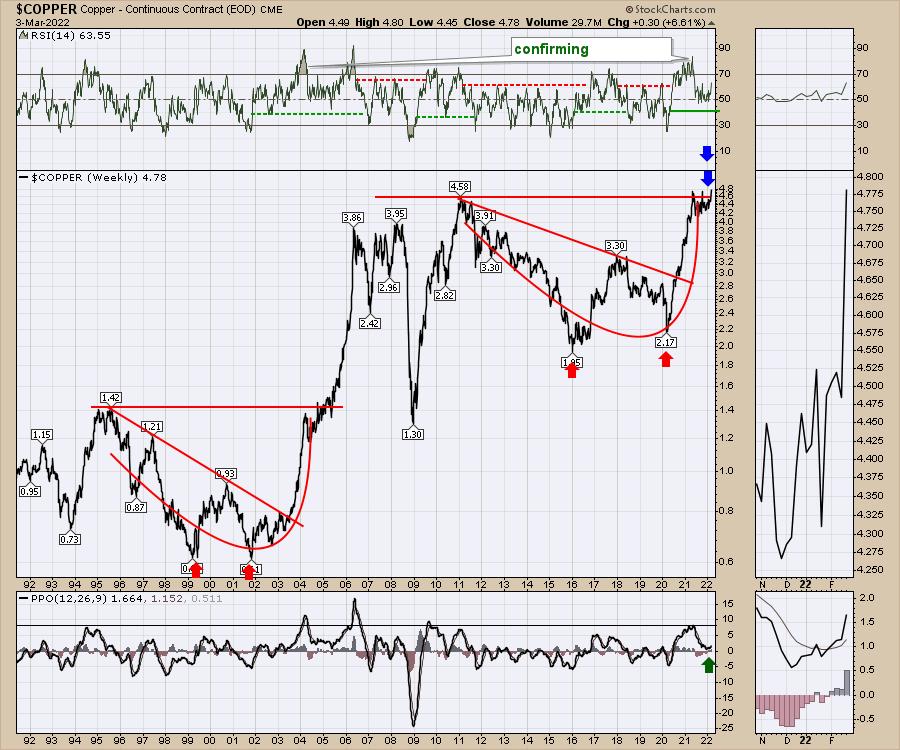
Three charts that are on my must watch list are the charts of Copper, Oil and Gold. Notice the similarities of the Copper pattern so far to the historical pattern in 2005. The prior weekly closing high in 2011 was $4.58. In 2021, we tried to break and hold above that level but retreated. This week, another sudden surge looks ready to smelt some copper at an all-time high. The previous pattern saw copper triple as it broke out and surged for a year. If that happens again, Copper would be $14. My suggestion is that even $7 would be a remarkable surge. Stay tuned, as we are literally right there right now.
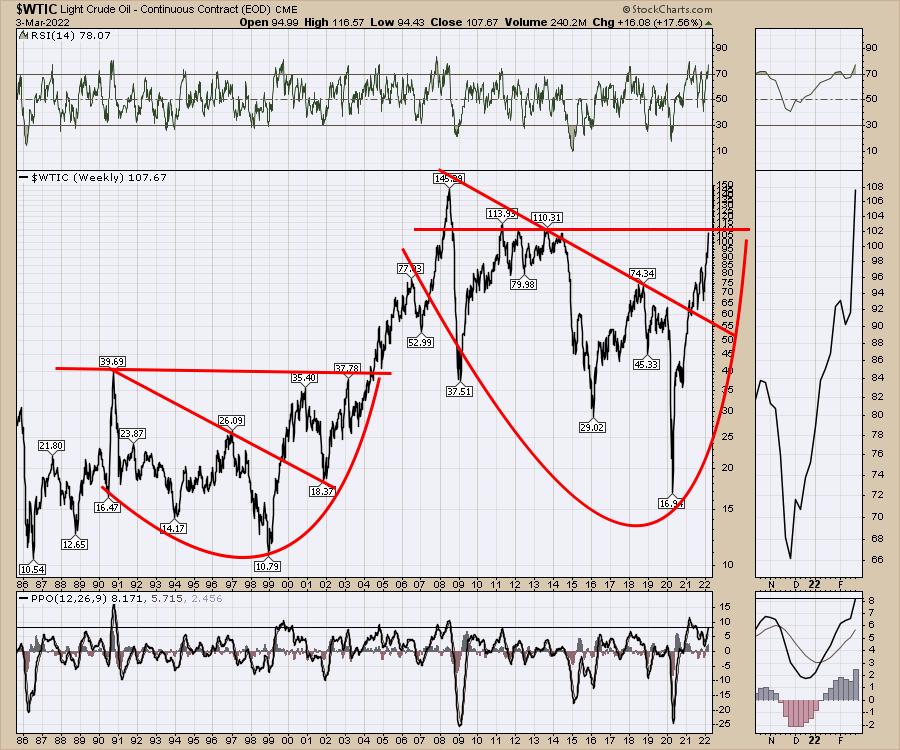
The second chart that is giving us roughly the same pattern as copper is crude oil. The breakout there was $37 to $145, which was a 4x move. That would suggest oil soaring to $440. Okay, even I can't get my head around $440, but a double to $220 would be possible! The previous breakout was 2005.
For investors, the same pattern setup is in Gold. Guess when that breakout happened. Yes, it was also in 2005.
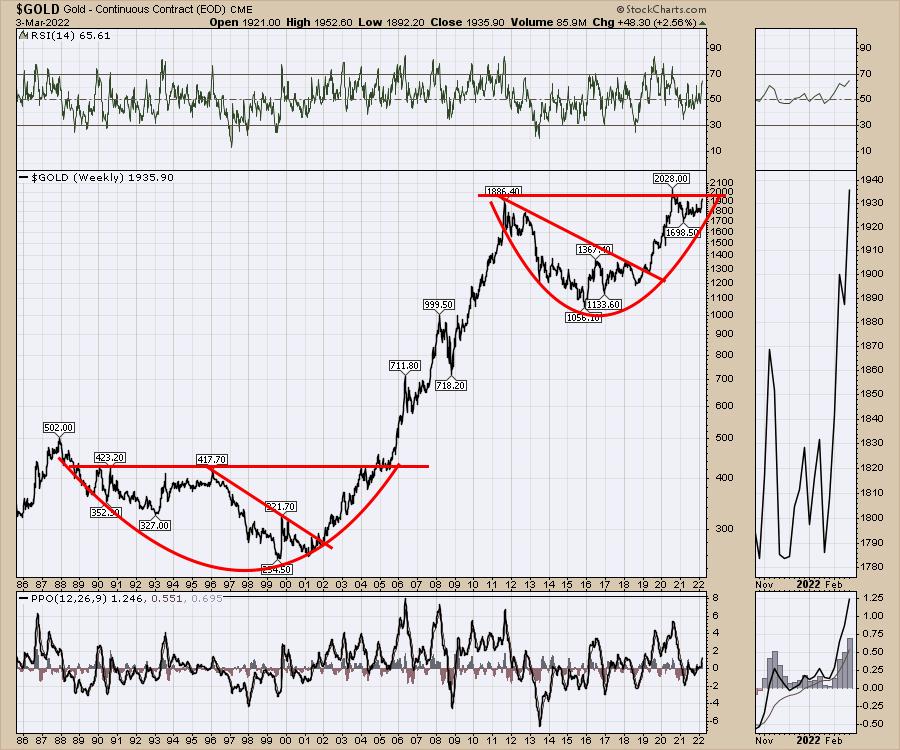
I think the message might just be that, if you loved investing in technology for big gains, it might be time to look across to commodities. I don't think it is a fluke that these big patterns are setting up on all the charts at the same time, like they did back in 2005.
If you would like some help following commodity-related investing, this would be the window to do it. Check out the one month starter package at OspreyStrategic.org for just $7. I'm pretty sure you'll enjoy the ride!
Good trading,
Greg Schnell, CMT, MFTA
Senior Technical Analyst, StockCharts.com
Author, Stock Charts For Dummies
Want to stay on top of the market's latest intermarket signals?
– Follow @SchnellInvestor on Twitter
– Connect with Greg on LinkedIn
– Subscribe to The Canadian Technician
– Email at info@gregschnell.com


