 Sector PerfCharts provide clear performance snapshots of the market mood and the market mood is defensive. The PerfCharts below show the percentage change for the S&P 500 SPDR (SPY) and the eleven sectors. These sectors can be divided into three groups: offensive sectors, defensive sectors and other.
The Technology SPDR (XLK), Communication Services SPDR (XLC), Finance SPDR (XLF), Industrials SPDR (XLI) and Consumer Discretionary SPDR (XLY) are the five offensive sectors. The market is in risk-on mode and playing offense when these are leading. These five sectors also account for around two thirds of the S&p 500.
The Healthcare SPDR (XLV), Consumer Staples SPDR (XLP) and Utilities SPDR (XLU) are the defensive sectors. Even though XLV has some biotechs, healthcare is something we need no matter what. Consumer Staples and Utilities are clearly defensive because we need these products/services regardless of economic circumstances. The Real Estate SPDR (XLRE), Energy SPDR (XLE) and Materials SPDR (XLB) are the last three sectors and somewhat difficult to pigeonhole.
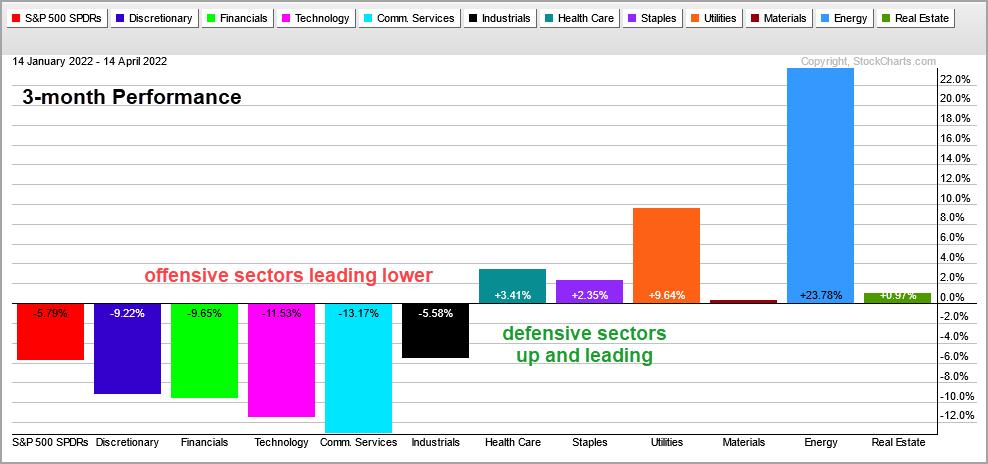
The first PerfChart shows three-month performance. SPY is down 5.8% and the five offensive sectors are also down. XLY, XLF, XLK and XLC are down more than SPY and leading lower. XLI is down less, but still down. The defensive sectors, XLV, XLU and XLU, are up and leading. This is clearly a risk-off environment and is continues as we extend the timeframe.
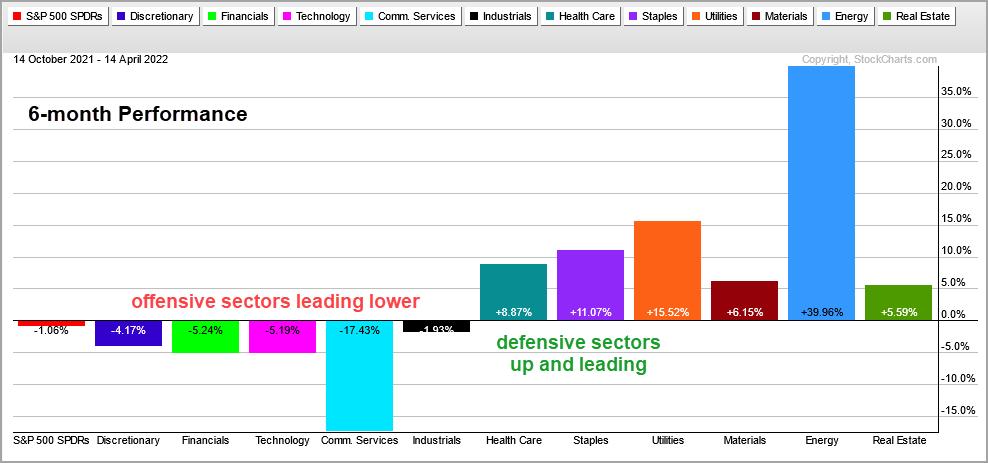
The next PerfChart shows six-month performance. SPY is down around 1% and the offensive sectors are down more. They are leading lower and this is not a healthy picture. The defensive sectors are up and leading.
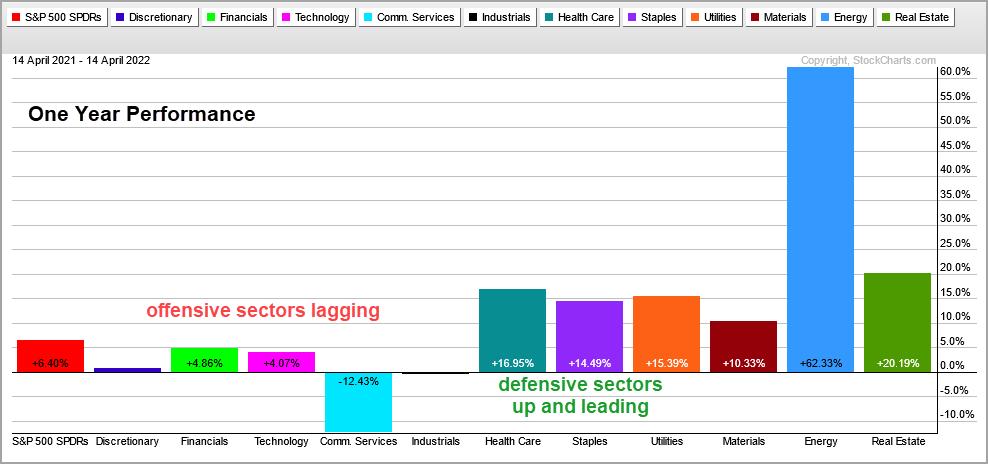
The next PerfChart shows one year performance. SPY is up a modest 6.4%, but only three of the offensive sectors are up and they are up less than SPY (lagging). The other two are down. The defensive sectors are up double digits and picking up the slack.
This week at TrendInvestorPro, I covered the new signal in the Composite Breadth Model and weakness under the surface with the percentage of stocks above the 200-day SMA. Tuesday's report and Wednesday's video analyzed the recent breakouts in gold and silver. Click here for immediate access.
In this week's Next Level Charting video (here), I showed how broad market conditions can influence my chart assessments (breadth, offensive/defensive performance). SPY is holding up, but it is not a leader and there are stronger ETFs out there. Namely, XLB.
The Trend Composite, Momentum Composite, ATR Trailing Stop and eight other indicators are part of the TIP Indicator Edge Plugin for StockCharts ACP. Click here to take your analysis process to the next level.
---------------------------------------
Choose a Strategy, Develop a Plan and Follow a Process
Arthur Hill, CMT
Chief Technical Strategist, TrendInvestorPro.com
Author, Define the Trend and Trade the Trend
Want to stay up to date with Arthur's latest market insights?
– Follow @ArthurHill on Twitter


