With the bank stocks moving lower, well below the 2021 range, it is an odd "rebound" in the indexes. The difference between the bank price action and the indexes is starting to become meaningful. I went through a few of the bank stocks in the financial sector to see what is going on.
JP Morgan (JPM)
JPM - the Just Print Money stock is actually below the range of the last three quarters in 2021. The real issue is the technical backtest at the neckline and now the accelerating breakdown below that. For technicians, this is textbook down-trending price action.
- The stock falls below the 200-DMA (daily moving average) in green.
- It bounces back up, but fails to regain the prior highs and stalls at the 200-DMA (mid February). Then the stock pushes lower to the next level of support (2021 lows and the year-end 2020 price level) and bounces March 14.
- The stock rallies again, but fails at the neckline this time, not getting anywhere near the 200-DMA.
- The stock is making a series of lower highs and lower lows; for technicians, the definition of a downtrend. But there were other clues on the chart. On the ultimate high, the SCTR rallied briefly but failed to hold above the 75 level. The stock price made a marginal new high, but rolled down quickly. It rallied again into early January, participating in the Santa Claus rally. But bigger pain was just around the bend.
- The stock gapped lower -- presumably from earnings -- and the downtrend was under way. It all looks so easy in hindsight. The relative strength in purple made new 12-month lows in December, prior to the stock gapping down. That can be a great clue to underperformance, but long-term buy-and-hold investors don't use those clues.
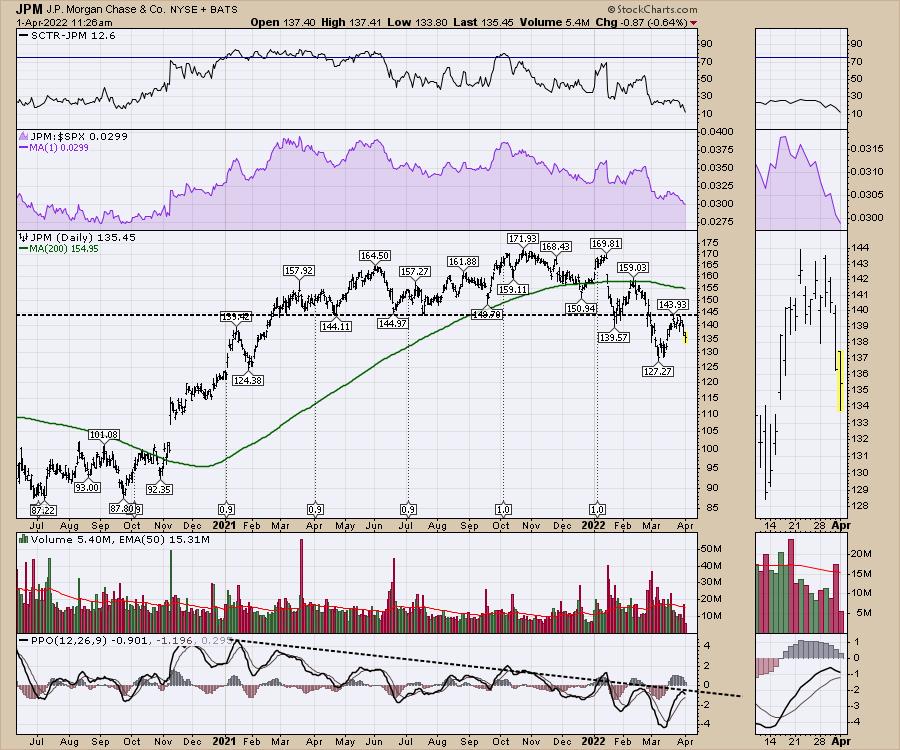
The PPO momentum indicator continues to make a series of lower highs. For me, the stock is an avoid.
Goldman Sachs (GS)
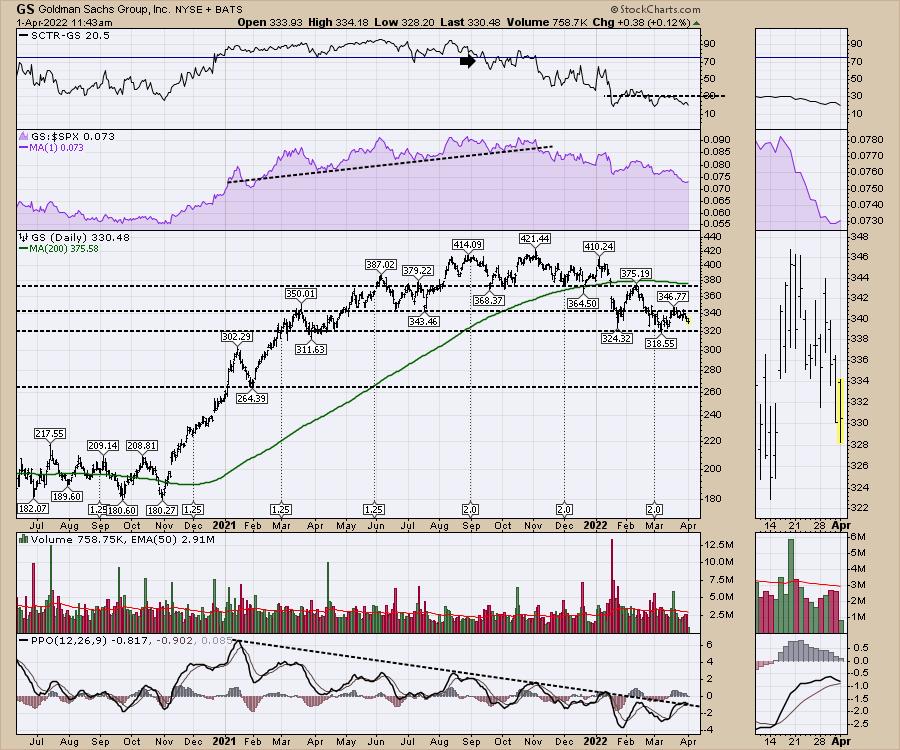
Looking at Goldman Sachs, the chart is just as wobbly. All the same conditions are in place. The SCTR says 80% of the stocks have better price action. There is no reason to buy the stock here.
BlackRock (BLK)
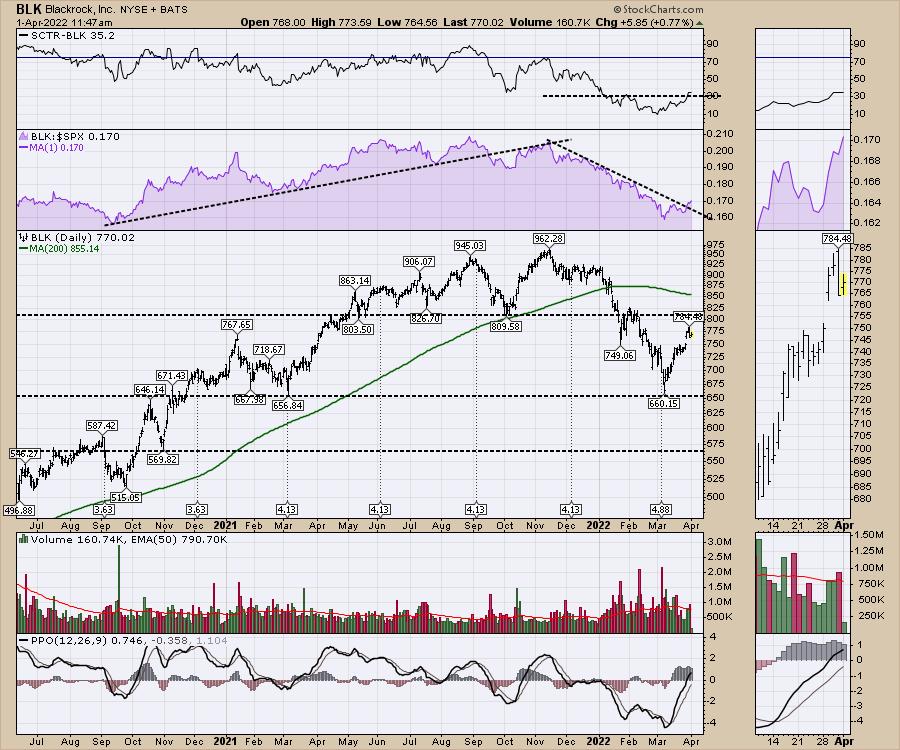
Before we get too bearish, the chart of BLK should be examined. It has been in a downtrend, but the relative strength compared to the $SPX has broken the downtrend. It's at least trying to bounce, unlike the other two.
Blackstone (BX)
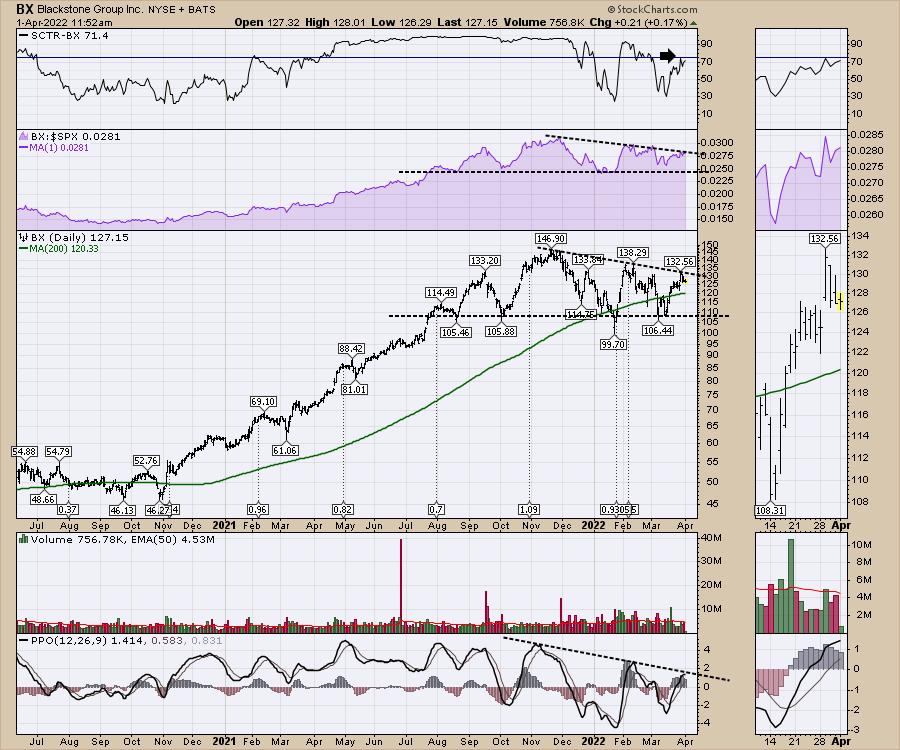
So that takes us to BlackStone, where the CEO is the king of big pay cheques, making $1.1 billion last year.
The chart is in much better shape than all three of the above, but the stock peaked in November. It has been moving in a tight range, with support around the $110 level. Can it hold here and start to work higher, or will it turn out to be just one phase shift behind the others and begin to move lower in earnest?
As the financial charts show duress, it's no wonder the average portfolio is having trouble making money. If these money-printing organizations are being sold off, what does that say about the rest of the market? Well, I have something to say about that!
I recently recorded a Market Buzz that you might find interesting, titled "20-Year Trends are Breaking".
Cover Graphic for Market Buzz Video
I also recorded the monthly conference call for clients at OspreyStrategic.org on March 31st. You can try a subscription to the site for just $7 for the first month by following the link above. After signing up for the offer, click on the tab Gold Members. If you are wondering why portfolio managers, hedge funds and high-net worth individuals are clients, this is a great opportunity to check out the unique indicators and insights Greg provides.

Best wishes for a great second quarter. Based on the charts above, it should be eventful.
Good trading,
Greg Schnell, CMT, MFTA
Senior Technical Analyst, StockCharts.com
Author, Stock Charts For Dummies
Want to stay on top of the market's latest intermarket signals?
– Follow @SchnellInvestor on Twitter
– Connect with Greg on LinkedIn
– Subscribe to The Canadian Technician
– Email at info@gregschnell.com
