It's been a difficult year for investors focused on what used to be working.
I've noticed a small, subtle trend that has started to emerge at the beginning of each month. It has been focused towards the Nasdaq, but financials and consumer discretionary have also been hit. The purpose of this article is to not get caught in the weeds by staring at these smaller trends. You'll see charts like this on the daily view, but I'd like to change the context as we roll through the article.
The Little Picture
The market has started a correction to begin each month this year. Is this a significant data collection model with four points in a row working?
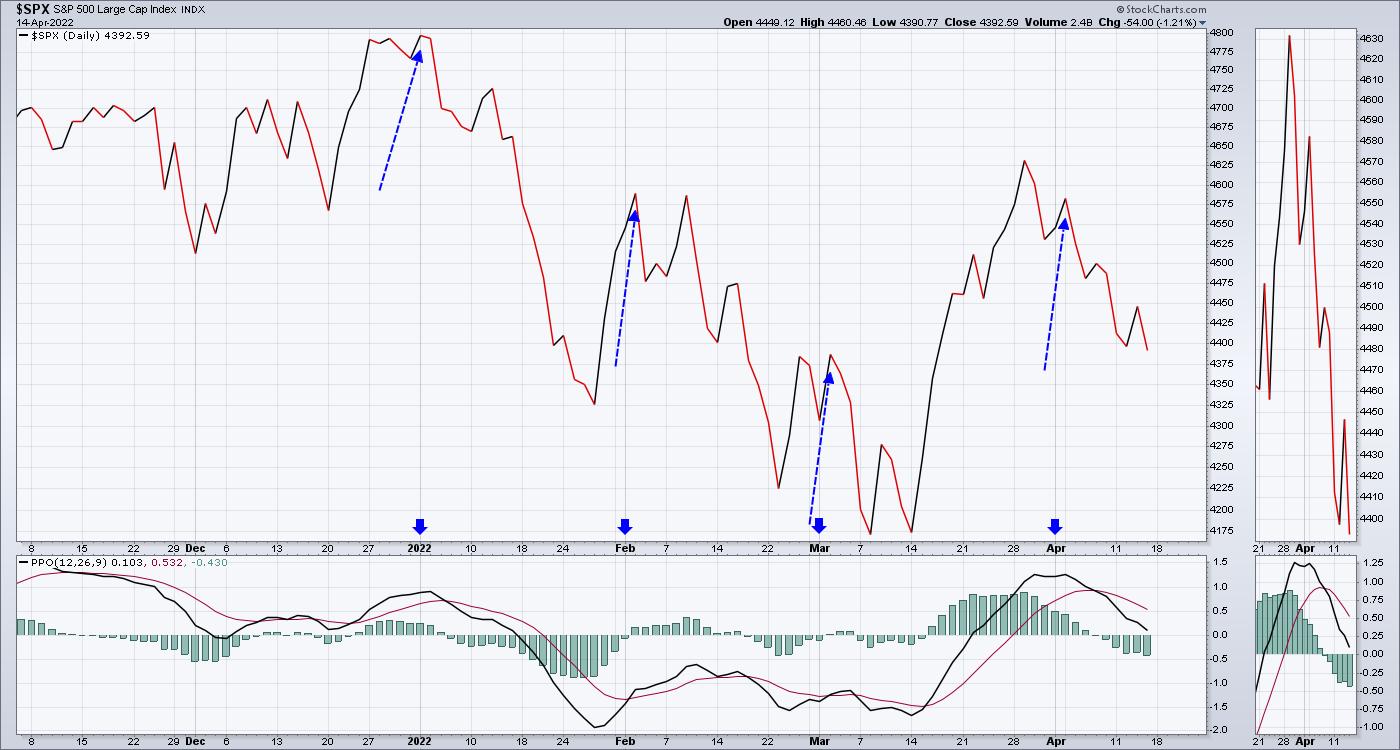
Two of the downtrends (January and February) ended shortly after Options expiration. The March rally started heading into options expiration (March 18th), but once again failed after month end. That leaves us in an awkward situation. As Options Expiration took place on April 14th, can we rally from here to month end or will earnings fail to be a catalyst?
It has been a tricky market to judge. Can we move higher from here? This is a short-term view, but the big picture is also changing. What I think is more important is understanding the shifting sands underneath our feet, regardless of what the next few weeks bring.
Long-Term Timeframes
I am much more worried that some very long trends are breaking and, eventually, things just go haywire. You can see subtle changes in charts week in and week out, but big trend changes are important. When they happen, it is not obvious at first, but, all of a sudden, they start to accelerate.
What are those long trends? The charts below show some major changes that are noteworthy, as we are still in close proximity to the trend lines.
Currencies
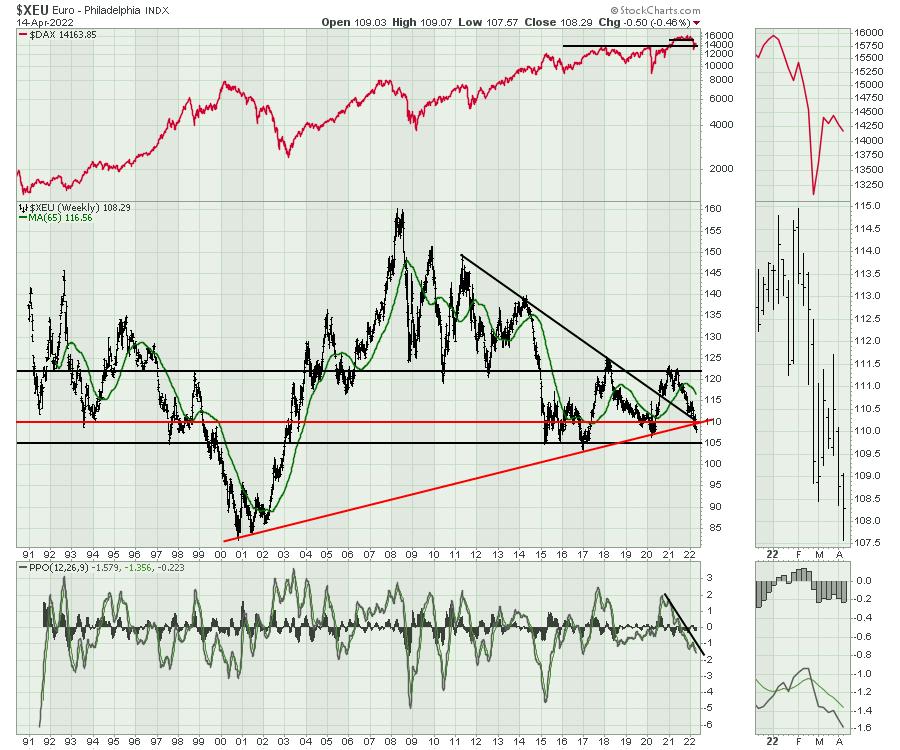
The Euro is breaking the 20-year uptrend. This uptrend started when the Euro became the transaction cash for the Eurozone on January 1, 2002. The surge above the down trend started when the COVID-motivated central banks started kicking money around. Since the SPAC bubble in 2021, the Euro has been slipping. It has now taken out the big uptrend and the next important horizontal support is 105. What happens if there is a steady march away from the Euro?
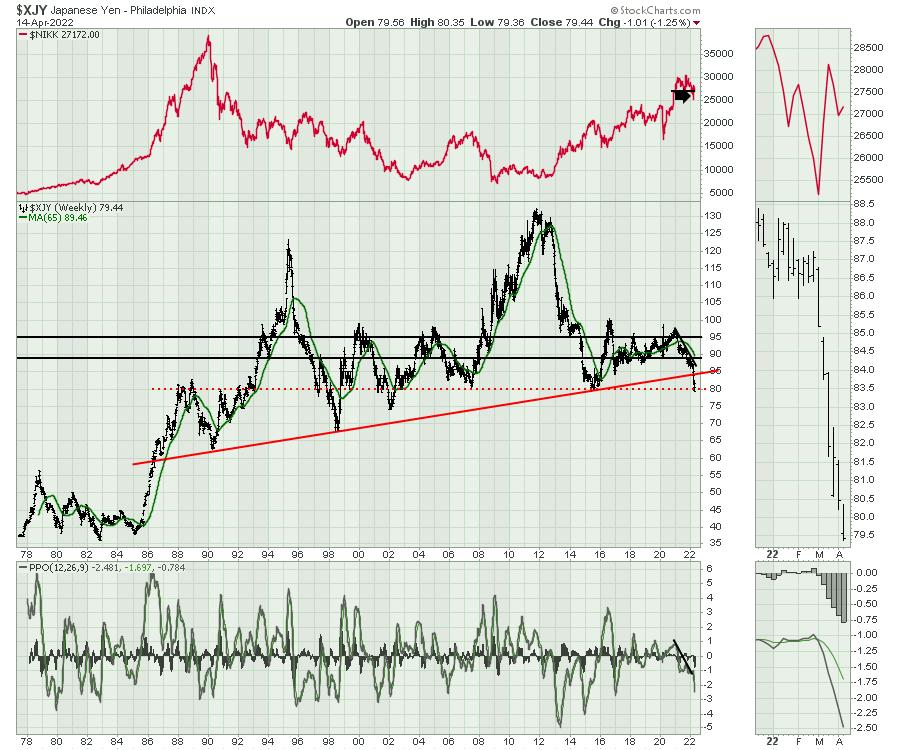
Another long-term trend broke on the Japanese Yen. The big 35-year uptrend broke a few weeks ago. The Yen has taken on a waterfall approach, moving down below the horizontal support of the last 20 years. That's a big deal. Like the Euro, we must ask what will happen if the rush away from the Yen continues, as it has dropped over 10% since the beginning of the year and closed near the lows again.
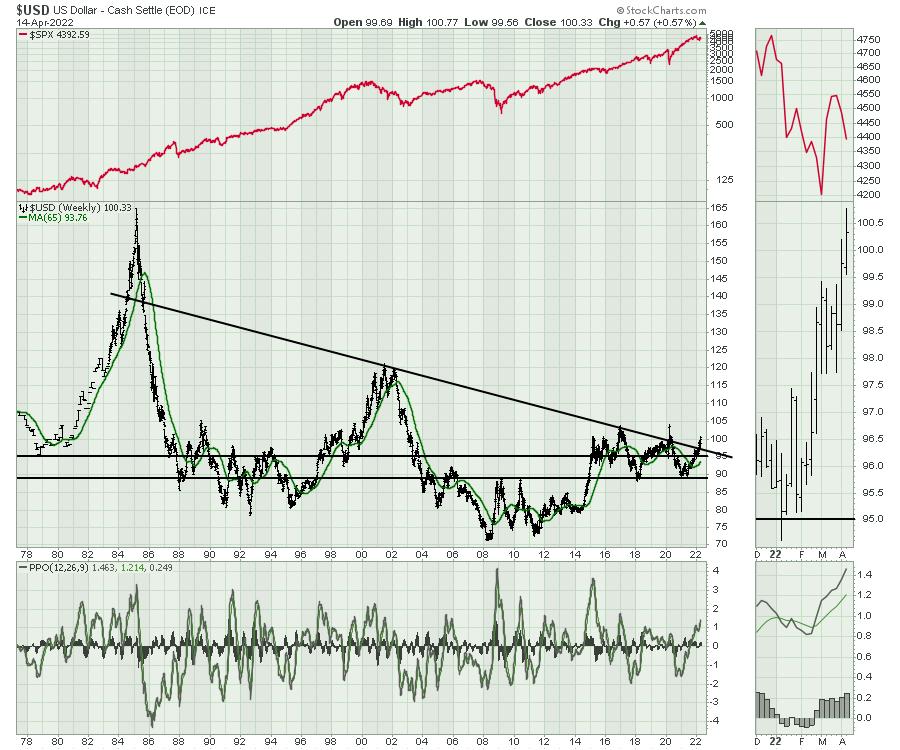
The US Dollar Index is also breaking out as well. The Dollar shot up on COVID briefly, violating the trend line. The current move looks more sustainable.There is significant friction or resistance at 105. Back in 2000, as the stock markets rolled over, the Dollar also surged above 105. What happens if everyone moves aggressively into the Dollar?
The breaking of these currency trend lines are worrying. These are seismic shifts in global monetary systems and they are rolling out a little further each week. When trend lines that represent the length of a career are breaking, there are very few people who know how to deal with those changes.
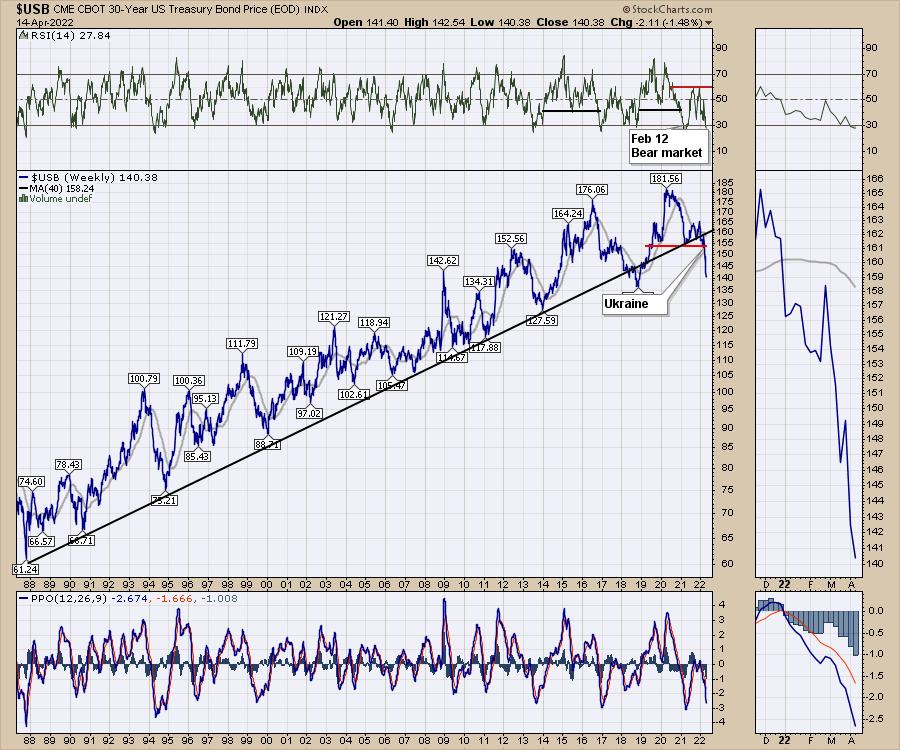
Bonds
In the bond market, there are lots of trend lines to talk about. I've used the 30-year bond price to show what is happening. I put the Ukraine comment on the chart on February 24th. We were clearly moving outside the trend line before, but the acceleration down in price has been large.
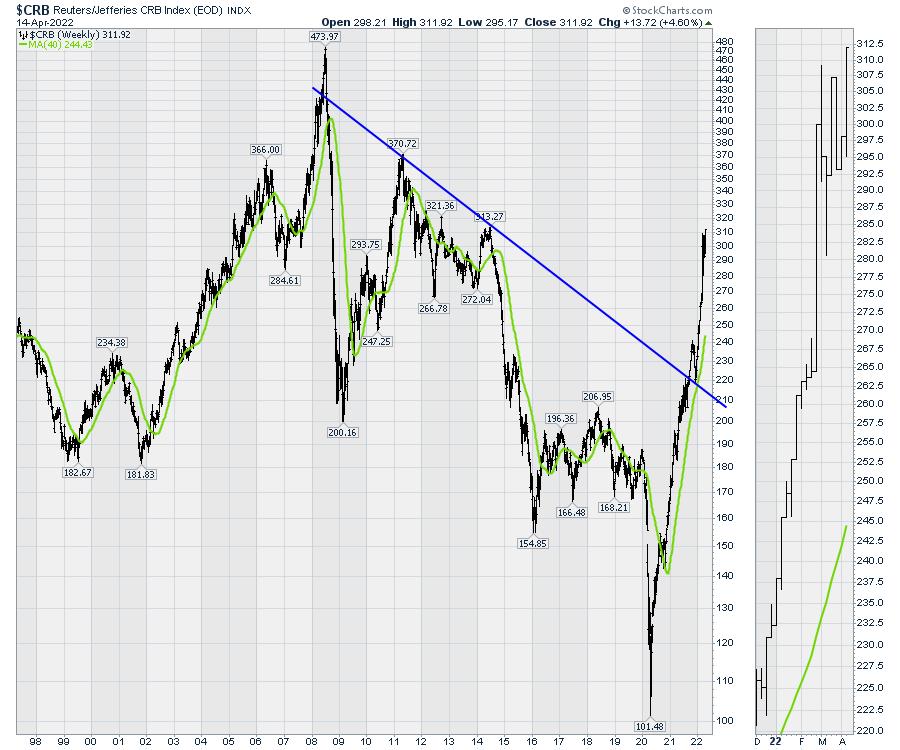
Commodities
The charts above include changes in currencies and bonds. The commodity charts are soaring as well.
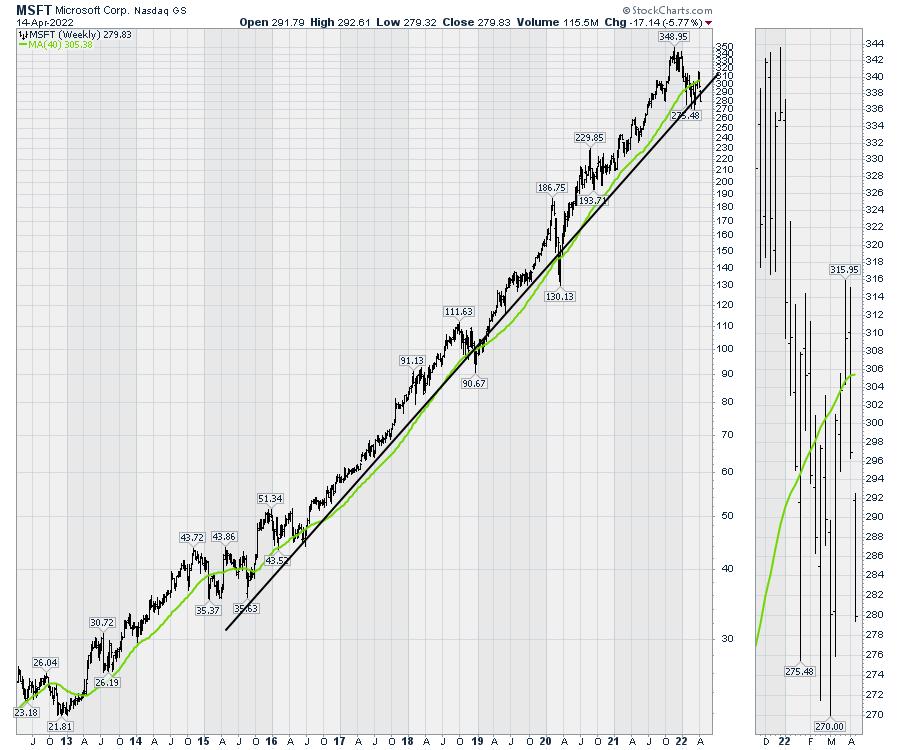
Tech Stocks
Tech stocks are testing long-term uptrends. The world is changing rapidly and the charts are all leaning towards big historical changes. Look how close MSFT is to breaking away here:
One thing that is becoming apparent to me is the four asset classes are all changing. Stay abreast of the changes on the charts as the fundamental data will start to disintegrate long after the charts have.
If you would like to be kept abreast of these macro level moves, I invite you to try the $7 first month offer at OspreyStrategic.org.
Good trading,
Greg Schnell, CMT, MFTA
Senior Technical Analyst, StockCharts.com
Author, Stock Charts For Dummies
Want to stay on top of the market's latest intermarket signals?
– Follow @SchnellInvestor on Twitter
– Connect with Greg on LinkedIn
– Subscribe to The Canadian Technician
– Email at info@gregschnell.com


