As we closed out 2021, I began discussing sentiment and its need for a "reset." We had moved higher for the better part of two years, and the U.S. stock market had picked up a lot of new "post-pandemic" investors and traders. Unfortunately for this new crew, they had only experienced success and a rising market. It was one of my warning signs that I discussed at MarketVision 2022 on January 8th, 2022.
You don't just flip a switch to generate the kind of bearishness that it takes to mark major bottoms; it evolves over time. The problem, however, is that the generation of this extreme bearish sentiment only occurs after one thing: a period of falling equity prices and one final the-market-will-never-go-up-again type of market calamity.
We're not there yet - not even close, actually. And that's what scares me.
On Thursday, the day after we saw a post-Fed surge in U.S. equities, we lost all of those Wednesday gains and much, much more. But did you see the equity-only put-call ratio ($CPCE)? It was .63.
Let me give you some context with respect to this reading. Every significant market bottom this century has occurred with a 5-day moving average of the equity-only put call ratio at .75 or higher. Nearly every one has occurred with this 5-day moving average at .80 or higher. And on Thursday, one of the worst days we've seen in a very bearish 2022 prints a .63 reading. In a nutshell, that's the reason why we haven't bottomed yet. Traders continue to believe that the market is suddenly going to surge right back to new highs. They've been "trained" to believe this by the last two years.
The following S&P 500 chart has the 5-day moving average of the equity-only put call ratio in the panel beneath it:
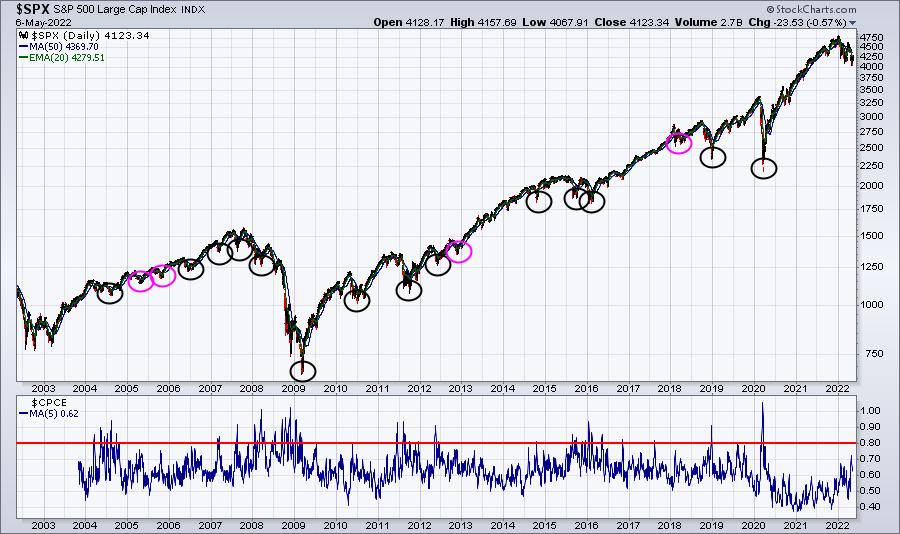
I circled all the key price bottoms over the past two decades. There were 18 of them. 15 saw the 5-day moving average of the equity-only put call ratio peak at .80 or higher (black circles). The other 3 saw it peak at .75 (pink circles). There are no other key bottoms on this chart. Will the 2022 bottom be different from all the others? I doubt it.
So how do we get this moving average to .75 or .80 when Thursday's reading, on one of the most bearish days of the year, was only .63? This moving average is just .62 right now. To see this moving average jump to at least .75 will likely require much more bearish market behavior. But here's the scary part. The 5 days leading up to the market bottom are usually among the worst throughout the entire downtrend. Look at this 5-year S&P 500 chart:
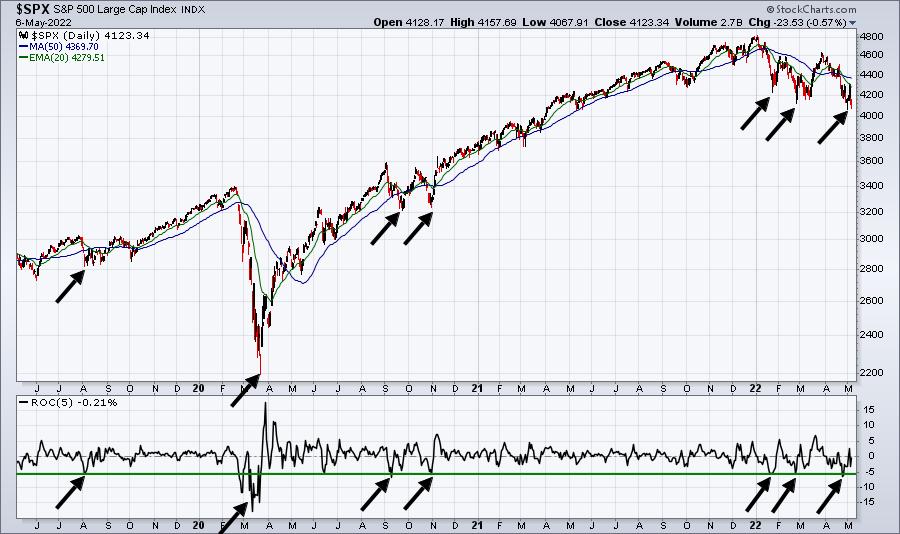
The bottom panel highlights the 5-day ROC (rate of change). Note how steep the selloffs are to mark these market bottoms.
I do remain firmly bullish long-term. And I believe the low and upcoming market bottom in 2022 will provide a tremendous opportunity for patient investors and traders. That is the exact same thing I said at the end of 2021 and I believe nothing different now.
Get ready to buy, but not just yet. Stay tuned.
In the meantime, I want to invite all of you to subscribe to our FREE EB Digest newsletter, which is published 3x per week on Mondays, Wednesdays, and Fridays. There is no credit card required and you may unsubscribe at any time. Everyone on this newsletter receives an automatic invitation to all of our free webinars. CLICK HERE to sign up with your name and email address. We do not share your information with any outside third parties.
Happy trading!
Tom


