It's been an extremely tough period for the markets over the past 2 weeks, with oversold rallies giving way to major selling. This uptick in volatility highlights investors concerns as we head into a period of rising interest rates amid what many consider to be an economic slowdown.
There are many factors currently driving price action in the markets, such as a higher dollar, rising oil prices and inflation at a 40-year high; however, investors' response to 1st quarter corporate earnings reports has been one of the most impactful drivers of individual price action in stocks.
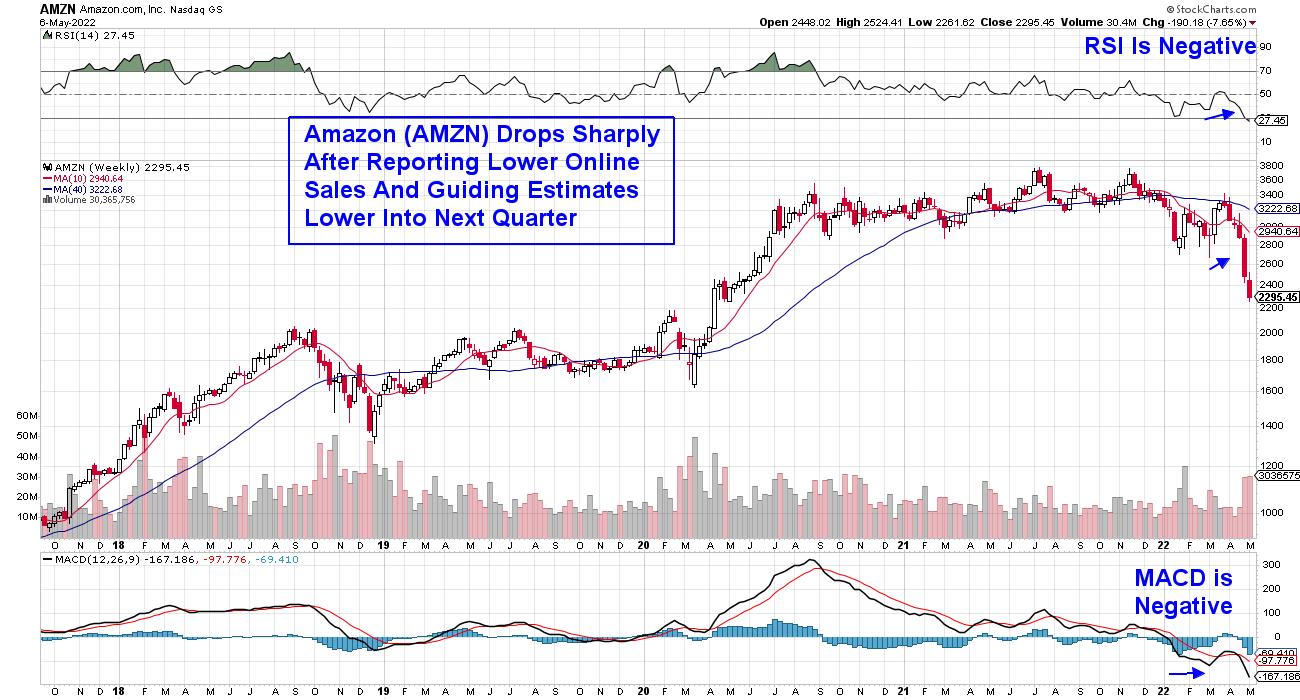
Amazon (AMZN)'s decline since the release of their 1st quarter results is a prime example. The company reported their first quarterly loss since 2015 due to lower online sales. Even more impactful was their lower sales forecast going into next quarter, due to macroeconomic conditions and Russia's invasion of Ukraine. Investors headed for the exits, with AMZN dropping 21% on heavy volume since the report. With even a well-managed company such as Amazon guiding their revenue estimates lower, investors can only wonder what a less-buffered company may be experiencing.
WEEKLY CHART OF AMAZON (AMZN):
Netflix (NFLX) has fared even worse, with a drop of over 50% since reporting reduced subscribership amid increased production costs.
According to Factset, many companies in the S&P 500 are reporting earnings above estimates; however, it's single-digit earnings growth, which hasn't been seen since the 4th quarter of 2020, when the U.S. was still in the throes of the pandemic. The lower results are being attributed to both a difficult comparison to an unusually high earnings growth rate during Q1 2021 and continuing macroeconomic headwinds.
With strong earnings being the hallmark of a bullish market, current single-digit earnings growth points to a broader market that may be headed lower, as tougher comparisons for earnings will continue into next quarter. At this juncture, I'm paying close attention to the longer-term monthly chart of the S&P 500 for guidance.
Below is a marked-up chart and, as highlighted, when both the RSI and Stochastics turned negative during a period when the S&P 500 was already trading below its 6-month moving average, further downside occurred for the S&P 500.
MONTHLY CHART OF S&P 500 INDEX
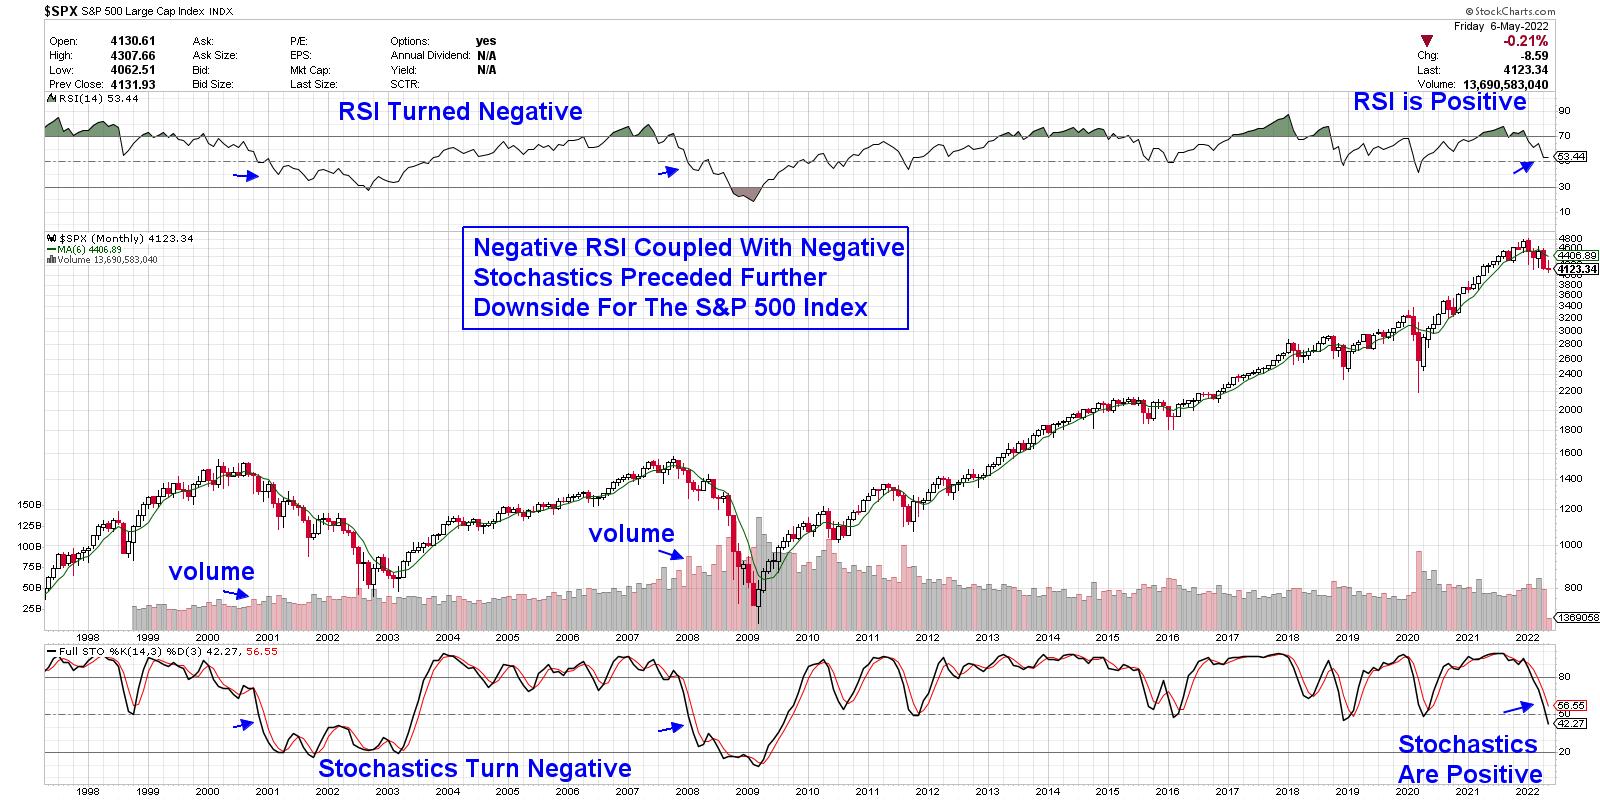
In both 2000 and 2008 (shown above), the negative turn in the RSI and Stochastics indicators occurred when the S&P 500 was already down ~13%. The S&P 500 is currently 13.3% below its high in price. As for the further downside beyond the 13% in the S&P 500 in 2000, the Index went on to lose 38% more until hitting a late-2002 low in price. During the 2008 period, the S&P 500 went on to decline 45% more beyond its original 13% loss. To be fair, both bear markets mentioned above occurred during extraordinary conditions, with the 2008 banking collapse being the worst financial disaster since the Great Depression. The 2000-2002 bear followed the sharpest rise in Technology stocks in history, with valuations of Tech stocks ballooning to well-above normal.
While most of the eleven sectors in the S&P 500 are in downtrends, not all areas are headed lower. Subscribers to my MEM Edge Report experienced a 20% increase in Energy stock Devon (DVN) last week, which we highlighted as a buy in last Sunday's Report and reiterated as a buy in our Midweek Report.
If you'd like to be alerted to when the negative signals outlined above are triggered, trial my MEM Edge Report for 4 weeks for a nominal fee. There are other factors that will determine if the broader markets are headed much lower and you'll want to be aware of them as well.
On this week's episode of StockCharts TV's The MEM Edge, I review where the markets stand following last week's volatile price action. I also share areas that are bucking the downtrend and whether they're poised to trade higher.
Warmly,
Mary Ellen McGonagle, MEM Investment Research