The Consumer Price Index (CPI) report for October 2022 suggested that inflation could be cooling. This was welcome news for the stock market, given that the CPI has been steadily rising since December 2020. October CPI rose 0.4%, below the expected 0.6%, which brings the year-over-year increase to 7.7%, slower than 8.2% from last month. The core CPI, which excludes food and energy costs and is a number the Fed pays attention to, also cooled. It rose 0.3% versus the expected 0.5%.
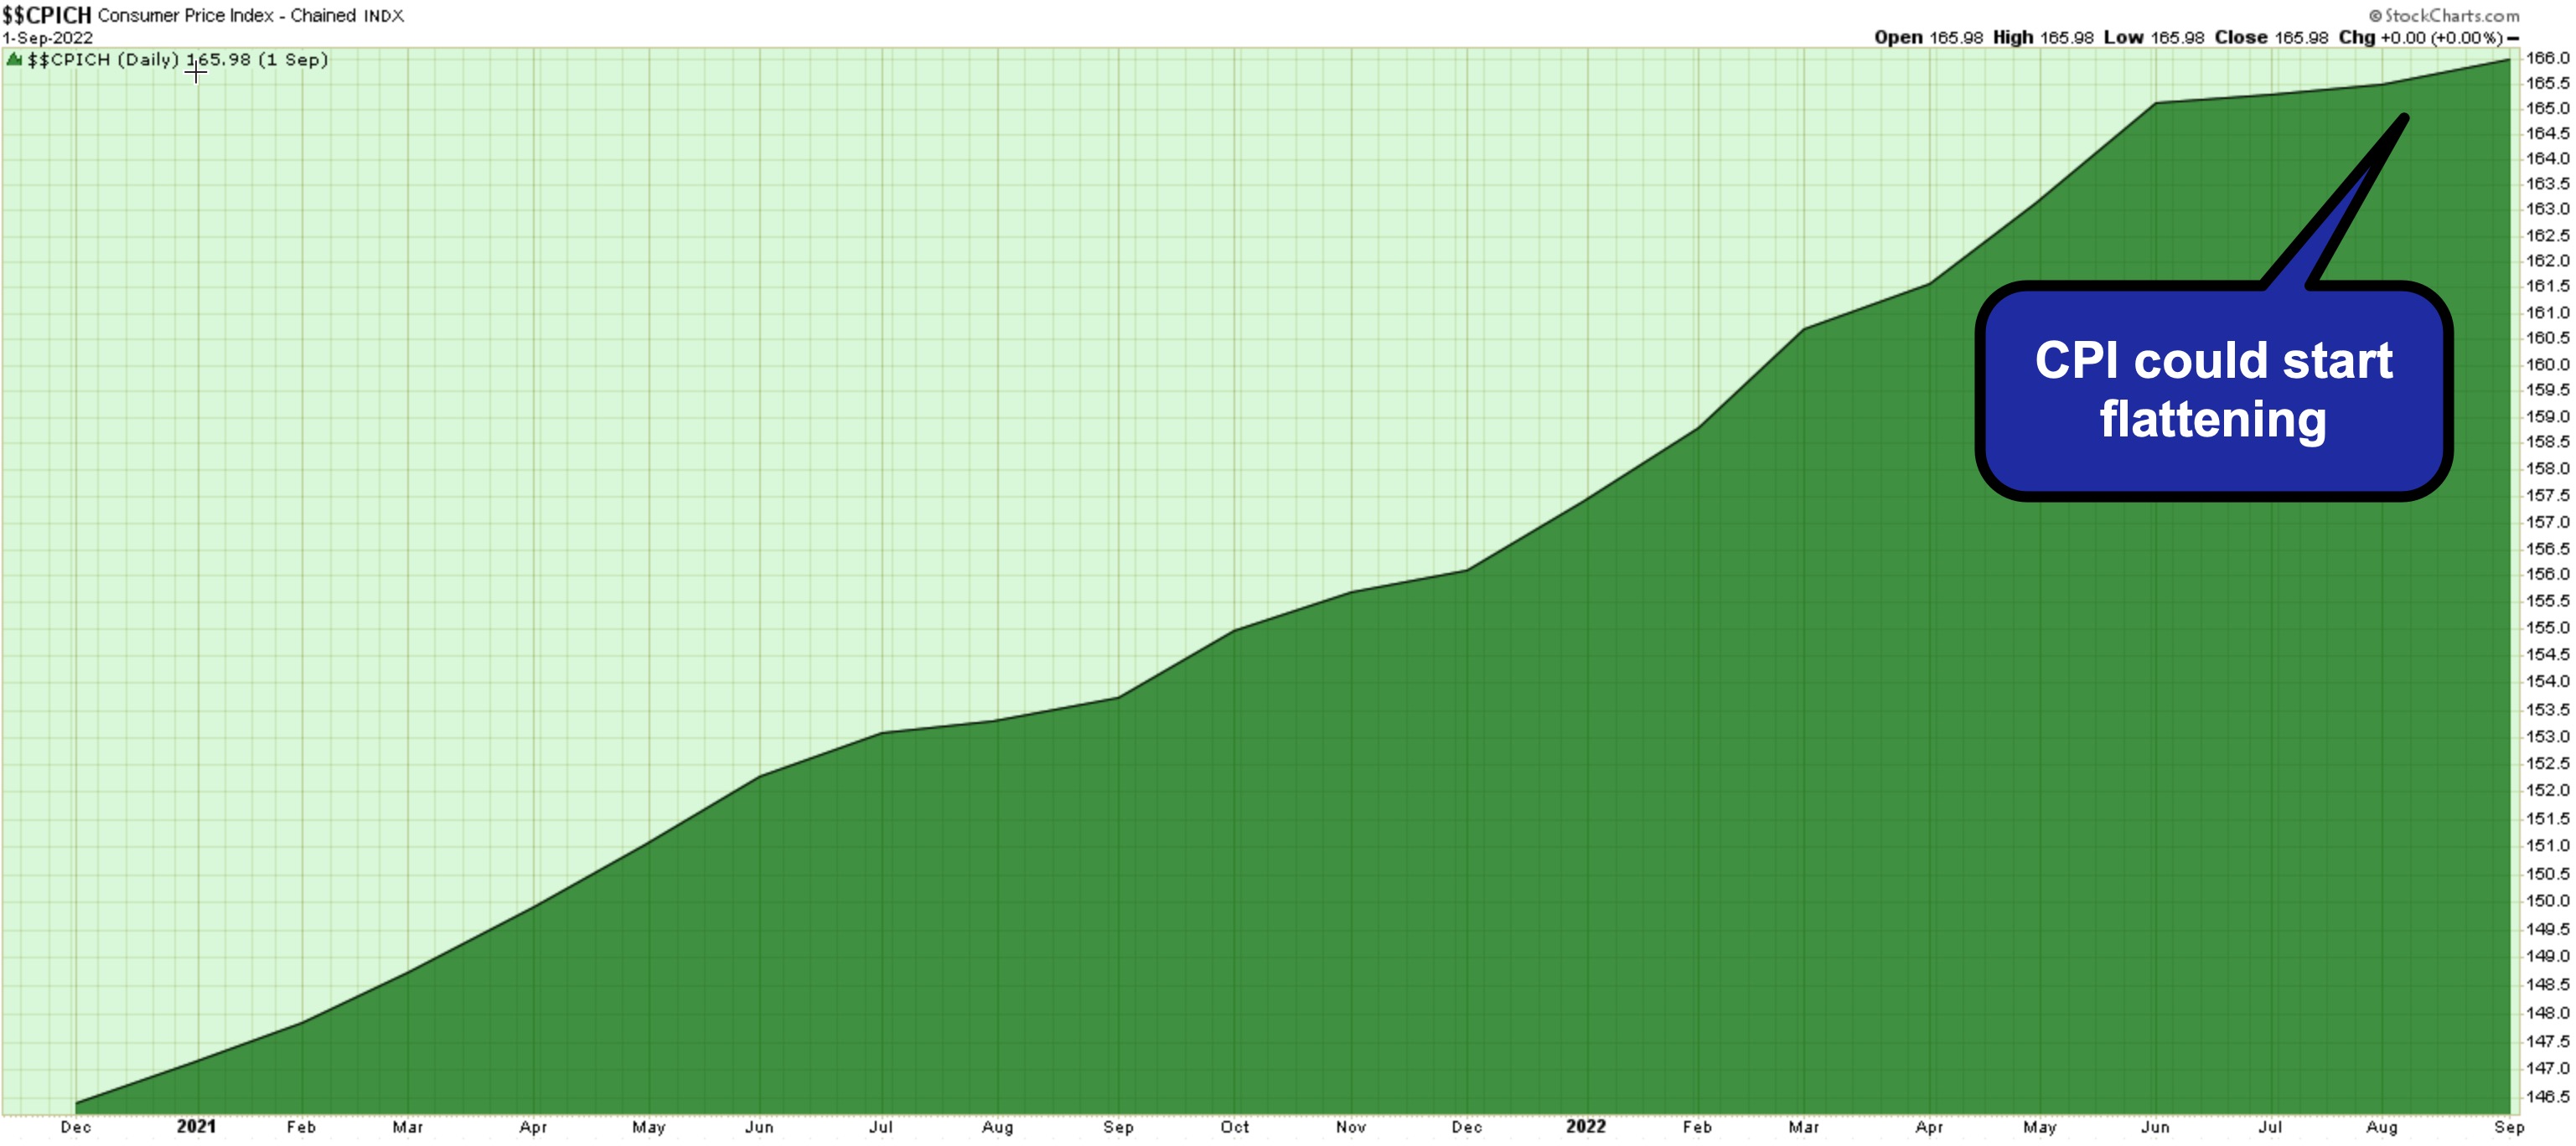
The Consumer Price Index ($$CPICH) has been rising steading since December 2020. Although it has become less steep in the last few months, it's still high. Chart source: StockCharts.com. For illustrative purposes only.
After undecided midterm election results, a crypto shake-up in the Binance/FTX deal, and weak earnings reports, it seemed as if the market was waiting for some good news. When the softer inflation number was announced, equity futures soared on the news. Even battered Bitcoin ($BTCUSD) rose over 10% before the open. Treasury yields and the U.S dollar fell sharply.
While the softer inflation number did give the market a spike, one data point doesn't necessarily mean the Fed will start to pivot. The Fed needs to see several pieces of data before making interest rate decisions. Interestingly, the next CPI number will be released on the first day of the two-day Fed meeting in December.
There are still many uncertainties such as the crisis in Ukraine, energy prices, and the U.S. political outcome for the next two years. So, although the market appears to be optimistic, it's still a good idea to keep an eye on the big picture.
A few key points to keep an eye on are:
- The CBOE Volatility Index($VIX). Pre-pandemic, the $VIX, on average, traded between 12 and 20. When $VIX went above 20, investors got jittery. But since the pandemic, the $VIX traded at a higher range, between 19 and 35. After the October CPI number was released, $VIX fell over 9%. It will be interesting to see if $VIX gets closer to its pre-pandemic range.
- The 10-Year U.S. Treasury Yield ($TNX). After the CPI release, $TNX traded below 4%. Higher yields could be a positive sign of the potential slowing down of interest rates.
- The U.S. Dollar Index ($USD). The $USD fell after the softer-than-expected inflation number. Bring up a chart of Invesco DB US Dollar Index Bullish Fund (UUP) to see how the dollar reacted to the CPI report.
The stock market may be confident that the Fed is going to bring inflation down. But things can change, and having the $VIX, $TNX, and $USD on your radar will keep you on top of what's going on in the economy.

Happy charting!


