When it comes to Wall Street, is it more about who controls Congress, or about erasing the uncertainty attached to the midterm election results? The uncertainty is still lingering since the midterm election results are still undecided as of this morning.
Regardless of whether there's a sweep or a divided government, the stock markets tend to rally after the elections. One reason for that—there's no more uncertainty about who retains control. Sometimes, though, it takes a while for the certainty to surface, and the markets may not take kindly to that. That's what we're seeing with the 2022 midterm elections. Since the election results were still up in the air, equity futures were trading lower ahead of the open on November 9, 2022.
No two election years are going to be the same. This year, the markets are coming off their mid-October lows, which could be a positive for the markets. Research done by the Stock Trader's Almanac suggests that, when there's an intersection of the annual seasonal pattern and the 4-Year Presidential Cycle, it could bode well for the markets. "We are in the 'sweet spot' of the four-year cycle from the Q4 midterm year through Q2 pre-election year," commented Jeffrey Hirsch, Editor-in-Chief at Stock Trader's Almanac and CEO of Hirsch Holdings, Inc. "The intersection of the annual seasonal pattern and the 4-Year Cycle produces the quadrennial sweet spot," he added.
Why call it a sweet spot? The midterm low marks the start of the quadrennial rally, which typically continues until the pre-election year high. So does that mean this would be a good time to load up on stocks?
The Post-Election Market
Ahead of the midterm elections, the expectation was that Republicans would take control of the House and possibly the Senate. The general convention is that Wall Street likes a gridlocked government because it means restricted government spending, fewer policy risks, and restricted passing of legislation. This amounts to lower market volatility in the stock markets. This conventional thought could have been the catalyst behind the recent stock market rally. We also saw Treasury yields and the U.S. dollar decline on Tuesday, ahead of the election results. And gold rallied, perhaps due to concerns that prompted exploring the possibility of investing in risk-off assets.
If the intersection of the four-year cycle and seasonal pattern does play out, there's a chance we may have seen the market lows. Based on additional research from the Stock Trader's Almanac, the six-month period beginning in November of the midterm year has performed better than post-election, pre-election, and election years since 1945.
Given that the race for the House and Senate is close, regardless of who takes control of Congress, we're still going to face gridlock. The chart below shows that, on average, when there's been a Democratic President and a Republican Congress, the Dow Jones Industrial Average ($INDU) gained 16.4%. When there was a Democratic President and a divided Congress, $INDU gained 11.7%.
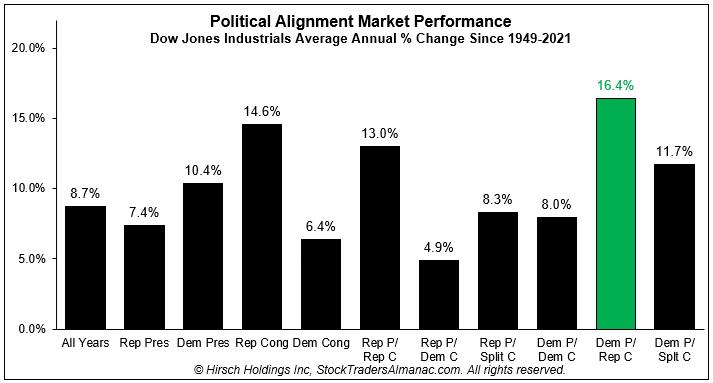 Source: StockTradersAlmanac.com. For illustrative purposes only.
While history helps to provide guidance, each election has unique characteristics. So, in addition to looking at history, it's helpful to take note of prevailing fundamentals.
We are in an inflationary environment, and the Federal Reserve has indicated it'll continue to raise rates until inflation comes down from its current rates. There are also geopolitical tensions that could impact the global economy, which in turn could impact the performance of financial markets.
Market Sectors To Keep On Your Radar
A divided Congress doesn't necessarily mean that passing legislation will be completely restricted. There are many areas of legislation that could get bipartisan support. Let's look at how some of the market sectors could perform before voters head to the polls in November 2024.
Cryptocurrencies: The recent shakeup in the crypto space shows there's a need for regulation in this area. Crypto regulation has bipartisan support and is an area we're likely to hear about in the near future. Earlier this year, President Biden signed a $1.2 trillion infrastructure bill, and there's some crypto legislation baked in there. Besides the tax reporting rules, the passing of crypto legislation could mean continued price volatility in cryptocurrencies. When the news broke that Binance agreed to buy FTX to rescue it from its liquidity crunch, the price of Bitcoin ($BTCUSD) fell 10% on the news and continued falling the following day. Brokerages that offer cryptocurrencies such as Coinbase (COIN) also followed a similar path.
Energy: Energy prices have been trending higher in 2022. The Energy Select Sector SPDR Fund (XLE) is up over 60% in 2022. In light of the higher energy prices, we could see some reforms in the energy sector. The changes could benefit companies such as Occidental Petroleum Corp. (OXY) and Marathon Oil Corporation (MRO), as well as pipeline companies.
Defense: The war in Ukraine puts pressure on passing legislation to support defense spending. Both parties are probably open to the idea of increasing defense spending; the difference in opinion may be in how much that increase will be. Stocks to add to your ChartLists from this sector would be companies such as Lockheed Martin (LMT), Northrop Grumman (NOC), and Raytheon Technologies (RTX).
What's Next?
Hopefully, we know the results of the midterm elections by the end of the week. But there's a bigger concern looming this week—inflation. The Consumer Price Index (CPI) for October will be released on Thursday. This will be a key number to watch, especially after comments from Fed Chairman Jerome Powell's press conference following the Fed's interest rate decision. If inflation comes in higher than expected, we could see an increase in volatility, which could mean a further decline in the equity markets. Although equity indexes have recovered from their October lows, we still need to see additional confirmation before we see a bullish rally. This makes the CPI number a critical one to watch.
The S&P 500 Index ($SPX) needs to move above the 3900 level and follow through. That means a breakout above the 100-period simple moving average (SMA) and towards the 200-day SMA. The downward-sloping 200-day SMA needs to at least show signs of flattening out. If a follow-through above the 100-day SMA and a flattening and/or direction change in the 200-day SMA happen, then we could say the quadrennial "sweet spot" is likely to play out.
 S&P 500 INDEX ($SPX). $SPX needs to move above its 100-day SMA and follow through to see a bullish rally.Source: StockCharts.com. For illustrative purposes only.
The Bottom Line
Looking at past price movements and cyclical patterns can provide insights into potential market movements. Current market conditions also play a role in price action. So set up your ChartLists so they give you a birds-eye view of the markets, then drill down to the sectors that are performing well. If the technical and fundamentals line up, then it may be time to load up on stocks. There's more to Wall Street than figuring out if it's better to ride a donkey or elephant.
Jayanthi Gopalakrishnan
Director, Site Content
StockCharts.com
Disclaimer: This blog is for educational purposes only and should not be construed as financial advice. The ideas and strategies should never be used without first assessing your own personal and financial situation, or without consulting a financial professional.
Happy charting!


