TAKEAWAYS
- The Nasdaq 100 Index ($NDX) has outperformed the S&P 500, DJIA, and Nasdaq Composite
- Momentum indicators can help identify a slowing down in equities
- The difference between the 10 and 2-year Treasury spread is deeply inverted

The first half of 2023 is ending on a positive note—inflation was cooler than expected. But a few days ago, the market wasn't so optimistic.
In an economic forum, Fed Chairman Jerome Powell suggested that two more interest rate hikes are likely this year. This was based on the thought that the last 10 rate hikes may not have worked their way through the economy. Overall, economic data supports this idea. The labor market is still strong, the US economy is growing (Q1 GDP was revised to 2% from 1.3%), and big banks passed the stress test. But the core personal consumption expenditures price index came in lower than expected, a sign that inflation is cooling.
Does that mean the Fed will stop tightening? The stock market may think so, but one piece of data isn't enough to sway the Fed. The CME FedWatch Tool shows an 86.8% probability of a 25 basis point rate hike in its July meeting.
The Stock Market's First Half of 2023
If you were focused on the broader equity indexes, you wouldn't think the markets are worried. Equity values keep moving higher, driven mostly by the Technology sector. The PerfChart below shows that the Nasdaq 100 index ($NDX) outperformed the S&P 500 index ($SPX), the Dow Jones Industrial Average ($INDU), and the Nasdaq Composite ($COMPQ) in the first half of 2023.
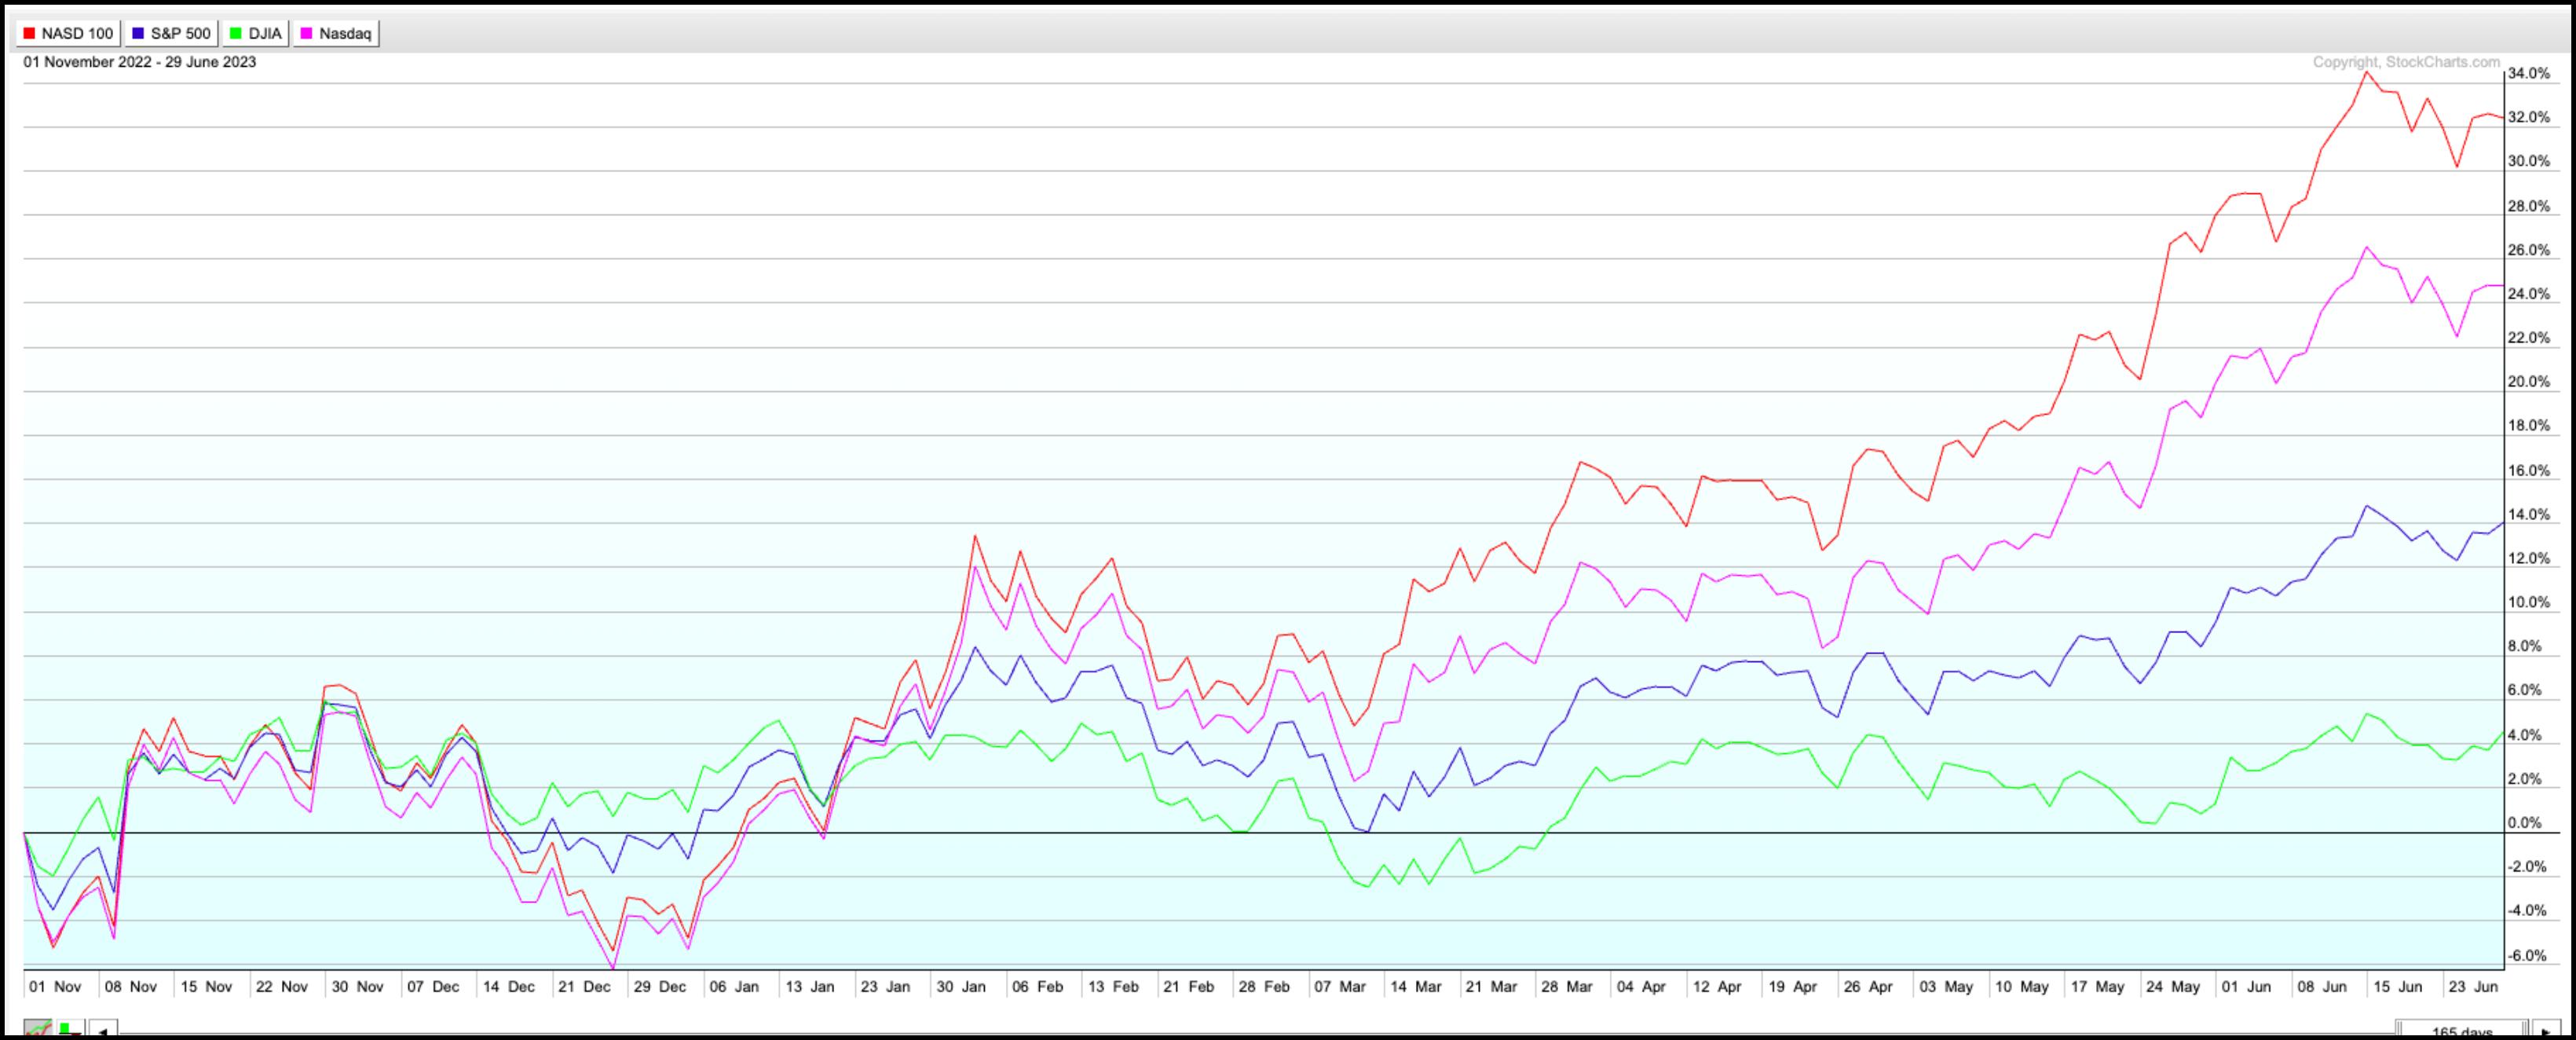
CHART 1. STOCKCHARTS PERFCHARTS OF BROADER INDEXES. The Nasdaq 100 Index is the clear leader. Chart source: StockCharts.com. For educational purposes only.
The S&P Sector Summary also supports the outperformance in tech stocks. The three top-performing sectors in the last six months were Technology, Communication Services, and Consumer Discretionary. This suggests investors are gravitating toward growth stocks.
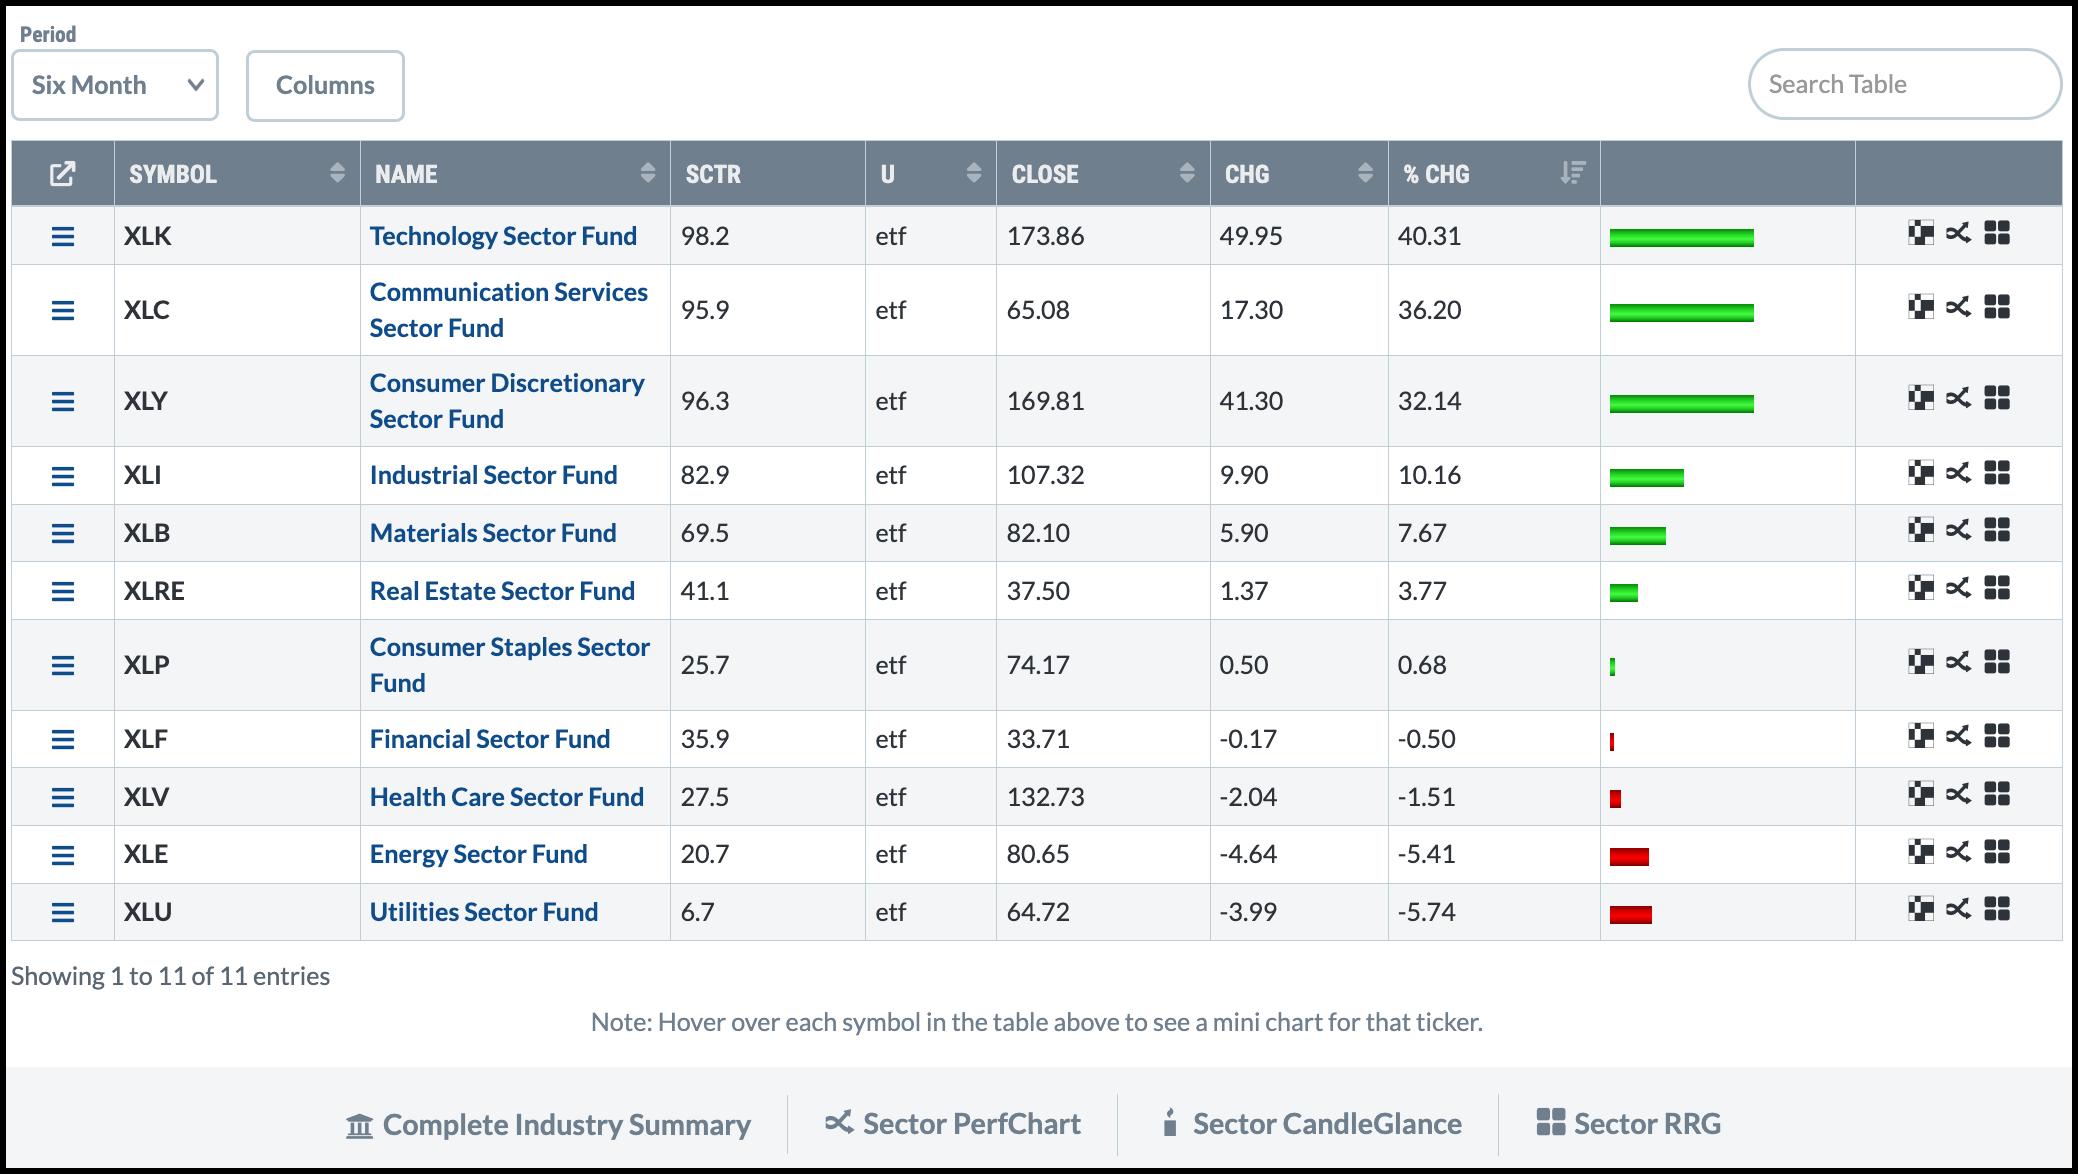
CHART 2: SECTOR SUMMARY (PAST SIX MONTHS). Technology, Communication Services, and Consumer Discretionary are the top three performing sectors. Chart source: StockCharts.com. For educational purposes only.
Bond Market Watch
But if the Fed raises interest rates a couple more times this year, does it change the economic picture? It could, which is why it may be worth watching the bond markets. An inverted yield curve can be a sign that bond investors may be worried.
What is an inverted yield curve? In a nutshell, it's when shorter-dated Treasury yields are above longer-term yields.
The difference between the 10-year Treasury yield and the 2-year Treasury yield (2/10 Treasury spread) has been below 0 since July 2022 (see chart below). The spread has almost reached the March low, which is around the time when the S&P 500 started gaining bullish momentum. When Fed Chairman Jerome Powell indicated the central bank would likely raise rates two more times this year, the 2/10 spread fell lower. And if short-term rates go higher, the spread could fall even lower.
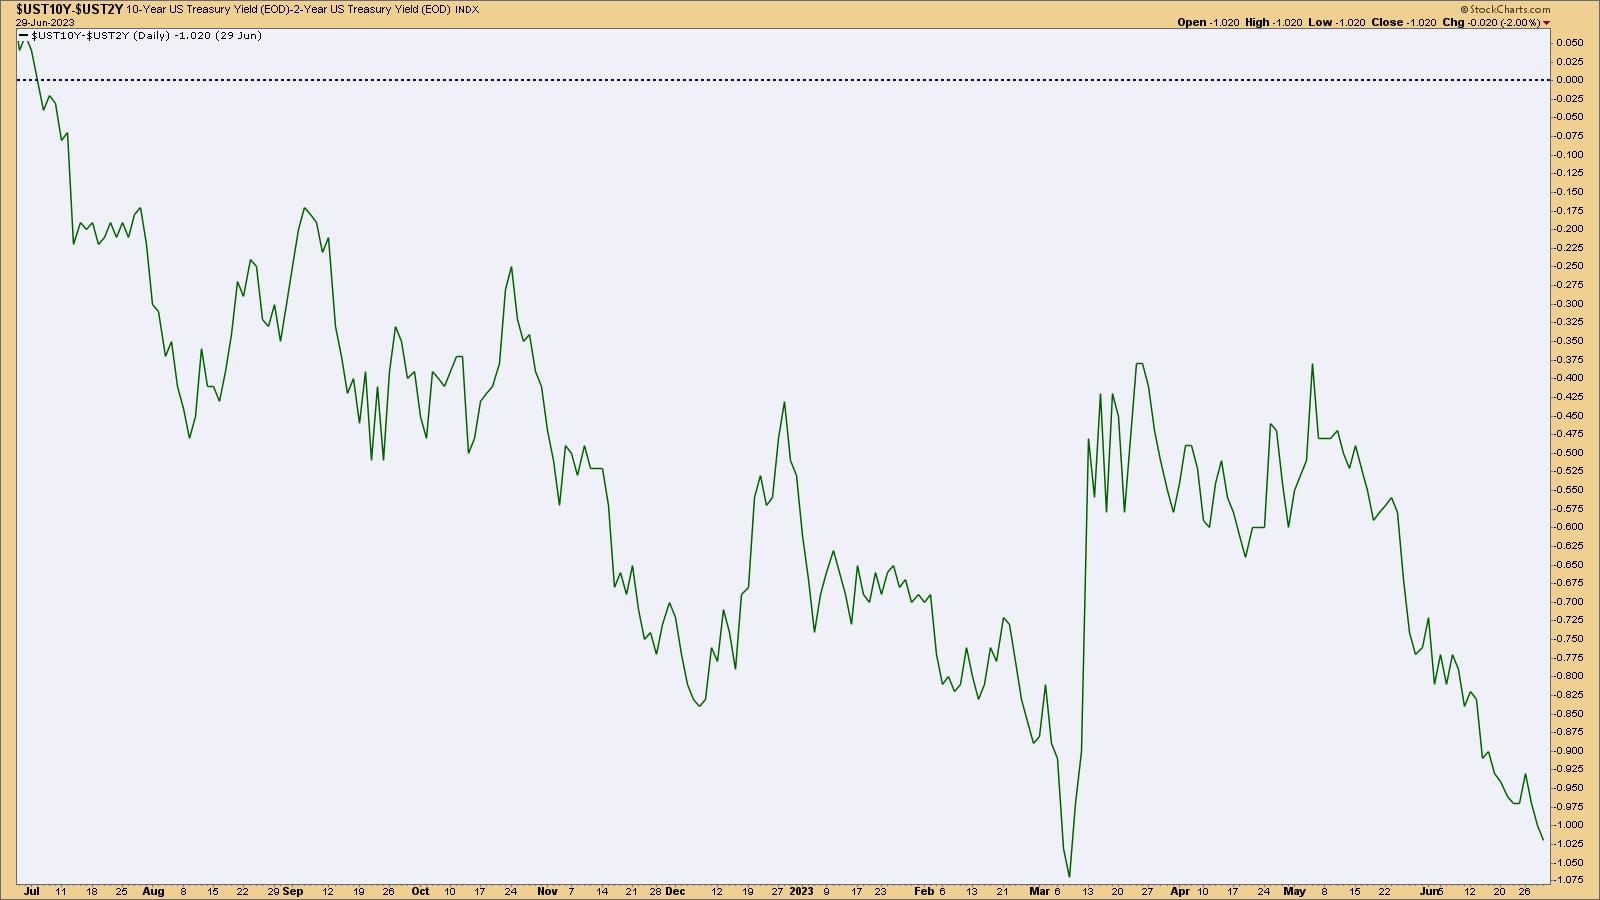
CHART 3: THE 2/10 TREASURY SPREAD. The spread between the 10 and 2-year Treasury yields is approaching March lows. You might want to keep an eye on this spread. Chart source: StockCharts.com (click on chart for live version). For educational purposes only.
Does this mean a recession is a possibility? While an inverted yield curve could mean a recession is possible, it's not guaranteed. If inflation has peaked and moves toward the Fed's 2% target, it's possible that the US may avoid a recession. It's too early to tell, and it takes a while for the effects of interest rate tightening to weave their way into the economy. Until then, keep your eyes peeled on the broader market.
Nasdaq 100 Technical Outlook
Since the Nasdaq 100 index led in performance, it's worth taking a closer look at its chart. The weekly chart of $NDX below shows that the index is close to its all-time high of just above 16,000. But before it gets there, it has to cross over its June 12 high of 15,284 (red dashed line). If it does, there may be a few more hurdles to pass. The question is, will there be enough momentum to push the NDX higher? To answer this question, it's helpful to add a momentum indicator to the chart.
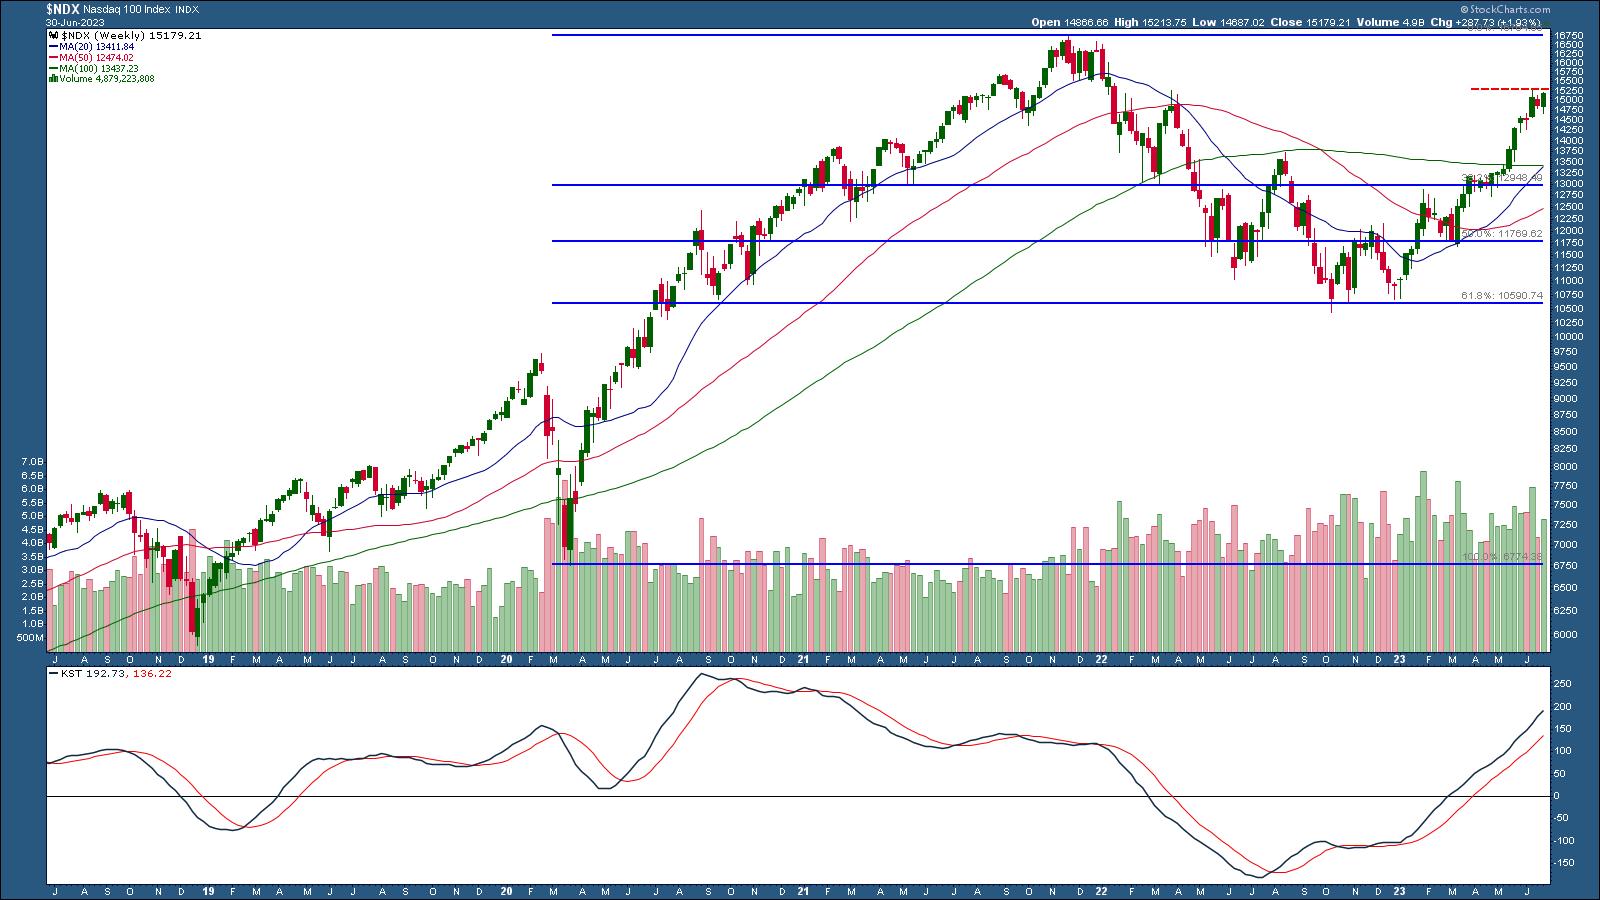
CHART 4: WEEKLY CHART OF NASDAQ 100 INDEX. NDX has a few headwinds to go through before reaching its all-time highs. Chart source: StockCharts.com (click on chart for live version). For educational purposes only.
StockCharts has a huge collection of momentum indicators to choose from. One that combines different cycles is the Know Sure Thing (KST), which is displayed in the panel below the price chart. The KST indicator is in positive territory and moving higher, which suggests that momentum is still strong. There's no sign of KST falling below its signal line on the weekly chart.
It also helps to add Fibonacci retracement levels to the chart. If NDX falls lower, the 38.2% retracement level could also be a potential support level.
But what about the daily chart?

CHART 5: DAILY CHART OF NASDAQ 100 INDEX. NDX could pull back if momentum starts to slow. Chart source: StockCharts.com (click on chart for live version). For educational purposes only.
On the daily chart, NDX has bounced off its 20-day simple moving average (SMA), but KST has crossed below its signal line. It would be worth watching this indicator since NDX could pull back to its 20-day SMA and either bounce off it or go below it.
So even though Tech stocks have been on a bullish rally, there's the risk of overvaluation. There's also the possibility of a couple interest rate hikes this year, which could deepen the yield curve inversion. So, going forward, even if equities continue to rally, it's best to keep an eye on momentum. If it starts weakening, look at other parts of the market like bonds. What's the yield curve scenario? What about commodities? Or emerging markets?

Keep an eye on the big picture by setting up Your Dashboard to include Market Overview, Sector Summary, Market Movers, and SCTR Reports.
Final Thoughts
Now that the first half of 2023 is behind us, it's a good time to do a mid-year portfolio checkup. Has your portfolio returned as much or better than a benchmark index such as the S&P 500? If not, it may be worth analyzing the different asset classes you own to identify what needs to be fixed and why. This can help you make strategic changes if necessary. Let's hope for a strong second half, but, with the markets, anything is possible. Keeping an eye on the various moving parts like momentum, the yield curve, and overall economic indicators would make you a more astute investor.
End-of-Week Wrap Up
US equity indexes up; volatility up
- $SPX up 1.23% at 4450.38, $INDU up 0.84% at 34,407.60; $COMPQ up 1.45% at 13787.92
- $VIX up at 13.59
- Best performing sector for the week: Real Estate
- Worst performing sector for the week: Consumer Staples
- Top 5 Large Cap SCTR stocks: NVDA, CCL, IOT, PLTR, MDB
On the Radar Next Week
- June ISM Manufacturing PMI
- FOMC Minutes
- May JOLTs Jobs report
- Mortgage rates
- June Nonfarm payrolls (NFPs)

Disclaimer: This blog is for educational purposes only and should not be construed as financial advice. The ideas and strategies should never be used without first assessing your own personal and financial situation, or without consulting a financial professional.
Happy charting!


