TAKEAWAYS
- Institutional interest signals end of crypto winter
- Technical indicators show strong bullish momentum in Bitcoin, but also suggest a potential near-term pullback
- Bitcoin is a speculative trade driven largely by sentiment in absence of real fundamentals

Bitcoin has been on a strong but volatile uptrend over the last seven months since hitting multi-year lows in November. But is the uptrend sustainable and robust enough to warrant an early buy?
Financial Institutions Are Betting On a Bullish Turn
Last Tuesday, there were talks that Fidelity Investments is preparing to apply for a Bitcoin exchange-traded fund (ETF) soon. If this happens, it will be the fifth company to do this, following BlackRock, which applied on June 15. Not to mention, the first leveraged Bitcoin ETF started trading this week.
Are these large financial companies noticing a change in the situation that most of us can't clearly see yet? In other words, is this the beginning of the end of the crypto ice age?
As the saying goes, it ain't over til it's over. But while you wait, there's no harm in planning a few bold moves to buy Bitcoin.
Where is Bitcoin Now?
Let's take a look at the chart and plot a couple of indicators—the 50-day and 200-day simple moving average (SMA), Rate of Change (ROC), and the Chaikin Money Flow (CMF)—to get our bearings, gauge momentum, and check the buying/selling pressure.
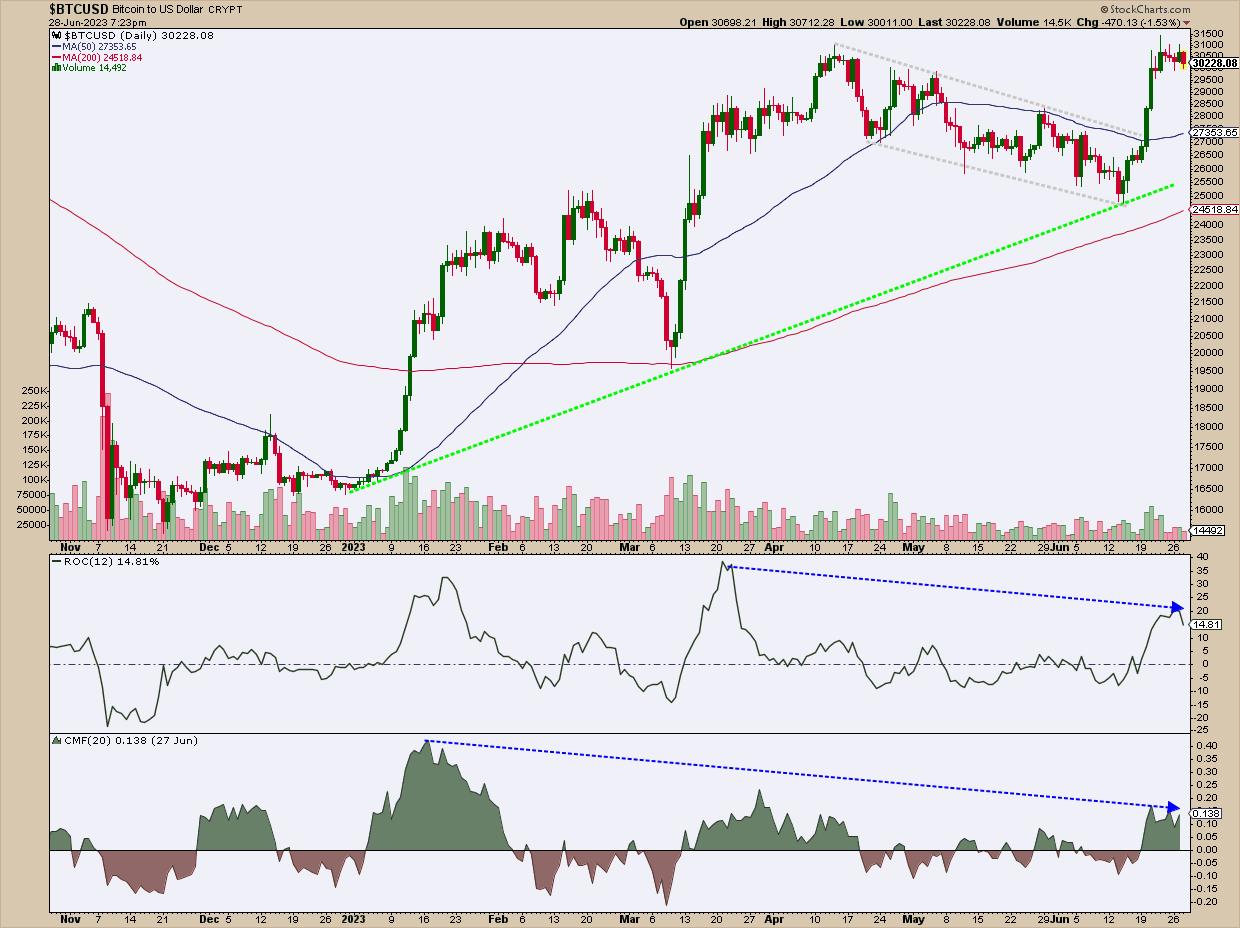
CHART 1: SPOT BITCOIN IS CHALLENGING ITS APRIL HIGHS. After breaking out of a nearly two-month downtrending channel, the crypto rose sharply in mid-June following news of increasing institutional interest in offering Bitcoin ETFs. Still, bullish conviction seems hesitant, as price meets resistance near the $31,000 range.Chart source: StockCharts.com (click chart for live version). For illustrative purposes only.
- Bitcoin ($BTCUSD) is pushing up against the $31,000 range. It broke slightly above its April highs before pulling back.
- Notice the late-June breakout from the downsloping price channel (see gray channel), a move fueled by news of large financial institutions signaling a commitment to crypto.
- The ROC reading shows a significant burst in bullish momentum coinciding with the channel breakout. While divergence in the ROC may not always be reliable, do note the divergence in price and ROC readings in March and June (both also indicating overbought levels). In short, this indicates the likelihood of a pullback.
- Checking this against the buying pressure, we also see a long period of buying pressure divergence in the Chaikin Money Flow (CMF) going as far back as January.
Still, markets can exhibit profoundly bullish (or bearish) behavior exceeding fundamental or technical justification for extended periods. And given Bitcoin bulls' optimism over the support of large financial players, it shouldn't surprise you if sentiment pushes the crypto above current highs.
But in case Bitcoin pulls back, here are a few buy levels to target if you're willing to take a position in the digital asset early in (what just might be) winter's thaw.
A Few Buy Points to Consider
Let's take a look at the chart again. Notice that there are multiple areas of potential support (meaning, potential buy points), so pardon the busy chart.
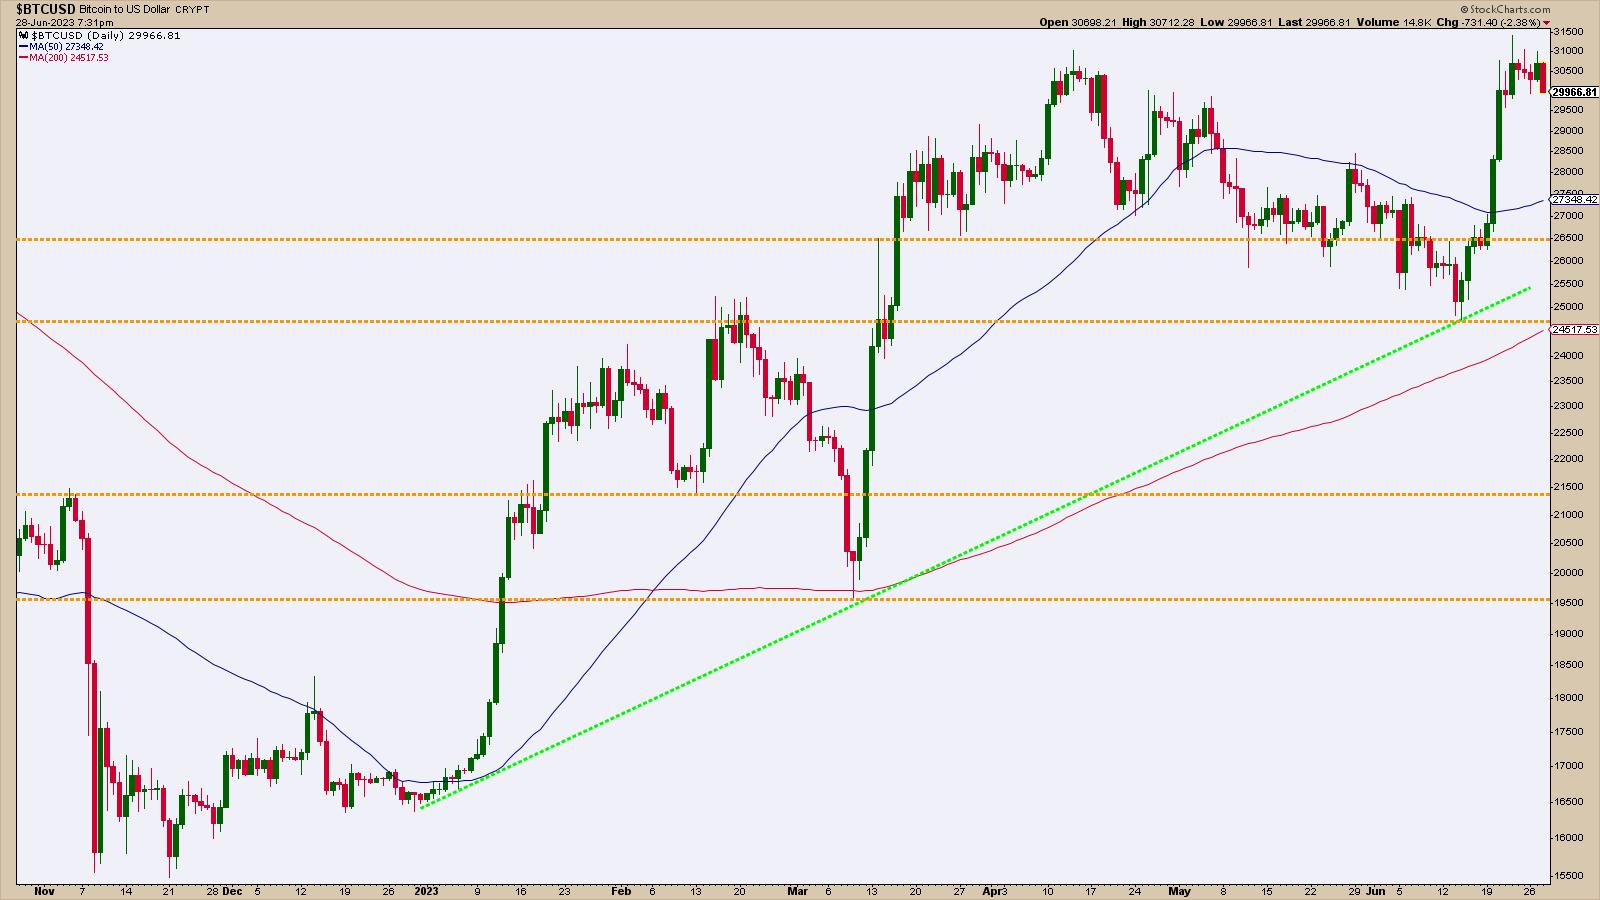
CHART 2: POTENTIAL BUY POINTS GALORE. There are plenty of potential support levels on the chart, making Bitcoin conducive to a scaling-in strategy. However, before scaling in, you have to figure out at what level might a bullish perspective no longer be valid.Chart source: StockCharts.com (click chart for live version). For illustrative purposes only.
The first line of defense for bulls waiting to get in is the 50-day SMA, currently at 27,354 and rising, This is a commonly-viewed support level, but notice that it leaves very little room for much of a pullback.
Below this line is a market-based support range near 26,500. This support level saw a heavy amount of trading activity, serving most recently as a congestion area from which the market eventually broke down, leading to the next level of support.
The area below 25,000 marks the most recent swing low and aligns with February highs, essentially resistance that became support. Note that this support area also sees the third touch of a rising (green) trendline that some traders might be eyeing as a potential springboard. And if that wasn't enough, the rising 200-day SMA, currently under 25,00, has also entered this potential support range.
Now, depending on broader fundamental developments, and as strong as these levels appear, they can still fail. If they do, and price falls below this range, you can look forward to support at 21,500 and 19,500, both historical support levels (with the former also aligning with the November 2022 high or resistance turned support).
Managing Downside Risk
The buy levels are, indeed, far and wide. Depending on your bullishness and risk tolerance, you might consider scaling in at different levels.
The tricky thing, as always, is figuring out when and where your long bias may no longer be valid. This is all predicated on how the end of the crypto winter and institutional buying (and, to a lesser degree, retail market sentiment) will play a role in determining the turn in season.
It's More of a Trade Than an Investment ... For Now
And given the lack of fundamentals for Bitcoin as an alternative and widely-adopted currency (simply, because it isn't ... at least not yet), you're wagering on sentiment toward the crypto as a speculative asset. In short, this is more a "trade" than an "investment," so be careful.
The Bottom Line
Bitcoin has shown significant growth and has sparked interest, especially since financial giants like Fidelity and BlackRock have joined the ETF bandwagon. This movement could signal a warming trend in the crypto market—or not. Remember, Bitcoin is more of a speculative trade than an investment (in the traditional sense). But you probably already knew that. As always, exercise caution and diligent analysis, as both are key in navigating the crypto landscape.

Disclaimer: This blog is for educational purposes only and should not be construed as financial advice. The ideas and strategies should never be used without first assessing your own personal and financial situation, or without consulting a financial professional.
Happy charting!


