TAKEAWAYS
- S&P 500 and Nasdaq Composite close at record highs
- Equities, precious metals, and bonds all rise, but Bitcoin shows weakness
- Keep an eye on the Equal Weighted S&P 500 and Nasdaq breadth to get early insight into stock market direction.
If you were taking time off from the stock market, since it wasn't doing much in the last week or so, you're in for a nice surprise.
July is considered a good month for stocks, and the first trading week of the month, albeit short, didn't indicate otherwise. It may have been a short trading week, but a lot happened—ECB forum, Fed minutes, PMI data, a new UK Prime Minister, and the June jobs report—to help push the equity market out of its doldrums.
The S&P 500 ($SPX) and Nasdaq Composite ($COMPQ) have broken out of their sideways move and show directional bias toward the upside. Precious metals, i.e. gold ($GOLD) and silver ($SILVER), are moving higher after a pullback. Crude oil prices are consolidating after rising for about a month. The US Dollar Index ($USD) has pulled back and is trading close to a support level.
Looking at the daily chart of the S&P 500 and Nasdaq Composite below, you see a candlestick pattern resembling the three white soldiers. This is an indication that buying pressure remains strong.
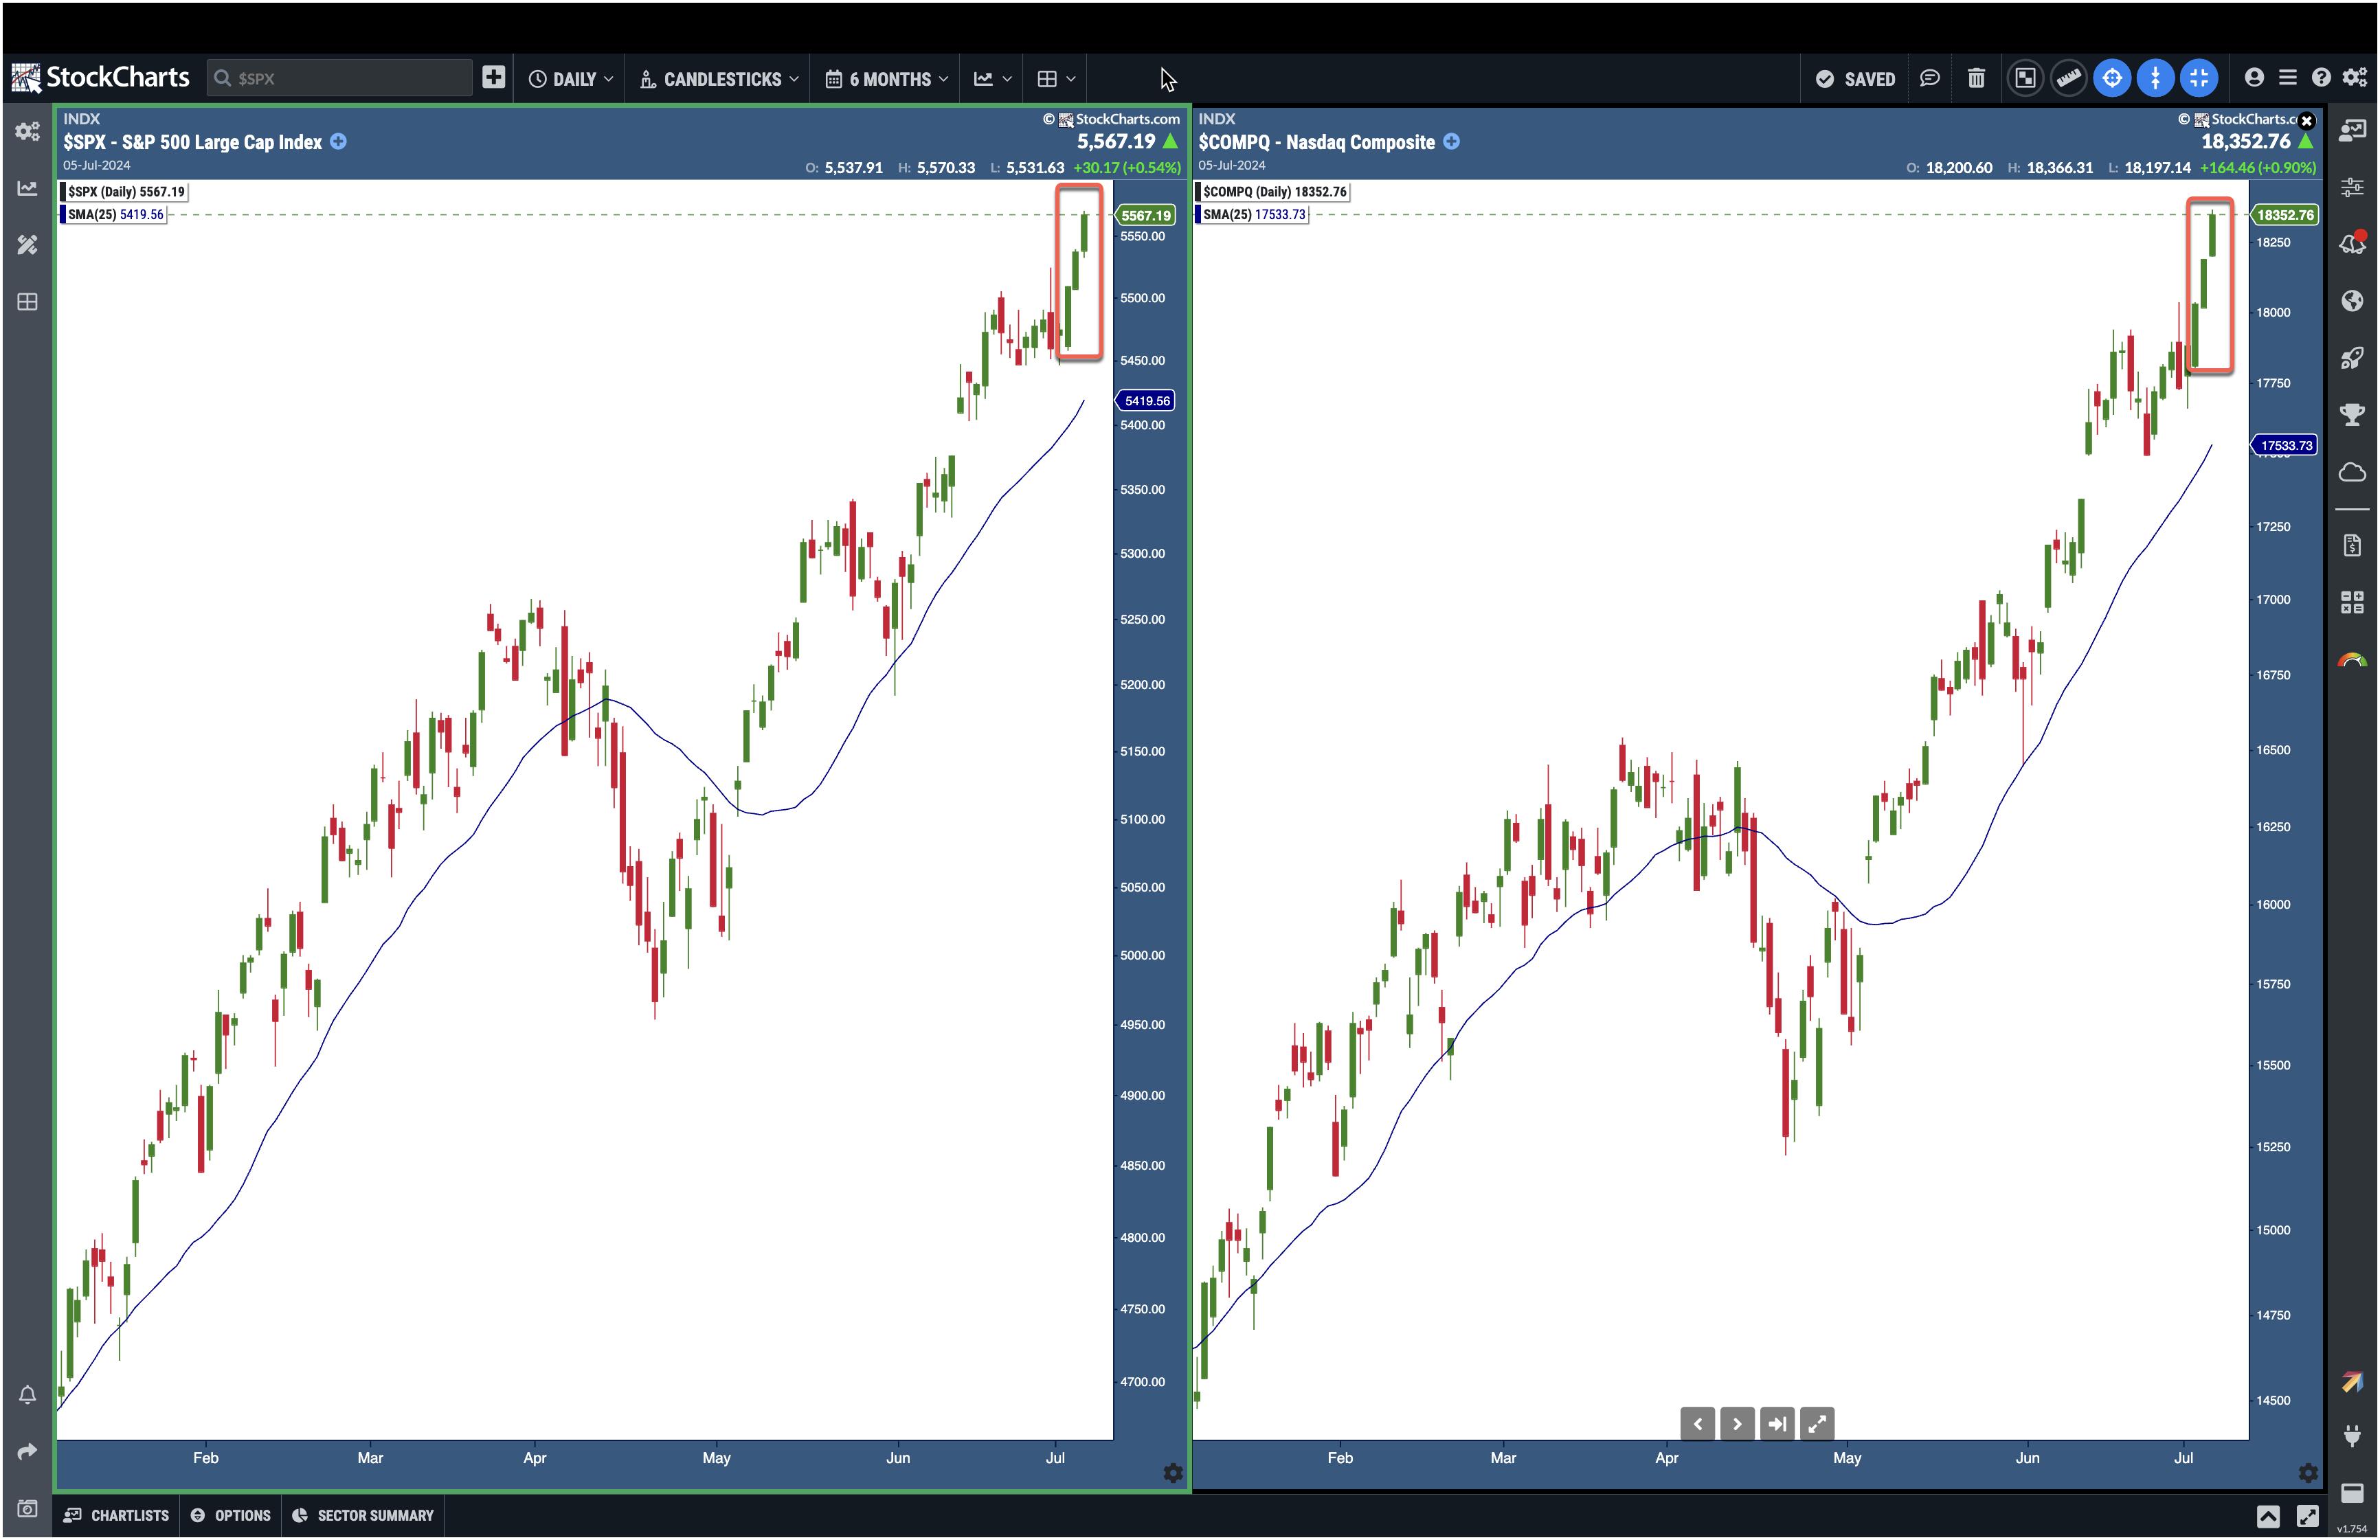
CHART 1. BULLISH CHART PATTERN IN THE S&P 500 AND NASDAQ COMPOSITE. The indexes broke out of their sideways move and continued rising. A follow-through next week would mean further upside.Chart source: StockChartsACP. For educational purposes.
NVDA Still Strong
There was some concern that the broader market, especially technology stocks, would pull back after NVDIA's stock price. But if you look at the daily chart of NVDA stock below, it's trading well above its 50-day simple moving average (SMA).
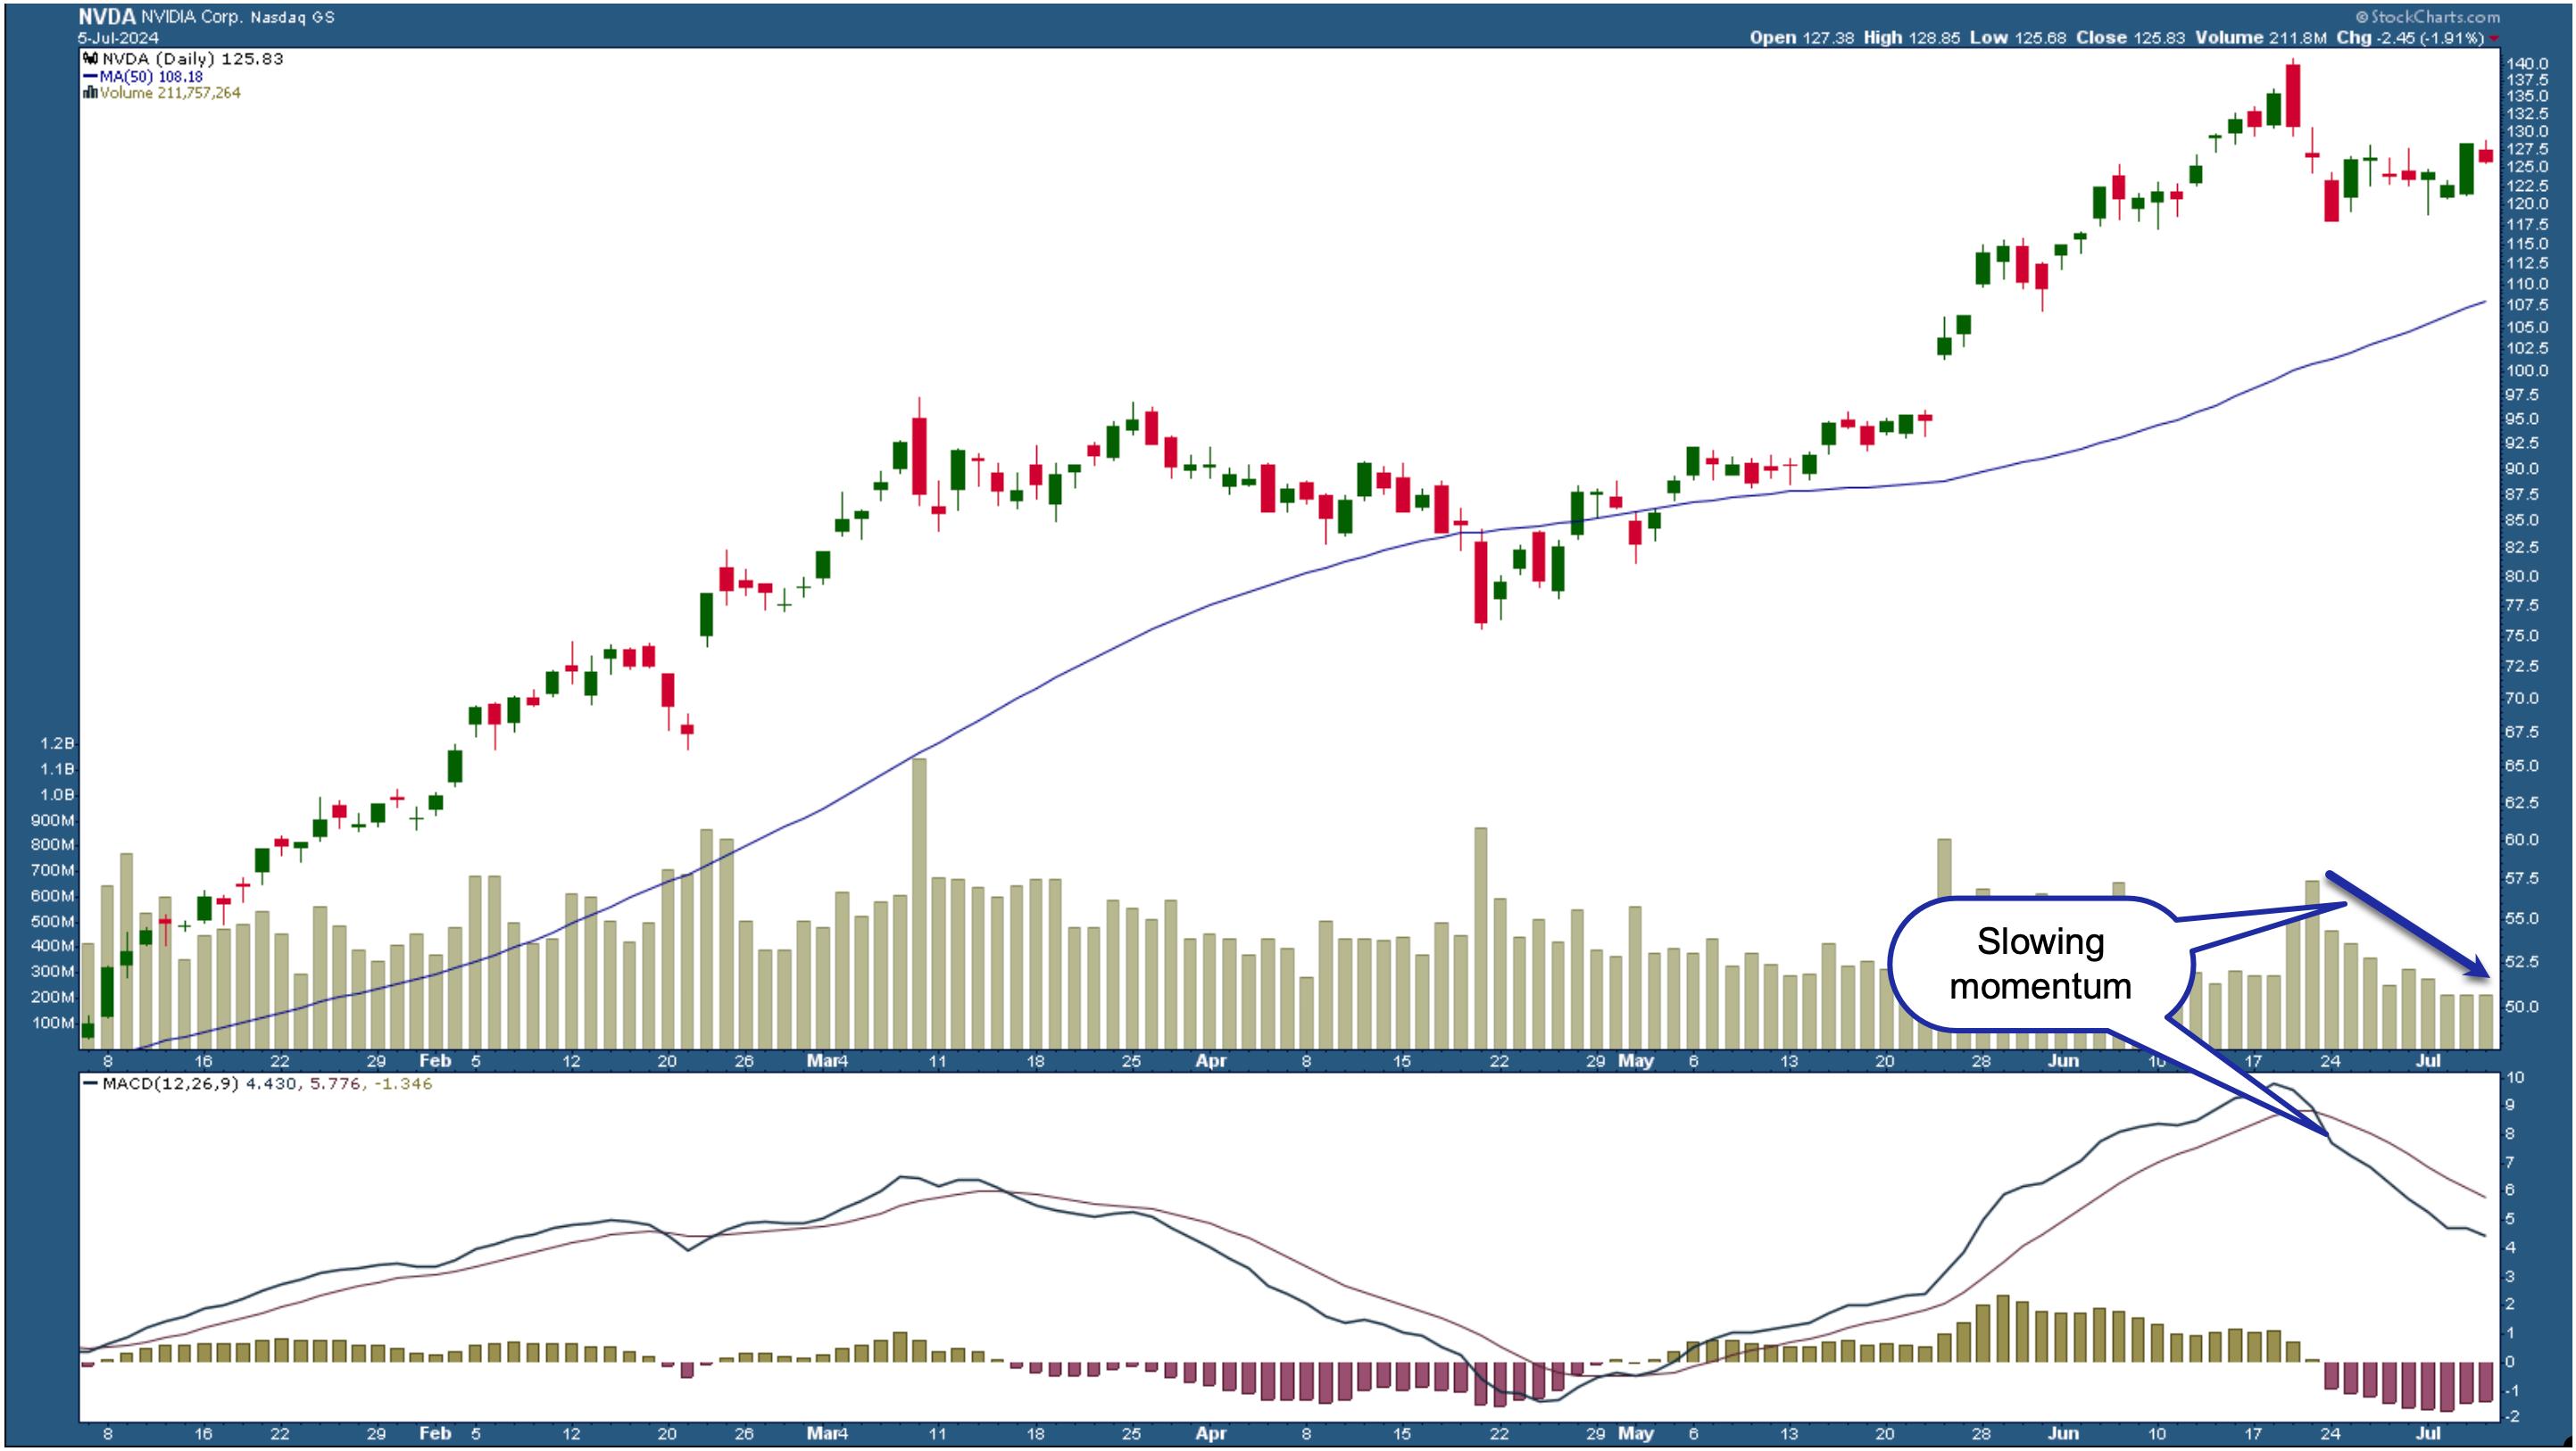
CHART 2. DAILY CHART OF NVDA STOCK. Even though NVDA's stock price pulled back, the overall trend is still up. However, momentum is slowing. This could change next week and is worth watching. Chart source: StockCharts.com. For educational purposes.
The overall trend is up, but that doesn't mean NVDA's stock price will hit new highs soon. If you look at the moving average convergence/divergence (MACD) indicator, the MACD line has crossed below the signal line and is trending lower. Volume also has declined. Both these indicators suggest that momentum is slowing. This type of price action is typical of a holiday weekend and shortened trading week, so it may not be an accurate representation. If there's continued follow-through next week, it would be a more confirming signal.
Bitcoin: The Weak Link
While equities are trending higher, Bitcoin is facing headwinds. Investors are still coming to grips with Mt. Gox's collapse and the news that it'll repay its creditors $8.5 billion in crypto. This would mean those who receive coins in their crypto wallets will probably liquidate them, causing Bitcoin prices to fall further.
Looking at the daily chart of Bitcoin to US Dollar ($BTCUSD), it's trading at its February levels. It's also bouncing off the 38.2% Fibonacci retracement level (based on the September 2023 lows to March 2024 high).
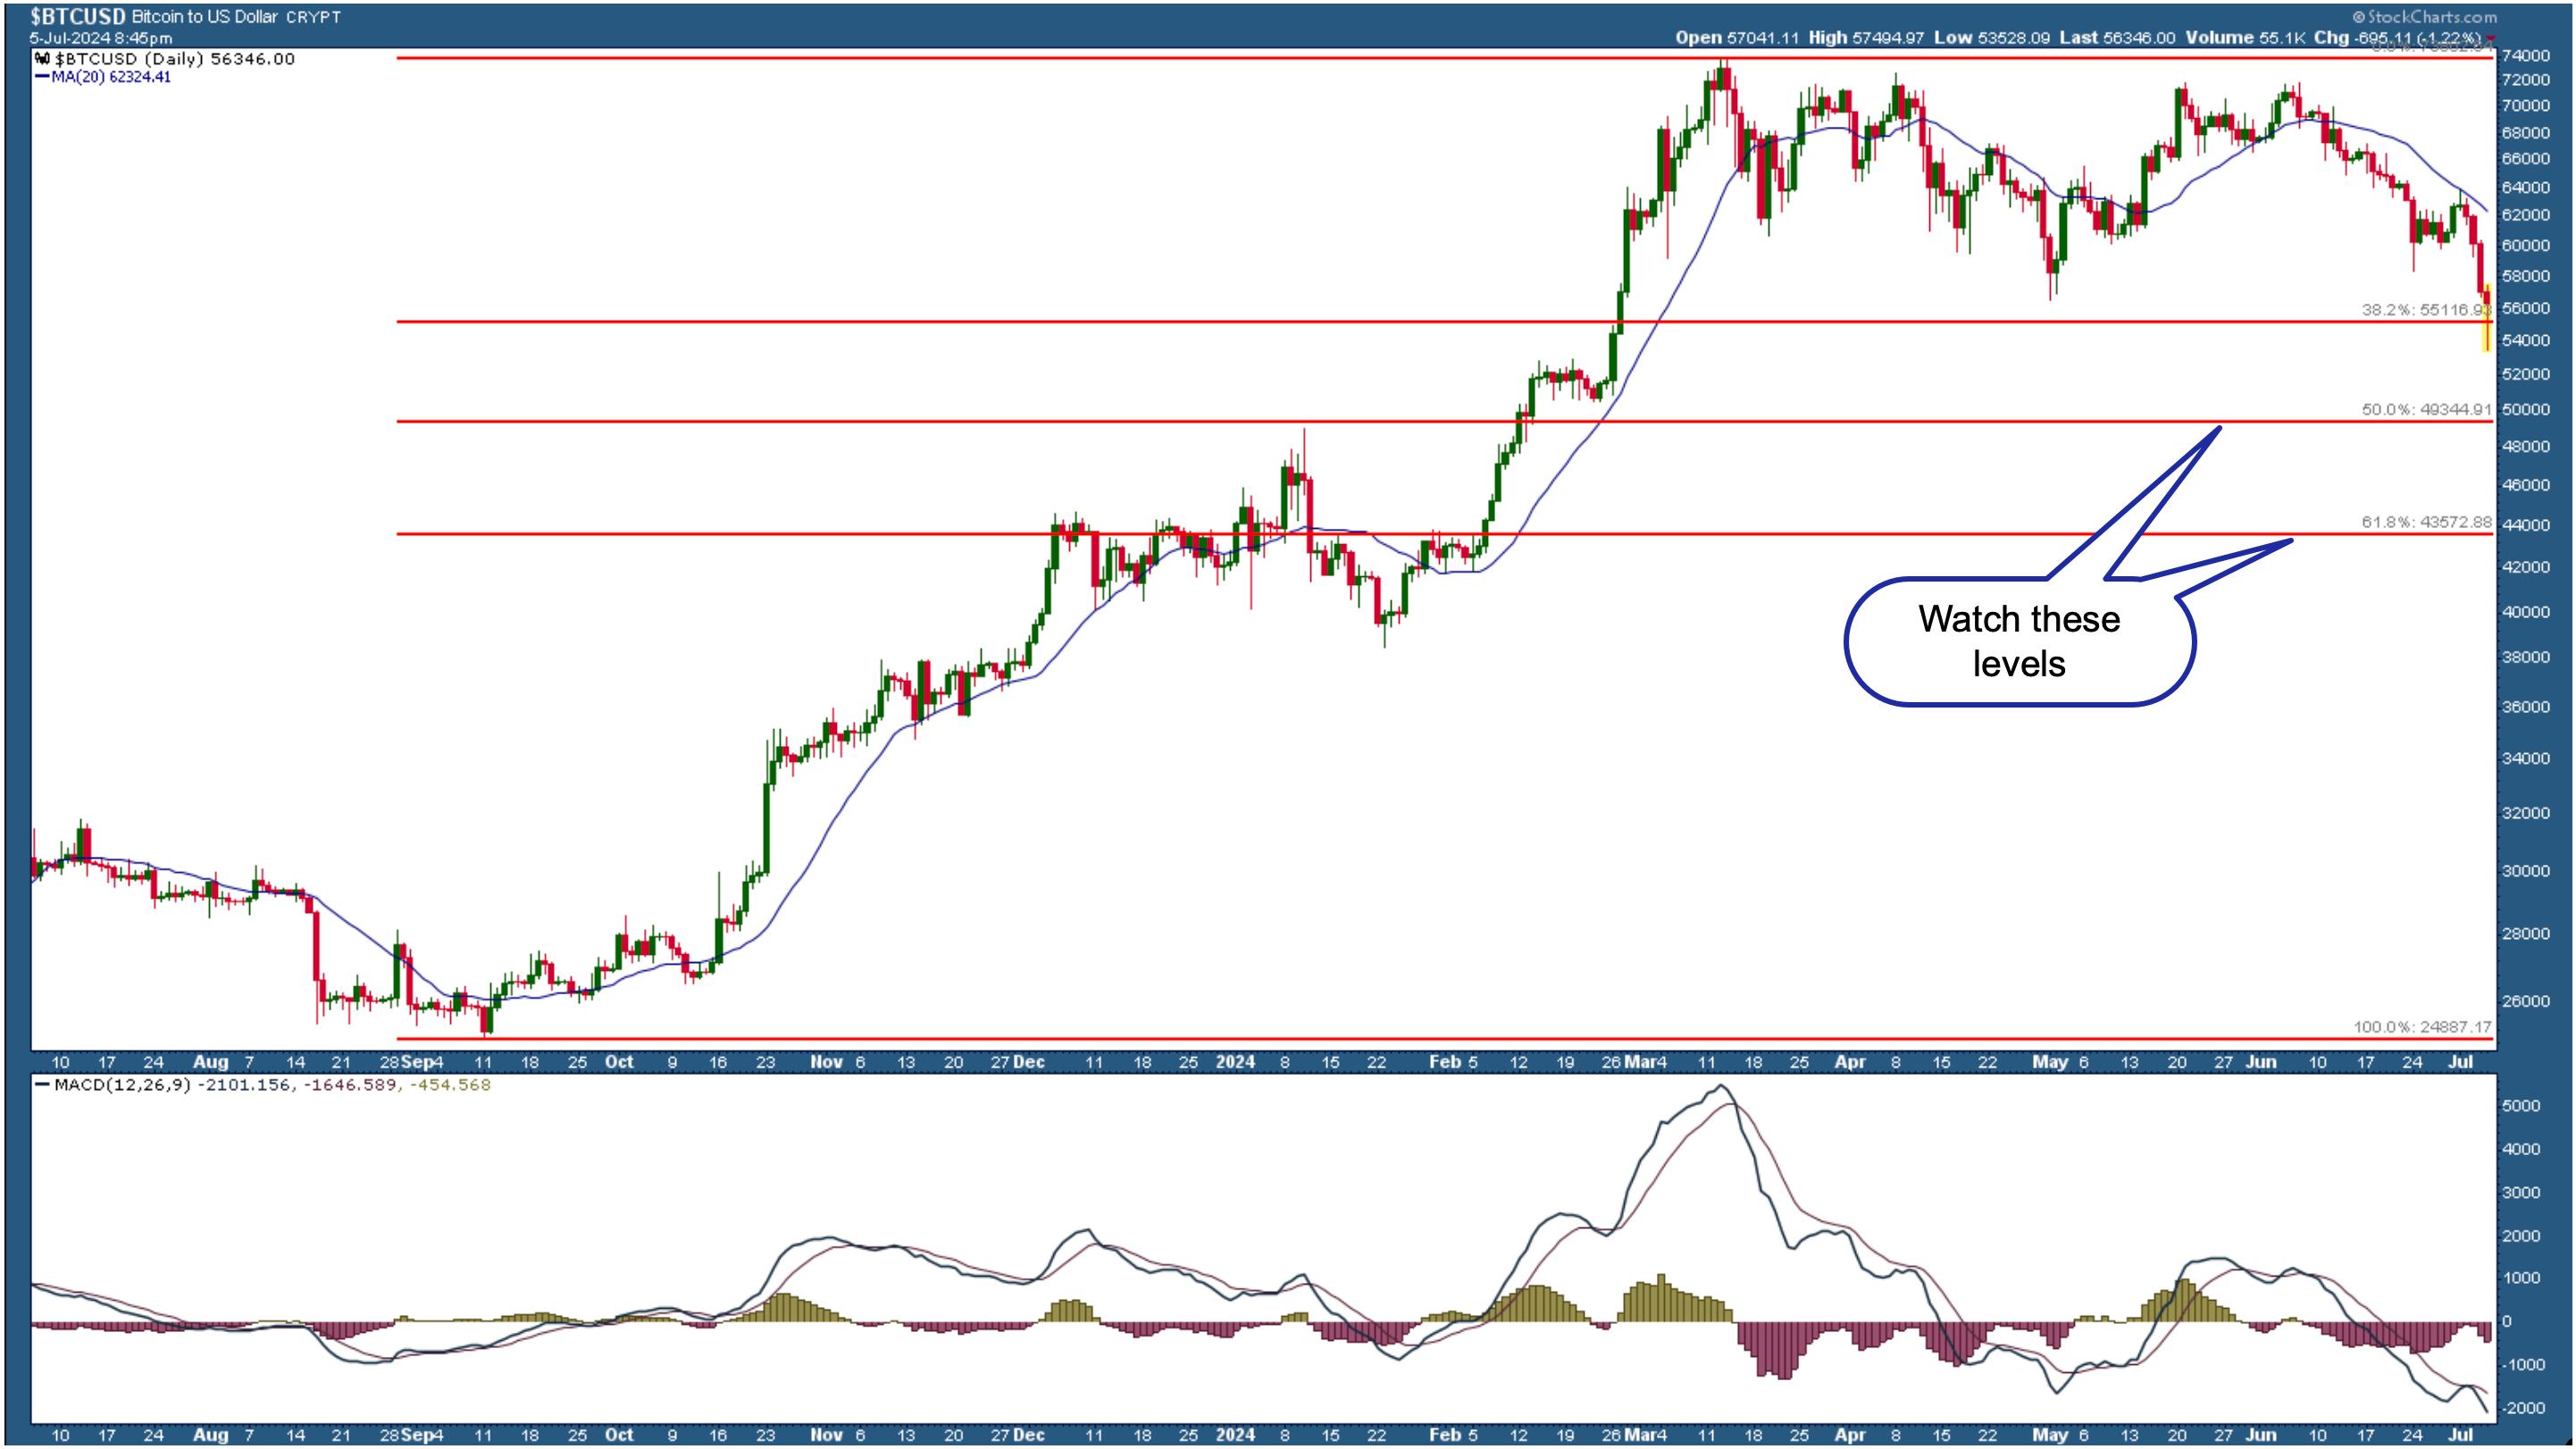
CHART 3. DAILY CHART OF BITCOIN TO US DOLLAR. Bitcoin is trading at its February 2024 levels. Price could fall lower and hit the 50% and 61.8% Fibonacci retracement levels.Chart source: StockCharts.com. For educational purposes.
The MACD in the lower panel shows the cryptocurrency is losing momentum. If the weak momentum continues, Bitcoin could go as low as its 50% and 61.8% Fibonacci retracement levels. Keep an eye on these levels!
Bonds Prices On the Move
Treasury yields fell after a slightly cooler June jobs report. This increased bond prices (interest rates and bond prices move in opposite directions), a welcome reversal after the sharp July 1 decline. This price action can be seen in the iShares 20+ Year Treasury Bond ETF (TLT).
The chart below shows TLT coming close to breaking below a strong support level. That TLT has bounced off this support level and reversed, which is an indication of the high probability of a Fed interest rate cut by this year.
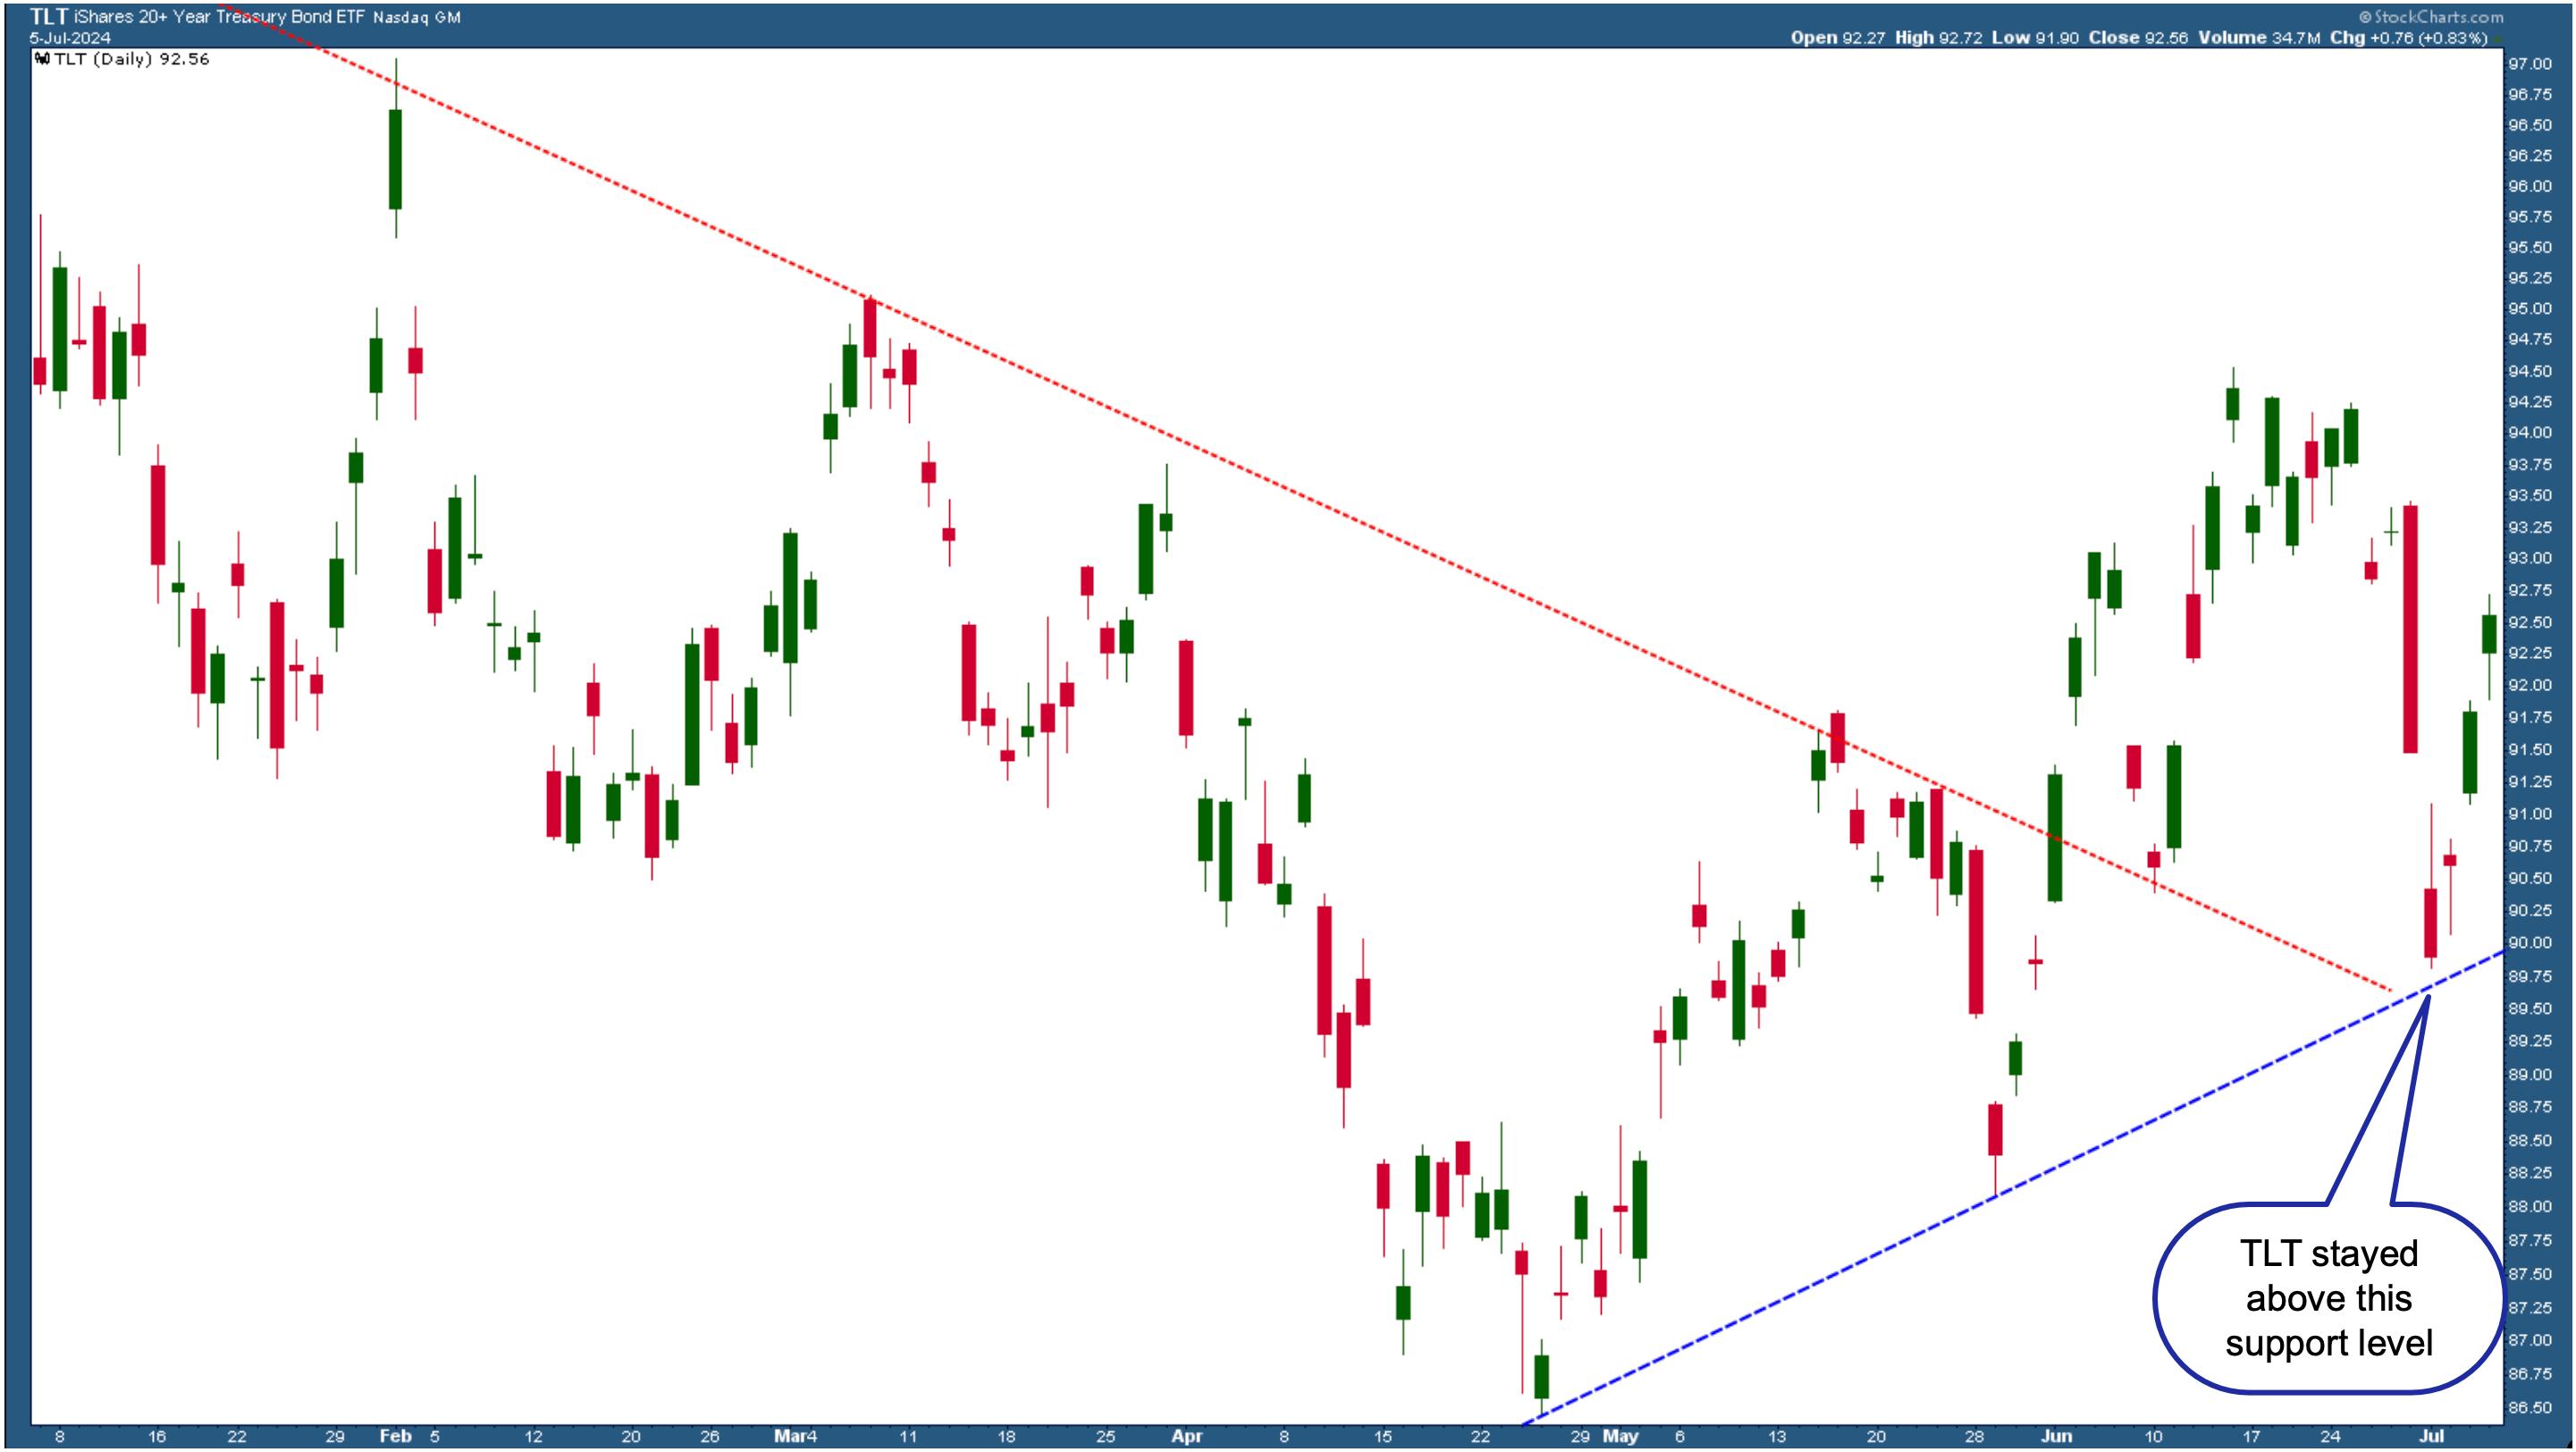
CHART 4. DAILY CHART OF ISHARES 20+ YEAR TREASURY BOND ETF (TLT). TLT held on to the support of the blue-dashed trendline and reversed.Chart source: StockCharts.com. For educational purposes.
If next week's June CPI and PPI data suggest inflation continues to cool, interest rate cuts become more likely. Treasury yields could fall further, which means bond prices will rise.
According to the CME FedWatch Tool, the probability of a September interest rate cut sits at around 70%, as of this writing.
Stocks will likely get a boost from the increased probability of an interest rate cut in the September Fed meeting. Next week's inflation data and Fed Chairman Powell's statement could impact the stock market's direction. There are some areas investors should watch.
Add the following two charts to your StockCharts ChartLists.
One shows the divergence between the price action in the Nasdaq Composite and its Advance-Decline line. The other shows the S&P 500 Equal Weighted Index in a consolidation pattern. The direction of these charts could give you a heads-up on the overall stock market direction.
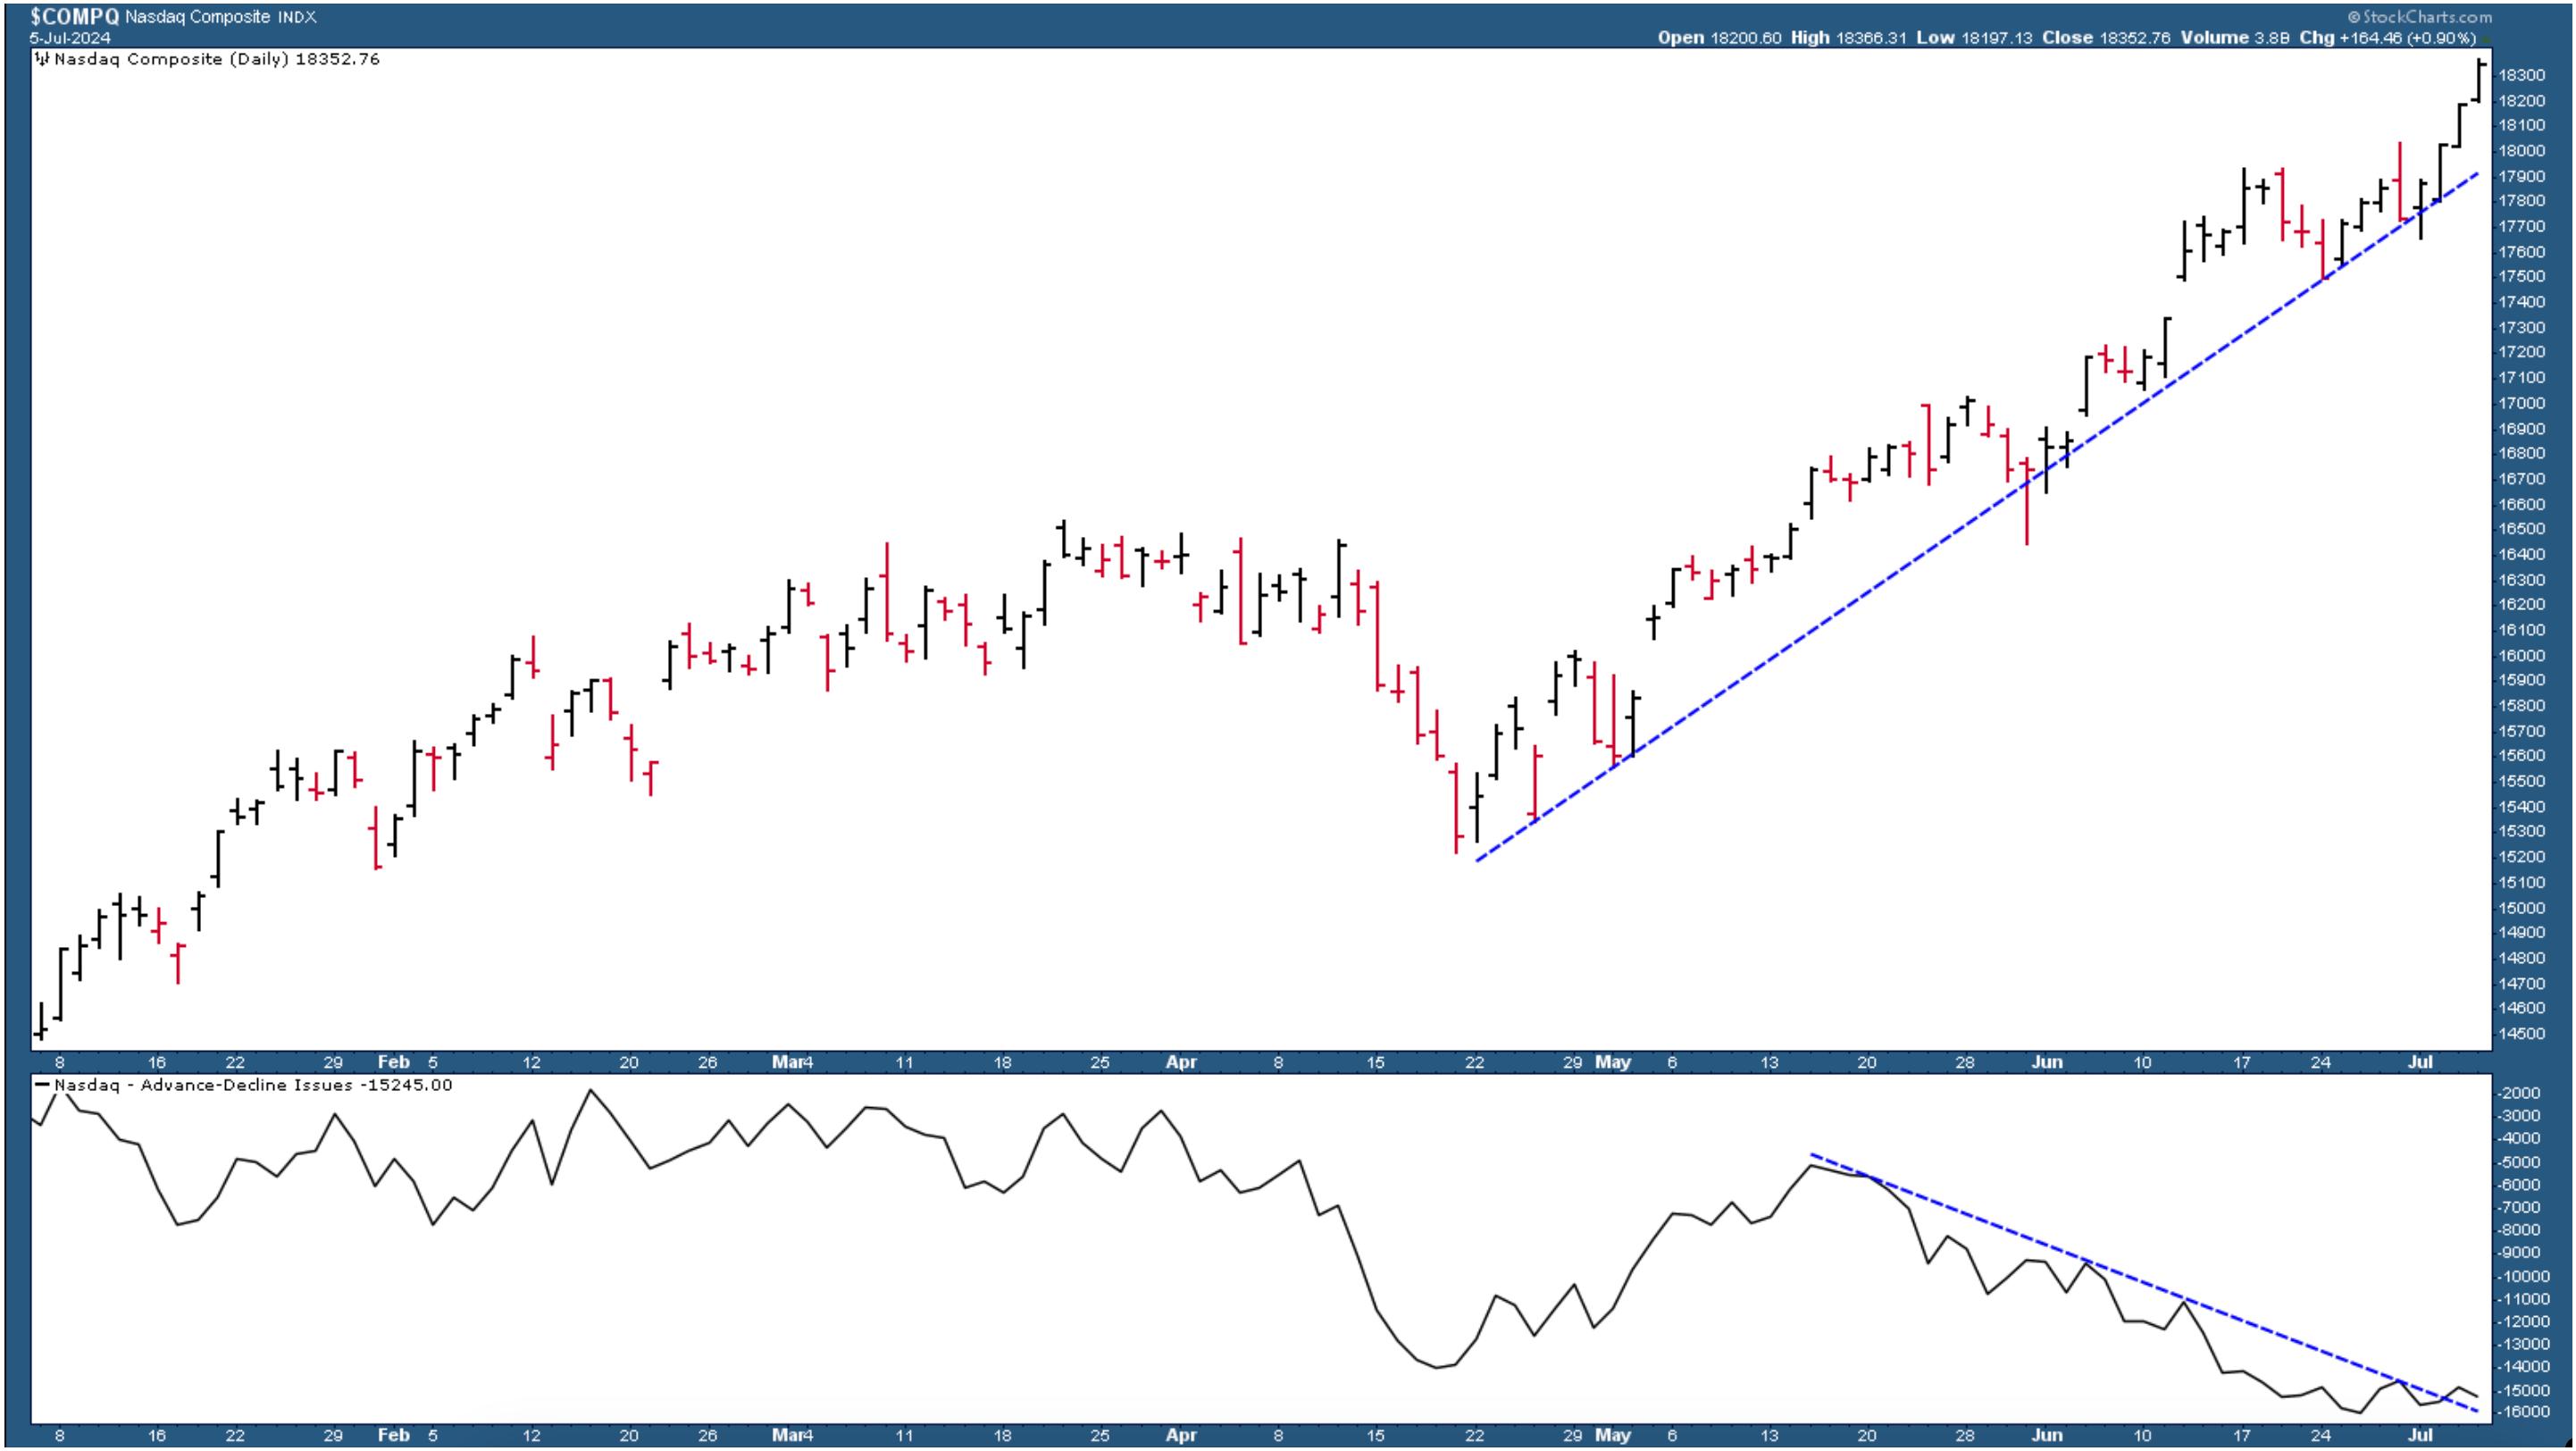
CHART 5. NASDAQ DIVERGES FROM ADVANCE-DECLINE ISSUES LINE.
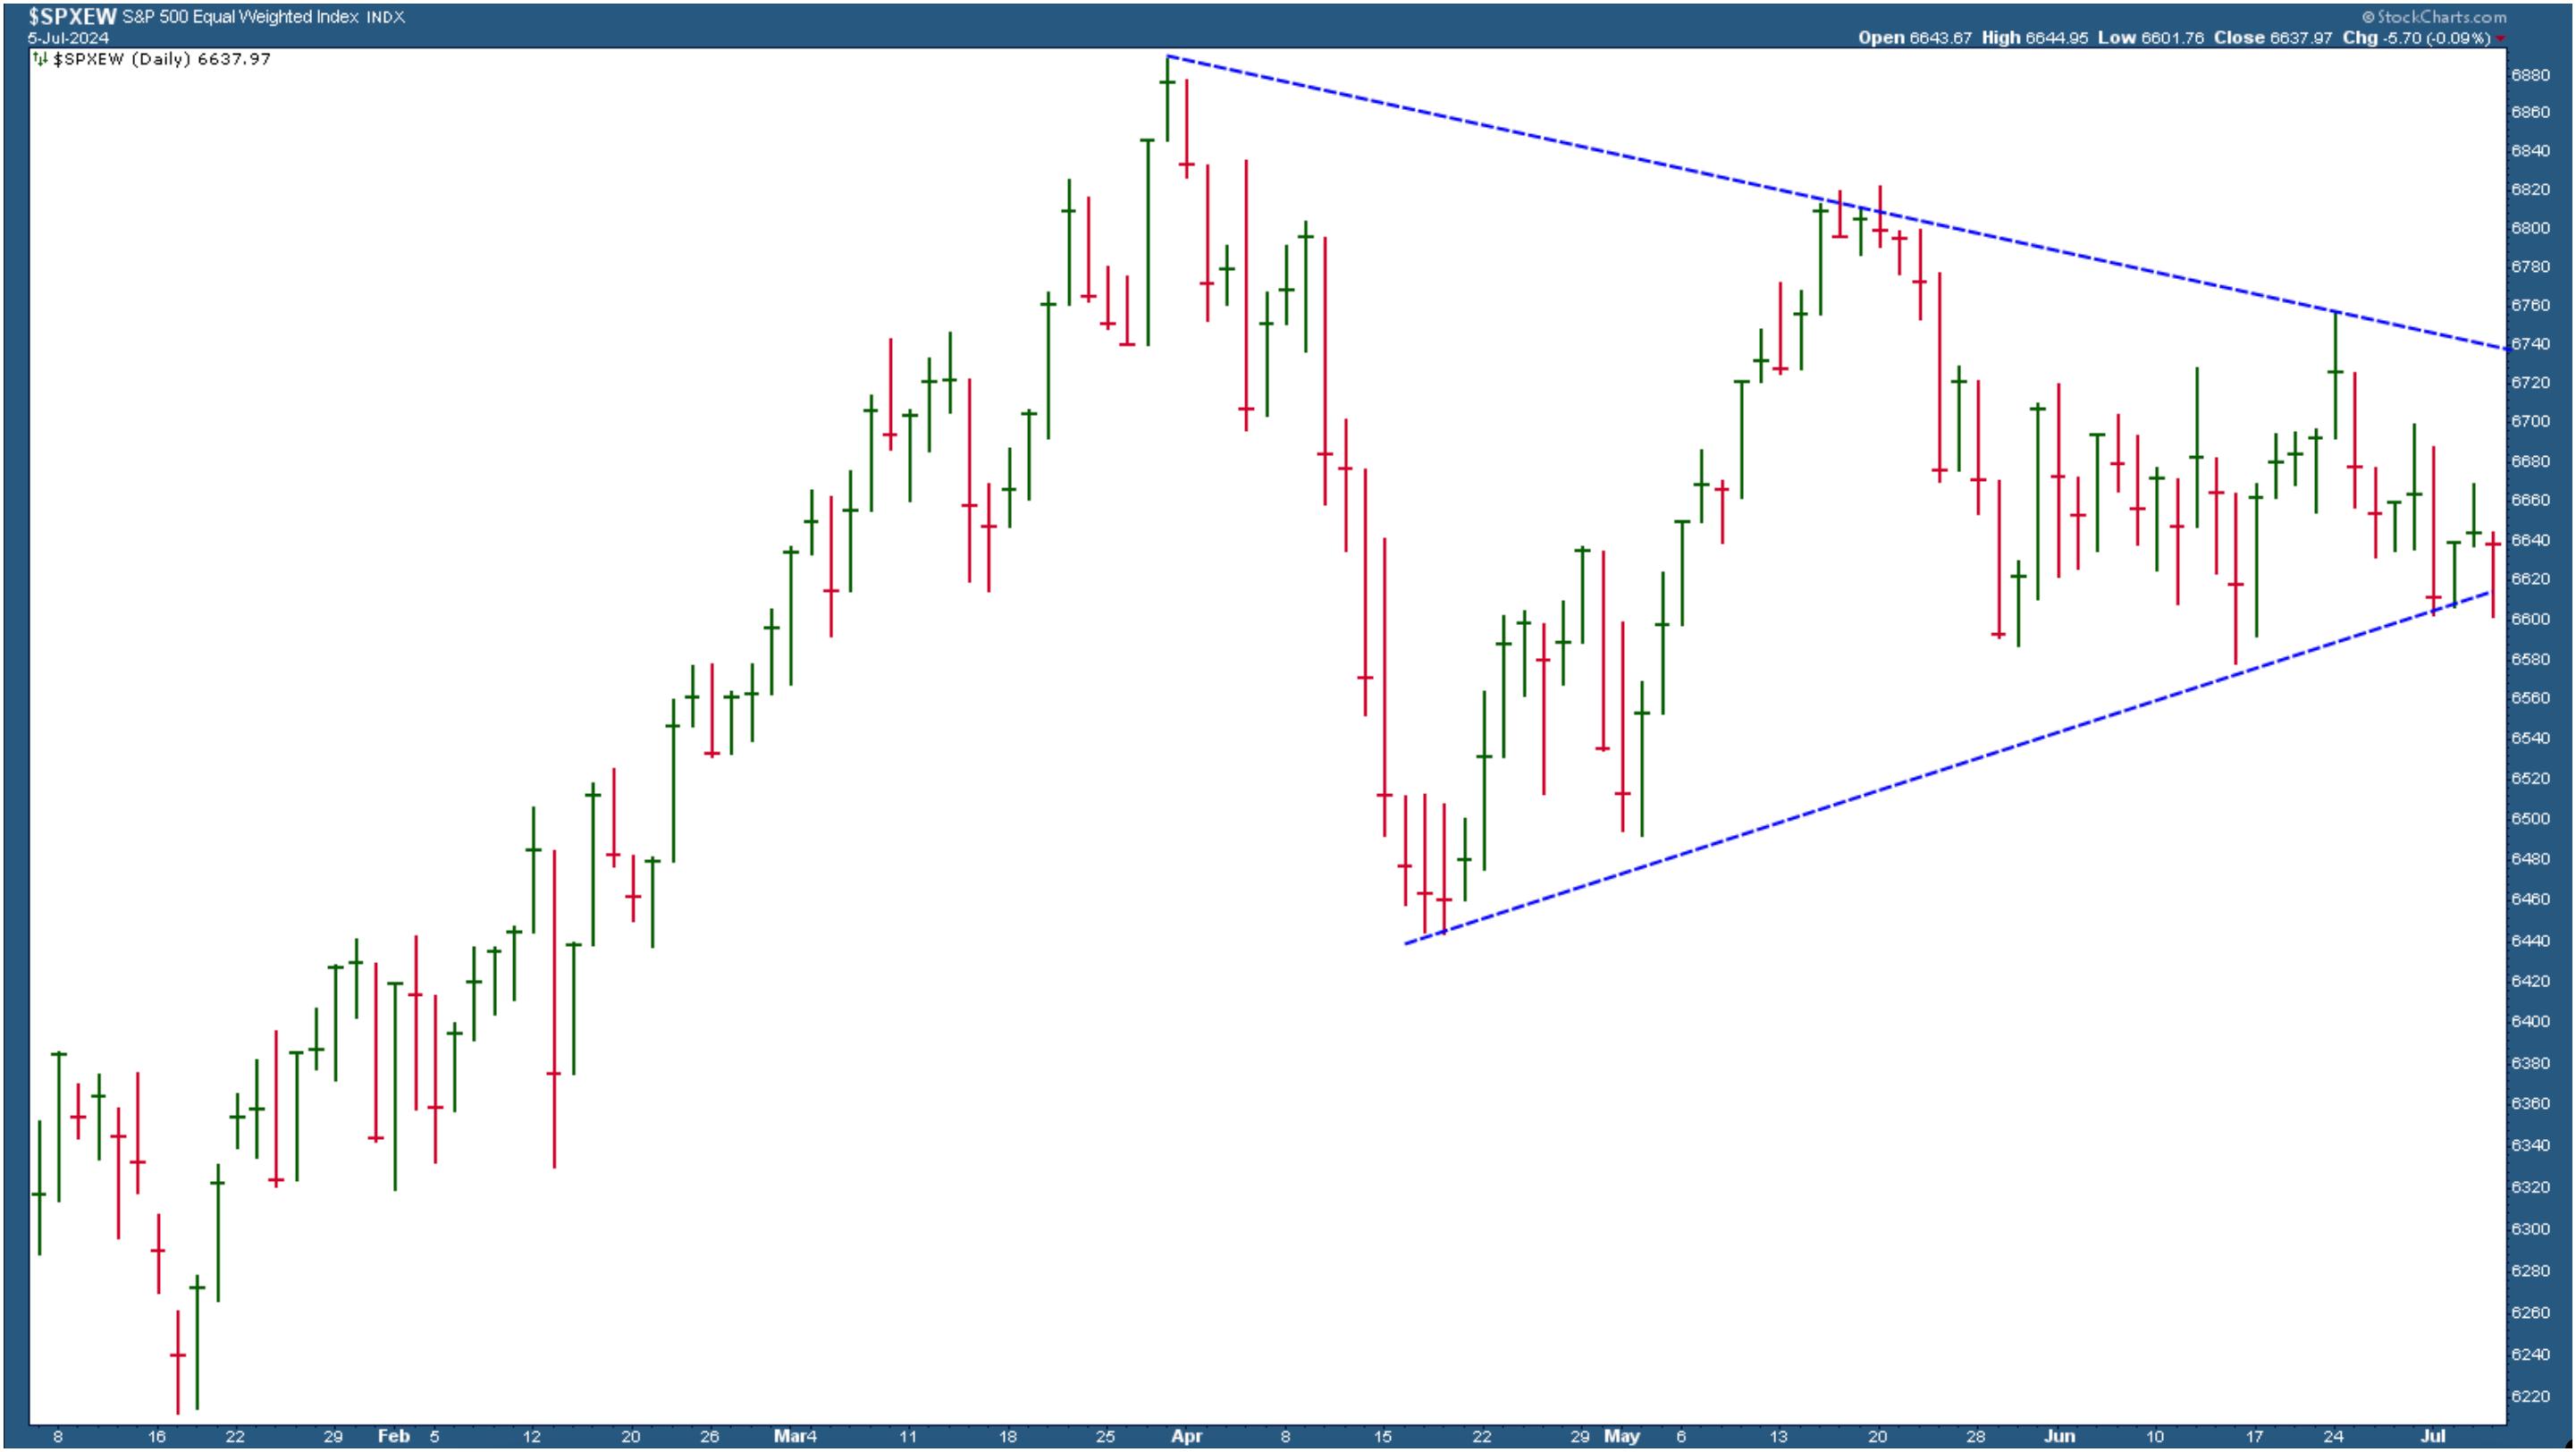
CHART 6. THE S&P 500 EQUAL WEIGHTED INDEX IS CONSOLIDATING.
End-of-Week Wrap-Up
- S&P 500 closed up 1.95% for the week, at 5567.19; Dow Jones Industrial Average up 0.66% for the week at 39,375.87; Nasdaq Composite closed up 3.5% for the week at 18,352.76
- $VIX up 0.32% for the week closing at 12.48
- Best performing sector for the week: Consumer Discretionary
- Worst performing sector for the week: Energy
- Top 5 Large Cap SCTR stocks: NVIDIA (NVDA); Super Micro Computer, Inc. (SMCI); Vistra Energy (VST); Applovin Corp (APP); Taiwan Semiconductor Mfg. (TSM)
On the Radar Next Week

- June CPI
- June PPI
- Fed Chair Powell Testimony
- Treasury Secretary Yellen Testimony
- Fed speeches from Barr, Powell, Goolsbee, and Bostic
Disclaimer: This blog is for educational purposes only and should not be construed as financial advice. The ideas and strategies should never be used without first assessing your own personal and financial situation, or without consulting a financial professional.
Happy charting!


