TAKEAWAYS
- The leading sector today was the Financials, followed by Health Care and Utilities.
- Technology stocks sold off significantly and was the worst sector performer.
- With interest rate cuts expected in the next FOMC meeting, financial stocks have the potential to rise further.
Today's MarketCarpet was a sea of red with just a few dabs of green. Financials took the lead, followed by Health Care and Utilities.
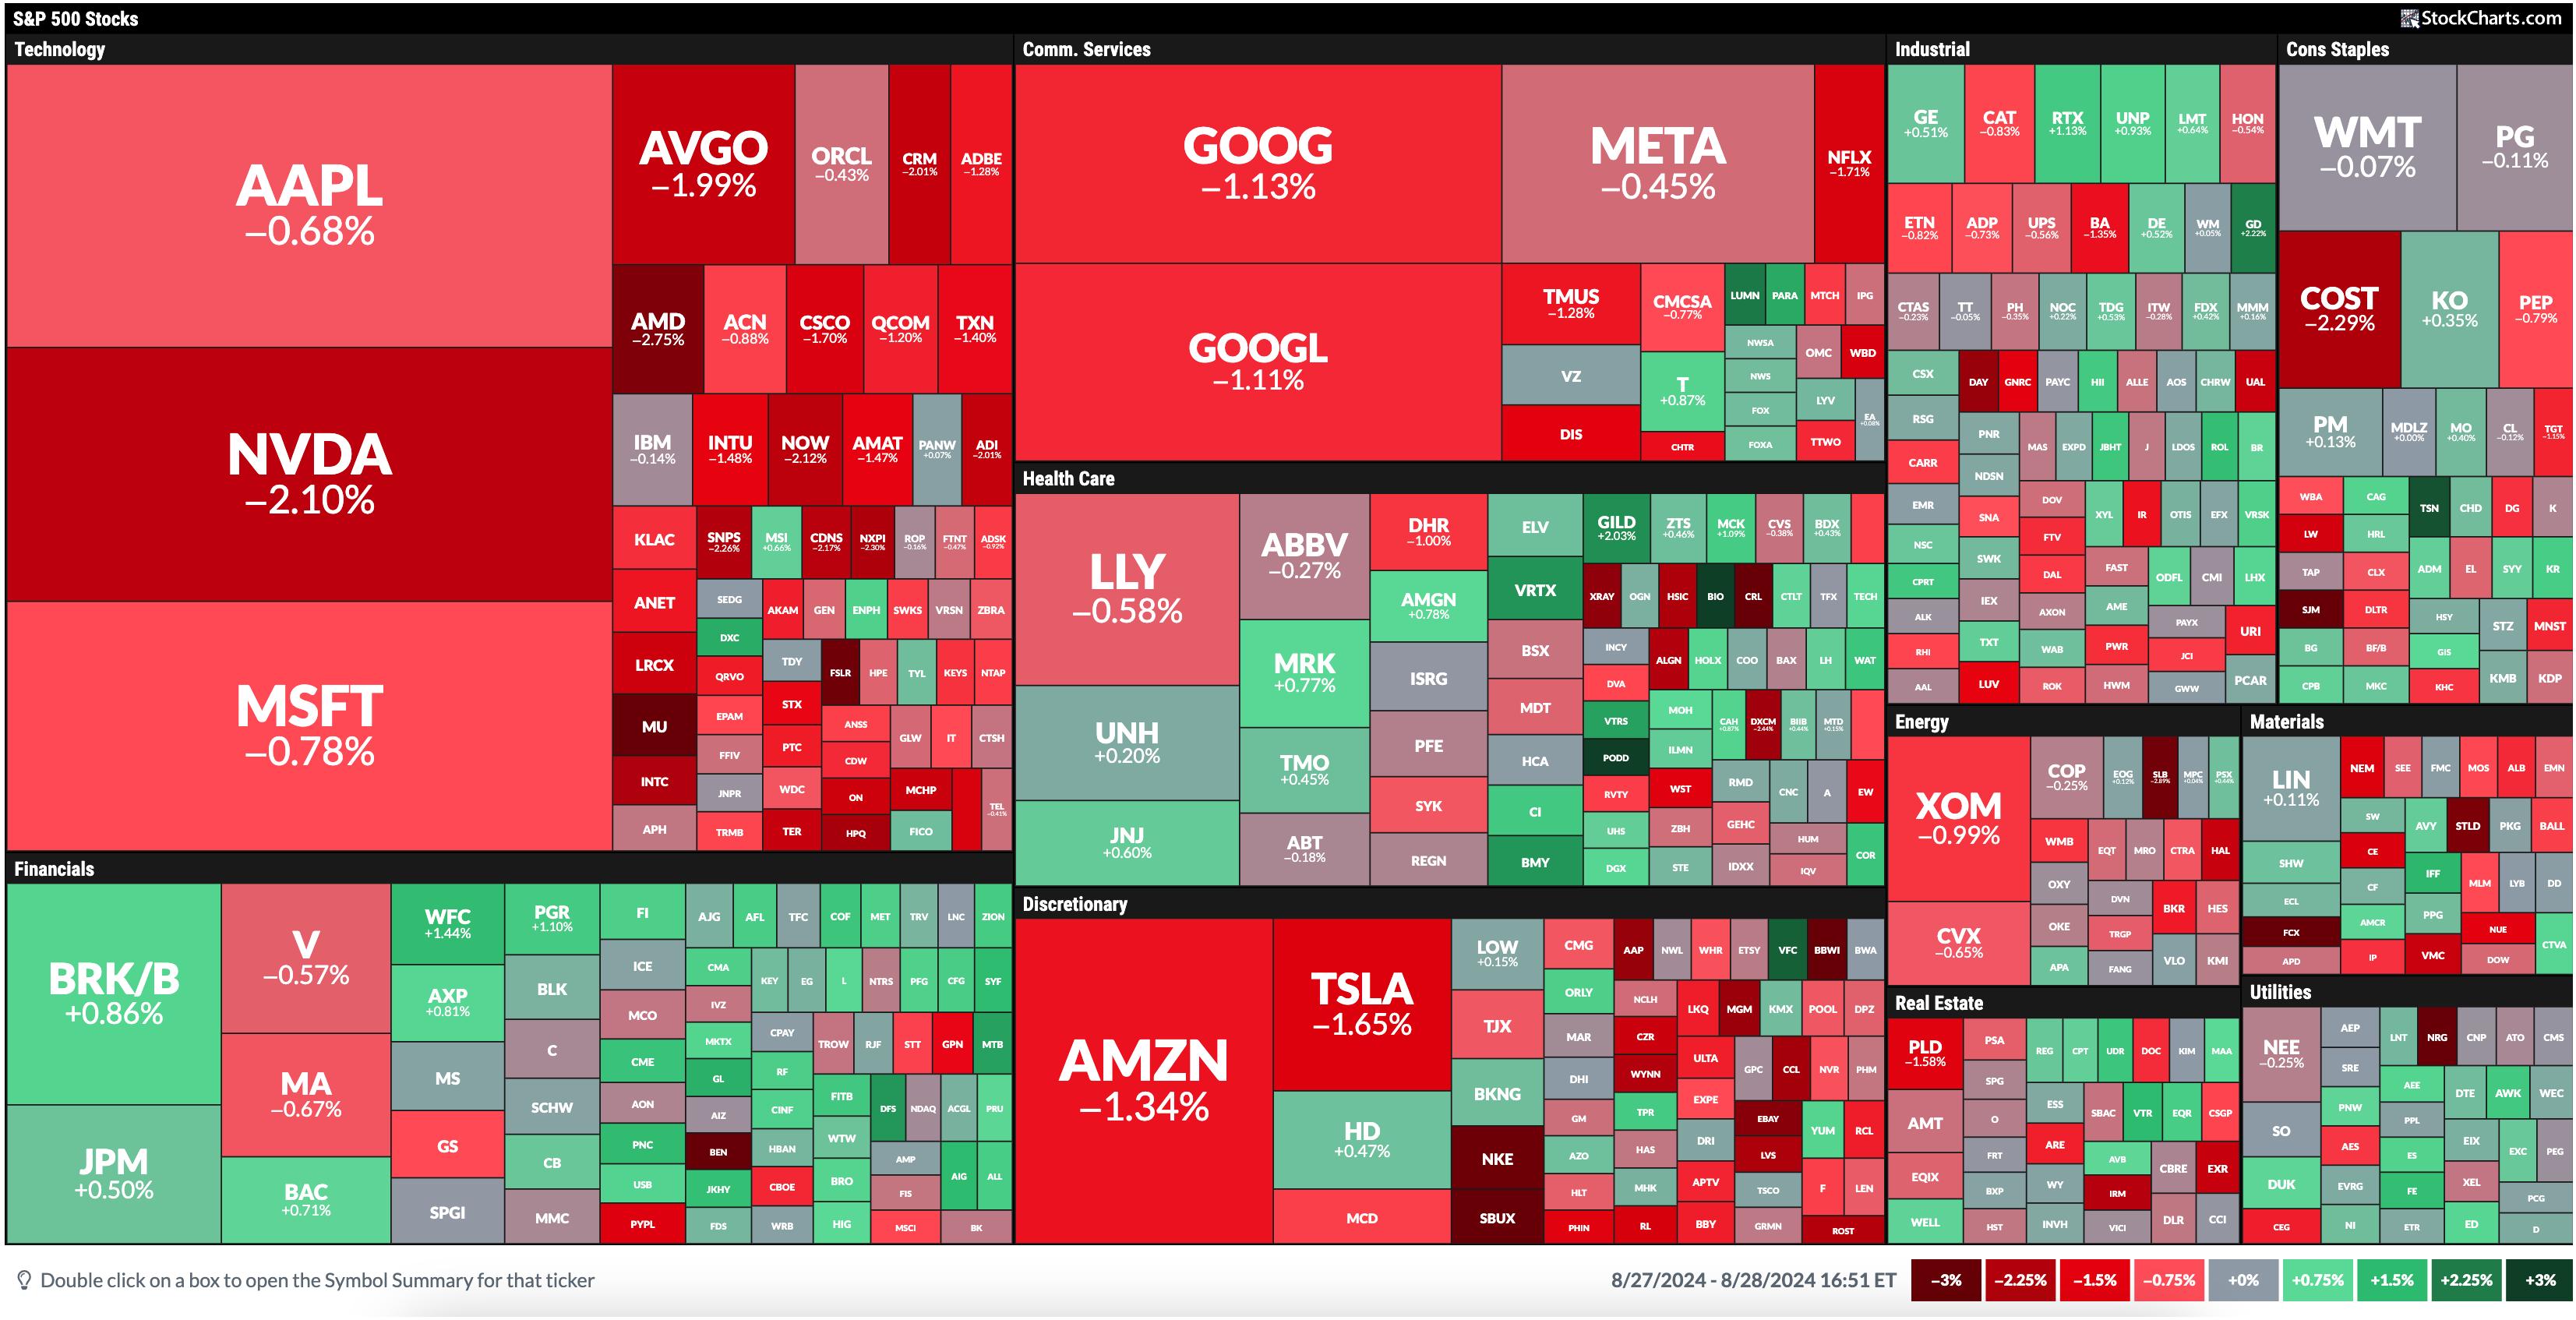
FIGURE 1. A SEA OF RED. Today's stock market action was dominated by selling pressure, but some sectors saw more buying.Image source: StockCharts.com. For educational purposes.
The Technology sector, yesterday's leader, is at the bottom today. The three stocks with the largest market cap in this sector, Apple (AAPL), Nvidia (NVDA), and Microsoft (MSFT), sold off, with NVDA trading 2.10% lower. This is ahead of NVDA's earnings, which were reported after the close. Even though NVDA beat estimates and provided strong guidance, the stock was extremely volatile, with more selling pressure.
Given that NVDA makes up about 7% of the S&P 500 ($SPX) and 8% of the Nasdaq Composite ($COMPQ), the indexes follow NVDA's path. We'll have to wait till tomorrow's open to see if things settle down.
Finding Investment Opportunities
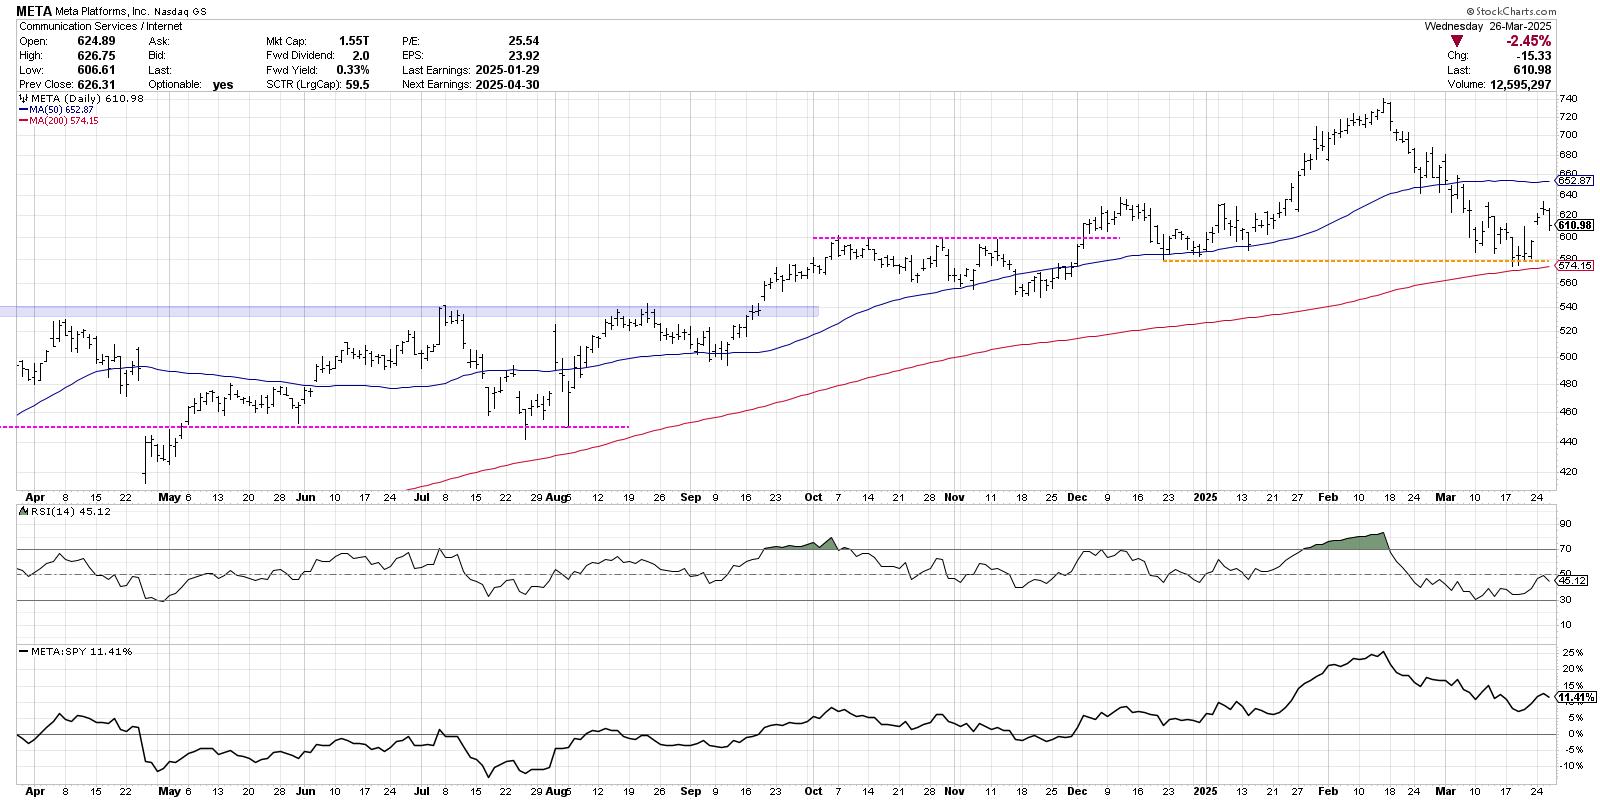
In the meantime, let's pinpoint areas in the stock market that show stability. The one sector that stands out is Financials. In yesterday's post, the focus was on the Financial Select Sector SPDR Fund (XLF), which continues to hit all-time highs. The Financials quadrant in today's MarketCarpet shows that Discover Financial (DFS) led the pack with a 1.94% rise.
The daily chart of XLF below shows that XLF is trading above its 5-day exponential moving average (EMA) and its 20-day simple moving average (SMA).
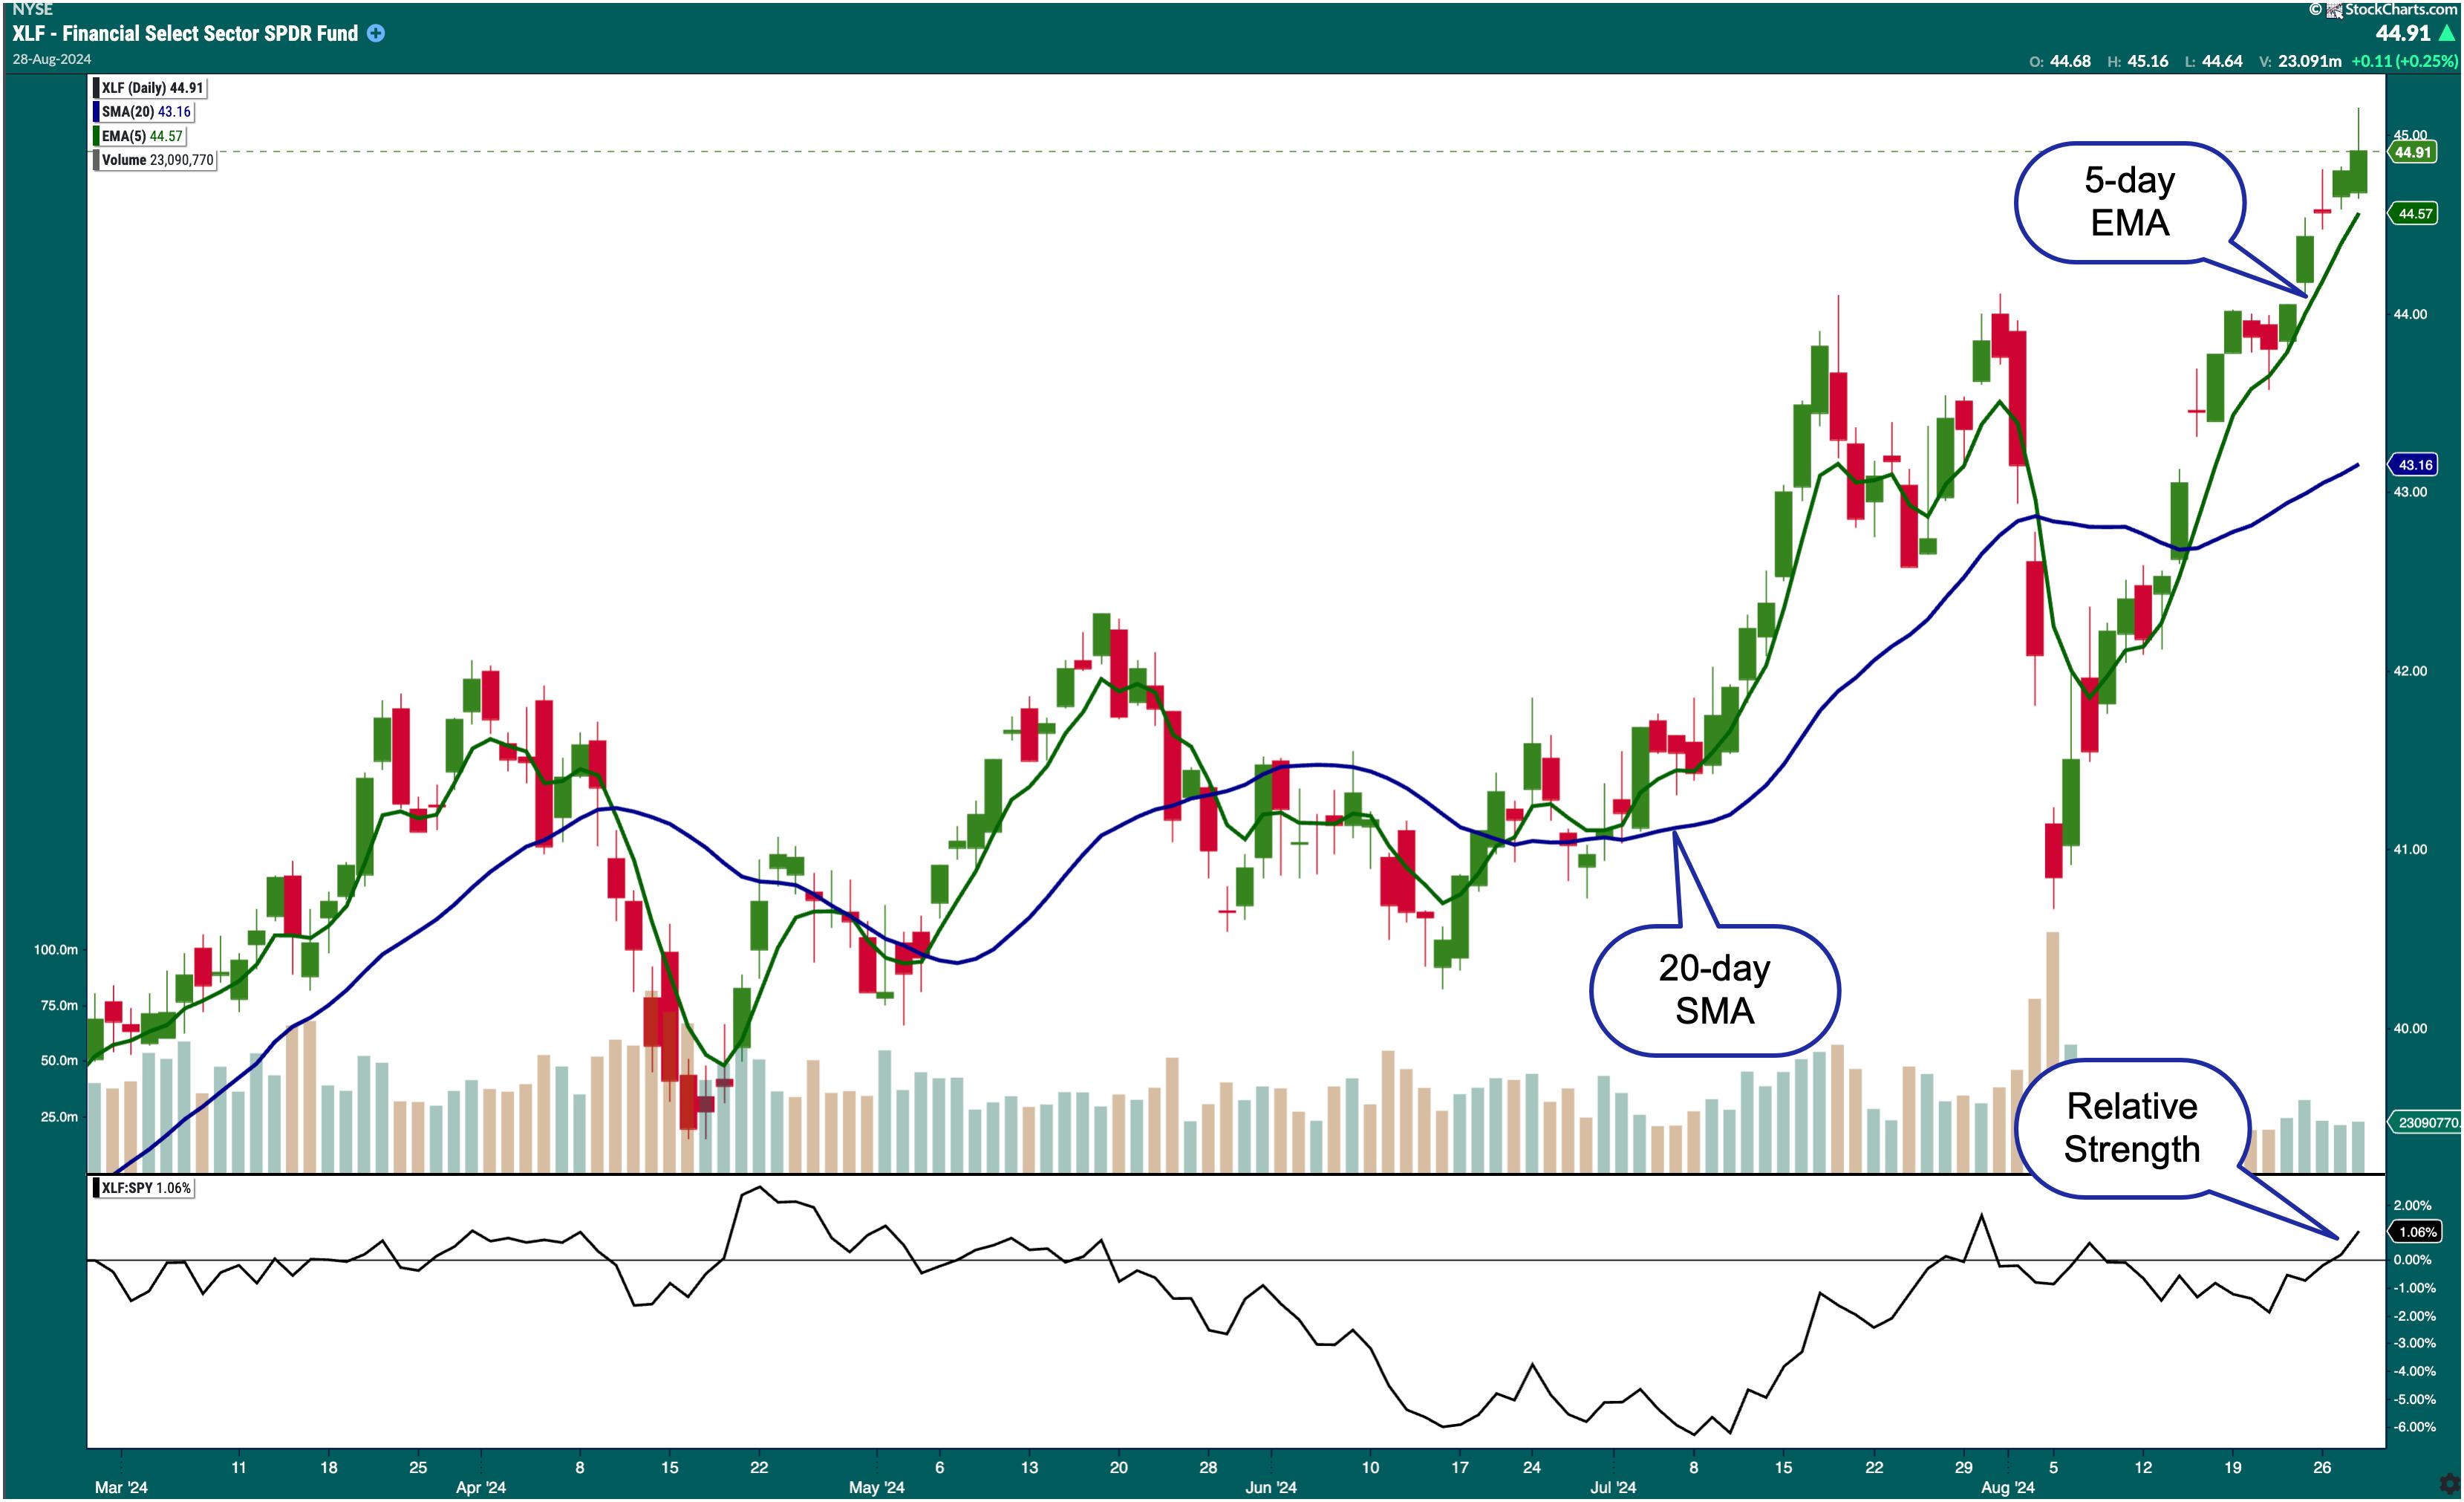
FIGURE 2. DAILY CHART OF FINANCIAL SELECT SECTOR SPDR FUND (XLF). Relative to the SPDR S&P 500 Fund (SPY), XLF is starting to gain strength. The ETF is also trading above its one-week EMA and 20-day SMA.Chart source: StockChartsACP. For educational purposes.
Also, note that, relative to the SPDR S&P 500 Fund (SPY), XLF is gaining strength. It's now outperforming SPY by a modest 1.06%.
While all the attention was on technology, communication services, and consumer discretionary stocks, financial stocks were quietly gaining strength. Given the next FOMC meeting is a few weeks away, XLF could continue rising higher. After Fed Chair Jerome Powell's speech in Jackson Hole on August 23, where he suggested that the Fed is prepared to cut interest rates, XLF has consistently been hitting new all-time highs. With interest rate cuts expected this year—there's a possibility of a target rate of 4.25%–4.5% by December according to the CME FedWatch Tool—think of how high XLF could go!
If you're weary of investing in exchange-traded funds, consider selecting a handful of stocks in the Financial sector. Click the Financials header in the MarketCarpet to see the stocks in the sector.
FIGURE 3. FINANCIAL SECTOR MARKETCARPET. The largest squares represent the largest stocks by market cap, whereas the darkest green squares represent stocks with the largest gains.Image source: StockCharts.com. For educational purposes.
At the Close
The stock market can be extremely volatile, especially close to big earnings report releases. To avoid getting caught up in all the market noise, identify sectors that are showing stability. Right now, it may be the Financial sector. But that can change, so be flexible and, when you see things changing, be prepared to sell your positions.
 StockCharts Tip.
Create a ChartList of the 11 sector ETFs StockCharts uses as sector proxies.
Disclaimer: This blog is for educational purposes only and should not be construed as financial advice. The ideas and strategies should never be used without first assessing your own personal and financial situation, or without consulting a financial professional.
Happy charting!