TAKEAWAYS
- The Dow Jones Industrial Average closed at a record high in a thin trading day.
- The Financial sector continues to lead.
- Overall, the stock market remains healthy with low volatility.
The thin trading ahead of Labor Day weekend is here. Despite that, on Thursday, the Dow Jones Industrial Average ($INDU) notched a record-high close. The S&P 500 ($SPX) was flat, and the Nasdaq Composite ($COMPQ) closed slightly lower.
Both indexes traded higher for most of the trading day, but it seemed that traders sold off on the rally in the afternoon and packed off early to take advantage of the last long summer weekend. Nvidia's earnings are out, and all that's remaining is Friday's PCE Index. Since the Fed has already indicated that rate cuts are on the board, maybe the PCE isn't such a big deal. Expect a slow day on Friday.
A Closer Look at Stock Market Action
It was an unusual day in the stock market. Since the Dow Jones Industrial Average closed at a record high, the Industrial sector did well. But Tech stocks, for the most part, didn't fare as poorly as you may have expected. Apple (AAPL) was up 1.46% and Microsoft (MSFT) closed higher by 0.61%. But Nvidia's 6.38% loss was the one that dragged down the Tech sector, putting it in last place in sector performance (see below).
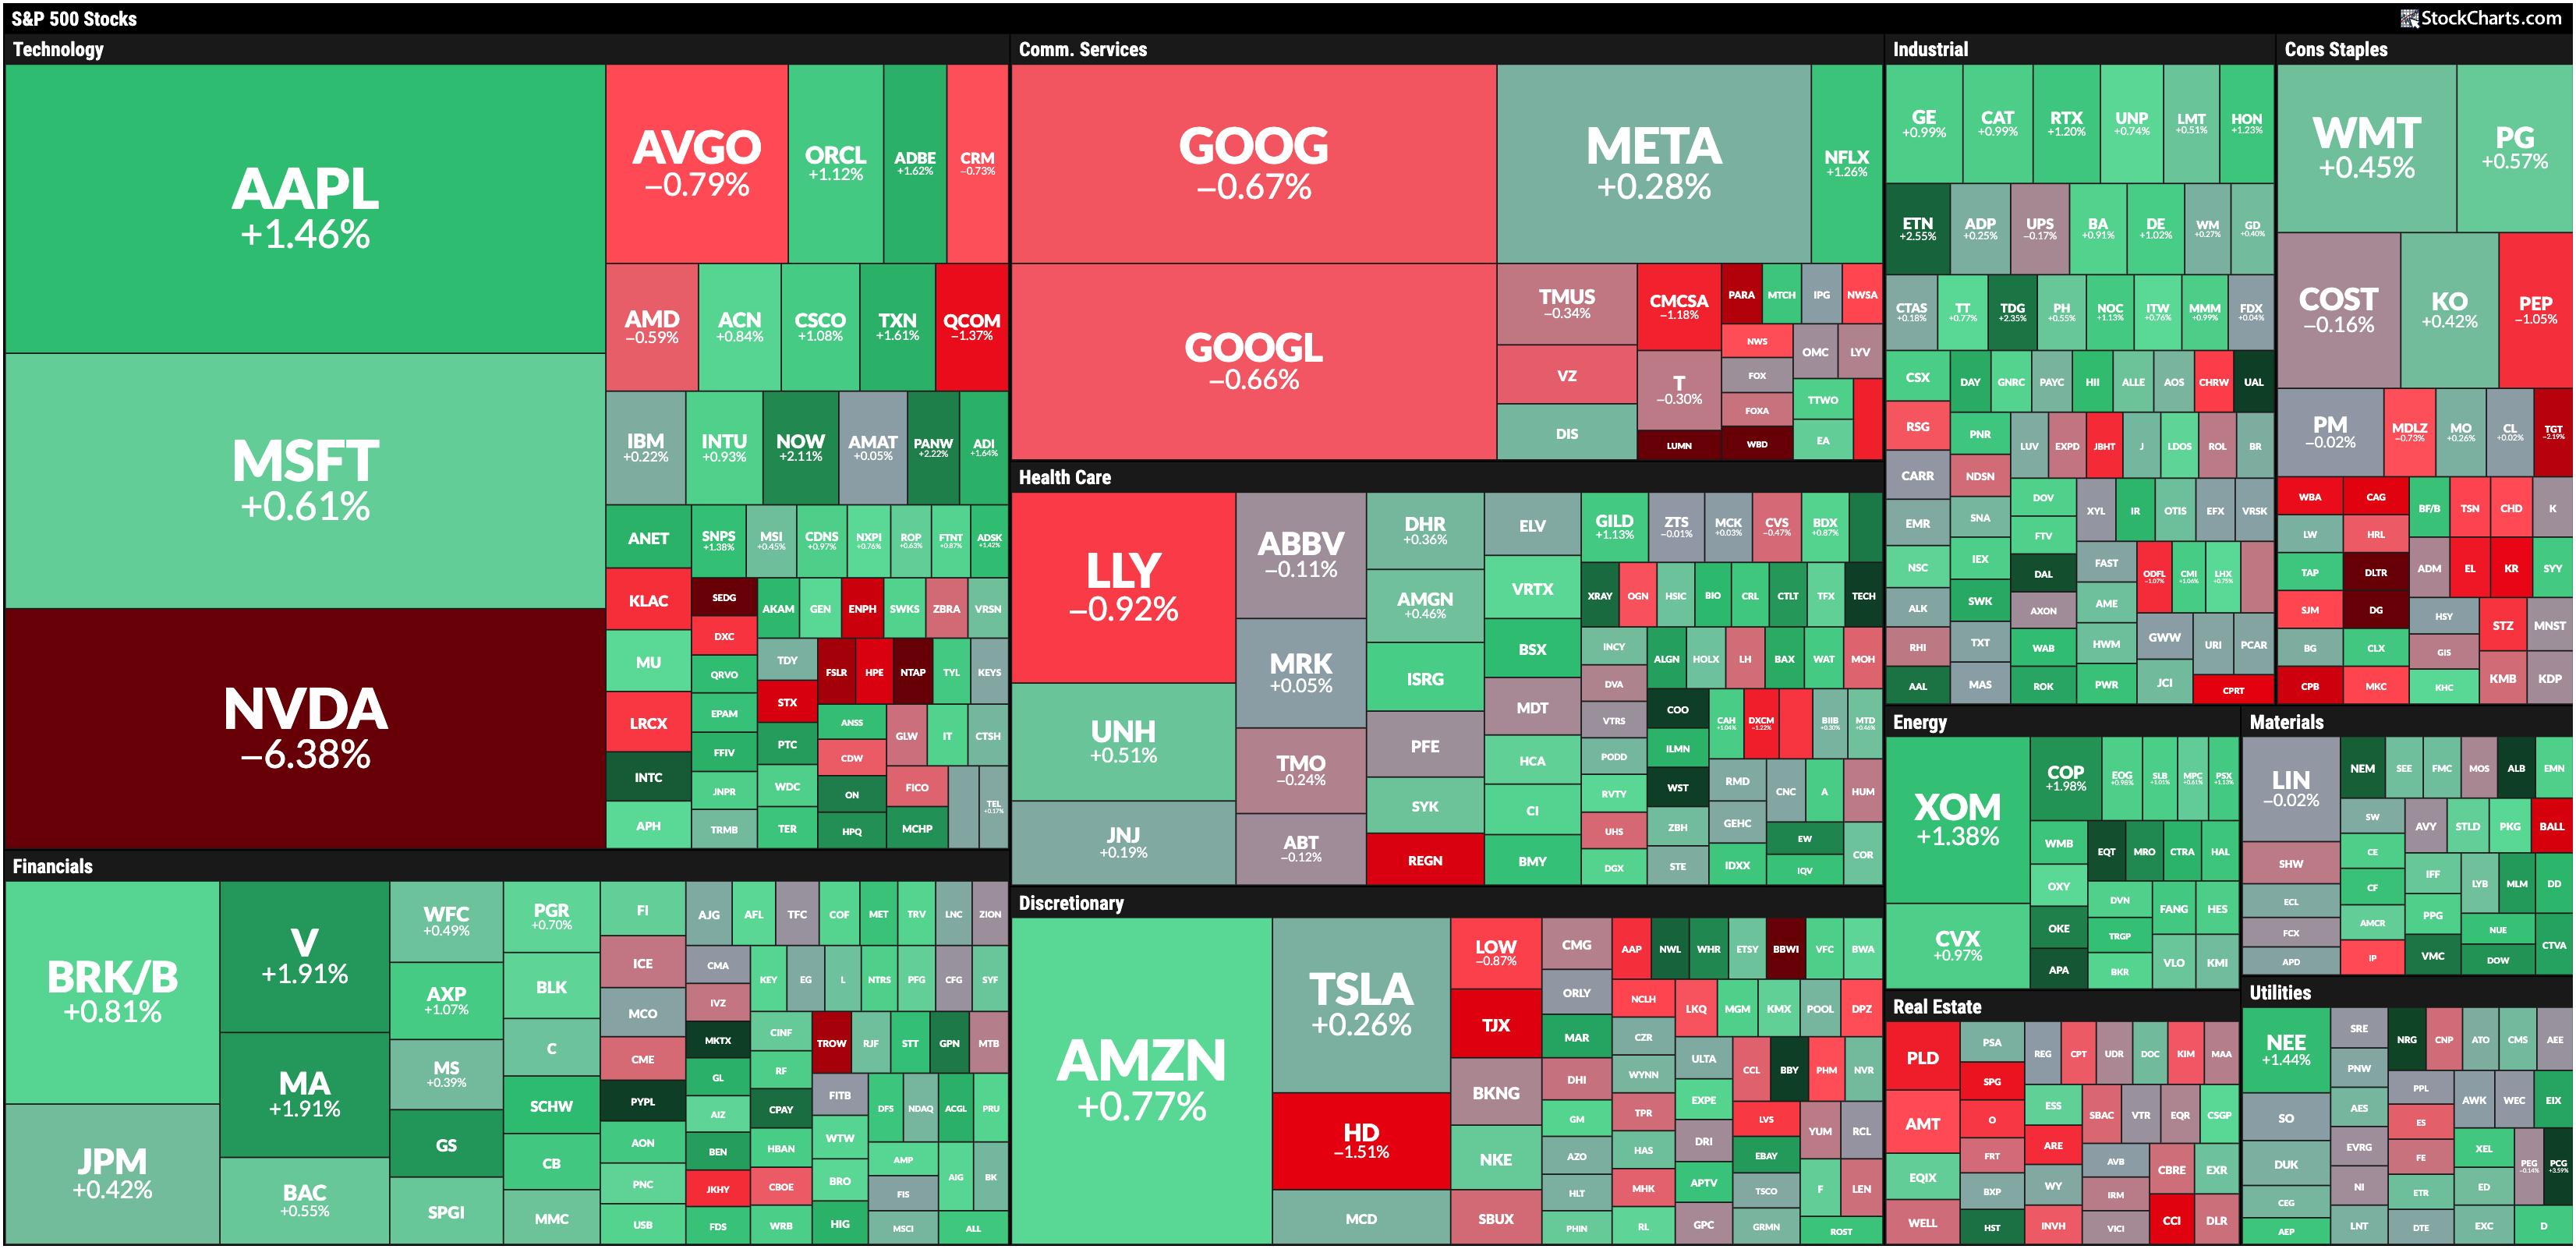
FIGURE 1. STOCKCHARTS MARKETCARPET FOR AUGUST 29. Energy, Financials, and Utilities take the lead.
The good news is the Financial sector continues to hold up, with PayPal (PYPL) leading in performance with a 3.88% gain. Visa (V) and Mastercard (MA) saw gains of 1.91%. The underperformer was T Rowe Price (TROW) with a 2.37% decline.
Thursday's top-performing sector was Energy, with Exxon Mobil (XOM) and Chevron (CVX), the two largest stocks in the sector by market cap, trading higher. XOM was up 1.38%, and CVX was up 0.97%.
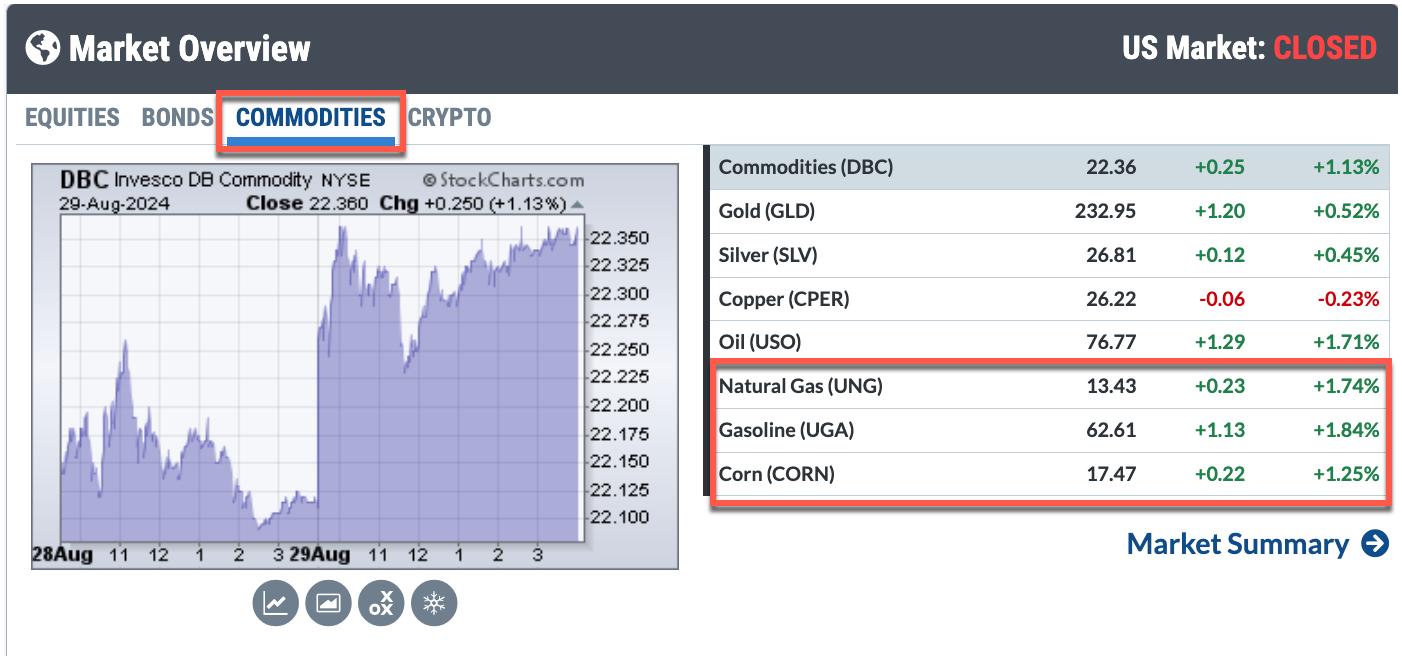
The rise in crude oil prices may have been the catalyst that helped the Energy sector. The Market Overview panel in the StockCharts Dashboard shows that, except for copper, commodity prices rose. Oil, Natural Gas, and Gasoline prices rose well over 1%.
Going back to Thursday's MarketCarpet, even though NVDA closed lower by over 6%, other chip stocks did well. This reflects that the AI boom is still in play. Overall, the stock market remains healthy, with expanding market breadth and low volatility. The stock market will see higher trading volume from next week. In the meantime, follow the broader indexes, start building ChartLists of the different sectors, and download a few of the StockCharts free ChartPacks.
 StockCharts Tip.
ChartPacks are a great way to get started with building ChartLists and exploring what Technical Analyst experts typically view before, during, and after market hours.
At the Close
A quick glance at Your Dashboard daily will keep you engaged with the stock market. Follow the market action in the broader equity indexes, bonds, commodities, and cryptocurrencies. From the Sector Summary, identify which sectors are performing well and which aren't. The SCTR Reports and Market Movers can help you identify the strongest and weakest stocks.
Disclaimer: This blog is for educational purposes only and should not be construed as financial advice. The ideas and strategies should never be used without first assessing your own personal and financial situation, or without consulting a financial professional.
Happy charting!


