TAKEAWAYS
- Stocks make a strong recovery after last week's selloff.
- Large-, mid-, and small-cap stocks closed higher, with small caps the clear leader.
- Gold and silver prices surged on interest rate cut expectations.
This week's stock market action may have caught many investors by surprise. After last week's massive selloff, this week's turnaround reignited investor enthusiasm in equities. Large-cap growth stocks were the leading asset class in the early part of the trading week, and, by Friday, the clear leaders were the mid- and large-cap stocks.
This week's Consumer Price Index (CPI) and Producer Price Index (PPI) showed that inflation has cooled, which means the Fed will probably cut interest rates. More optimistic is the thinking that there may be more than the 25 basis points (bps) we were expecting last week.
Broader Market Index Price Action
The Dow Jones Industrial Average ($INDU), S&P 500 ($SPX), and Nasdaq Composite ($COMPQ) closed higher for the week. The S&P 500 and the Dow are trading close to their August highs, but the Nasdaq has some catching up to do. In Nasdaq's defense, it was the hardest hit among the three.
The Nasdaq's daily chart gives a clearer picture of where the index stands now, technically speaking, battling against resistance from the downtrend line. A break above this line would mean the bulls are still in the lead, but a break above the August high would indicate bulls are charging to the finish line.
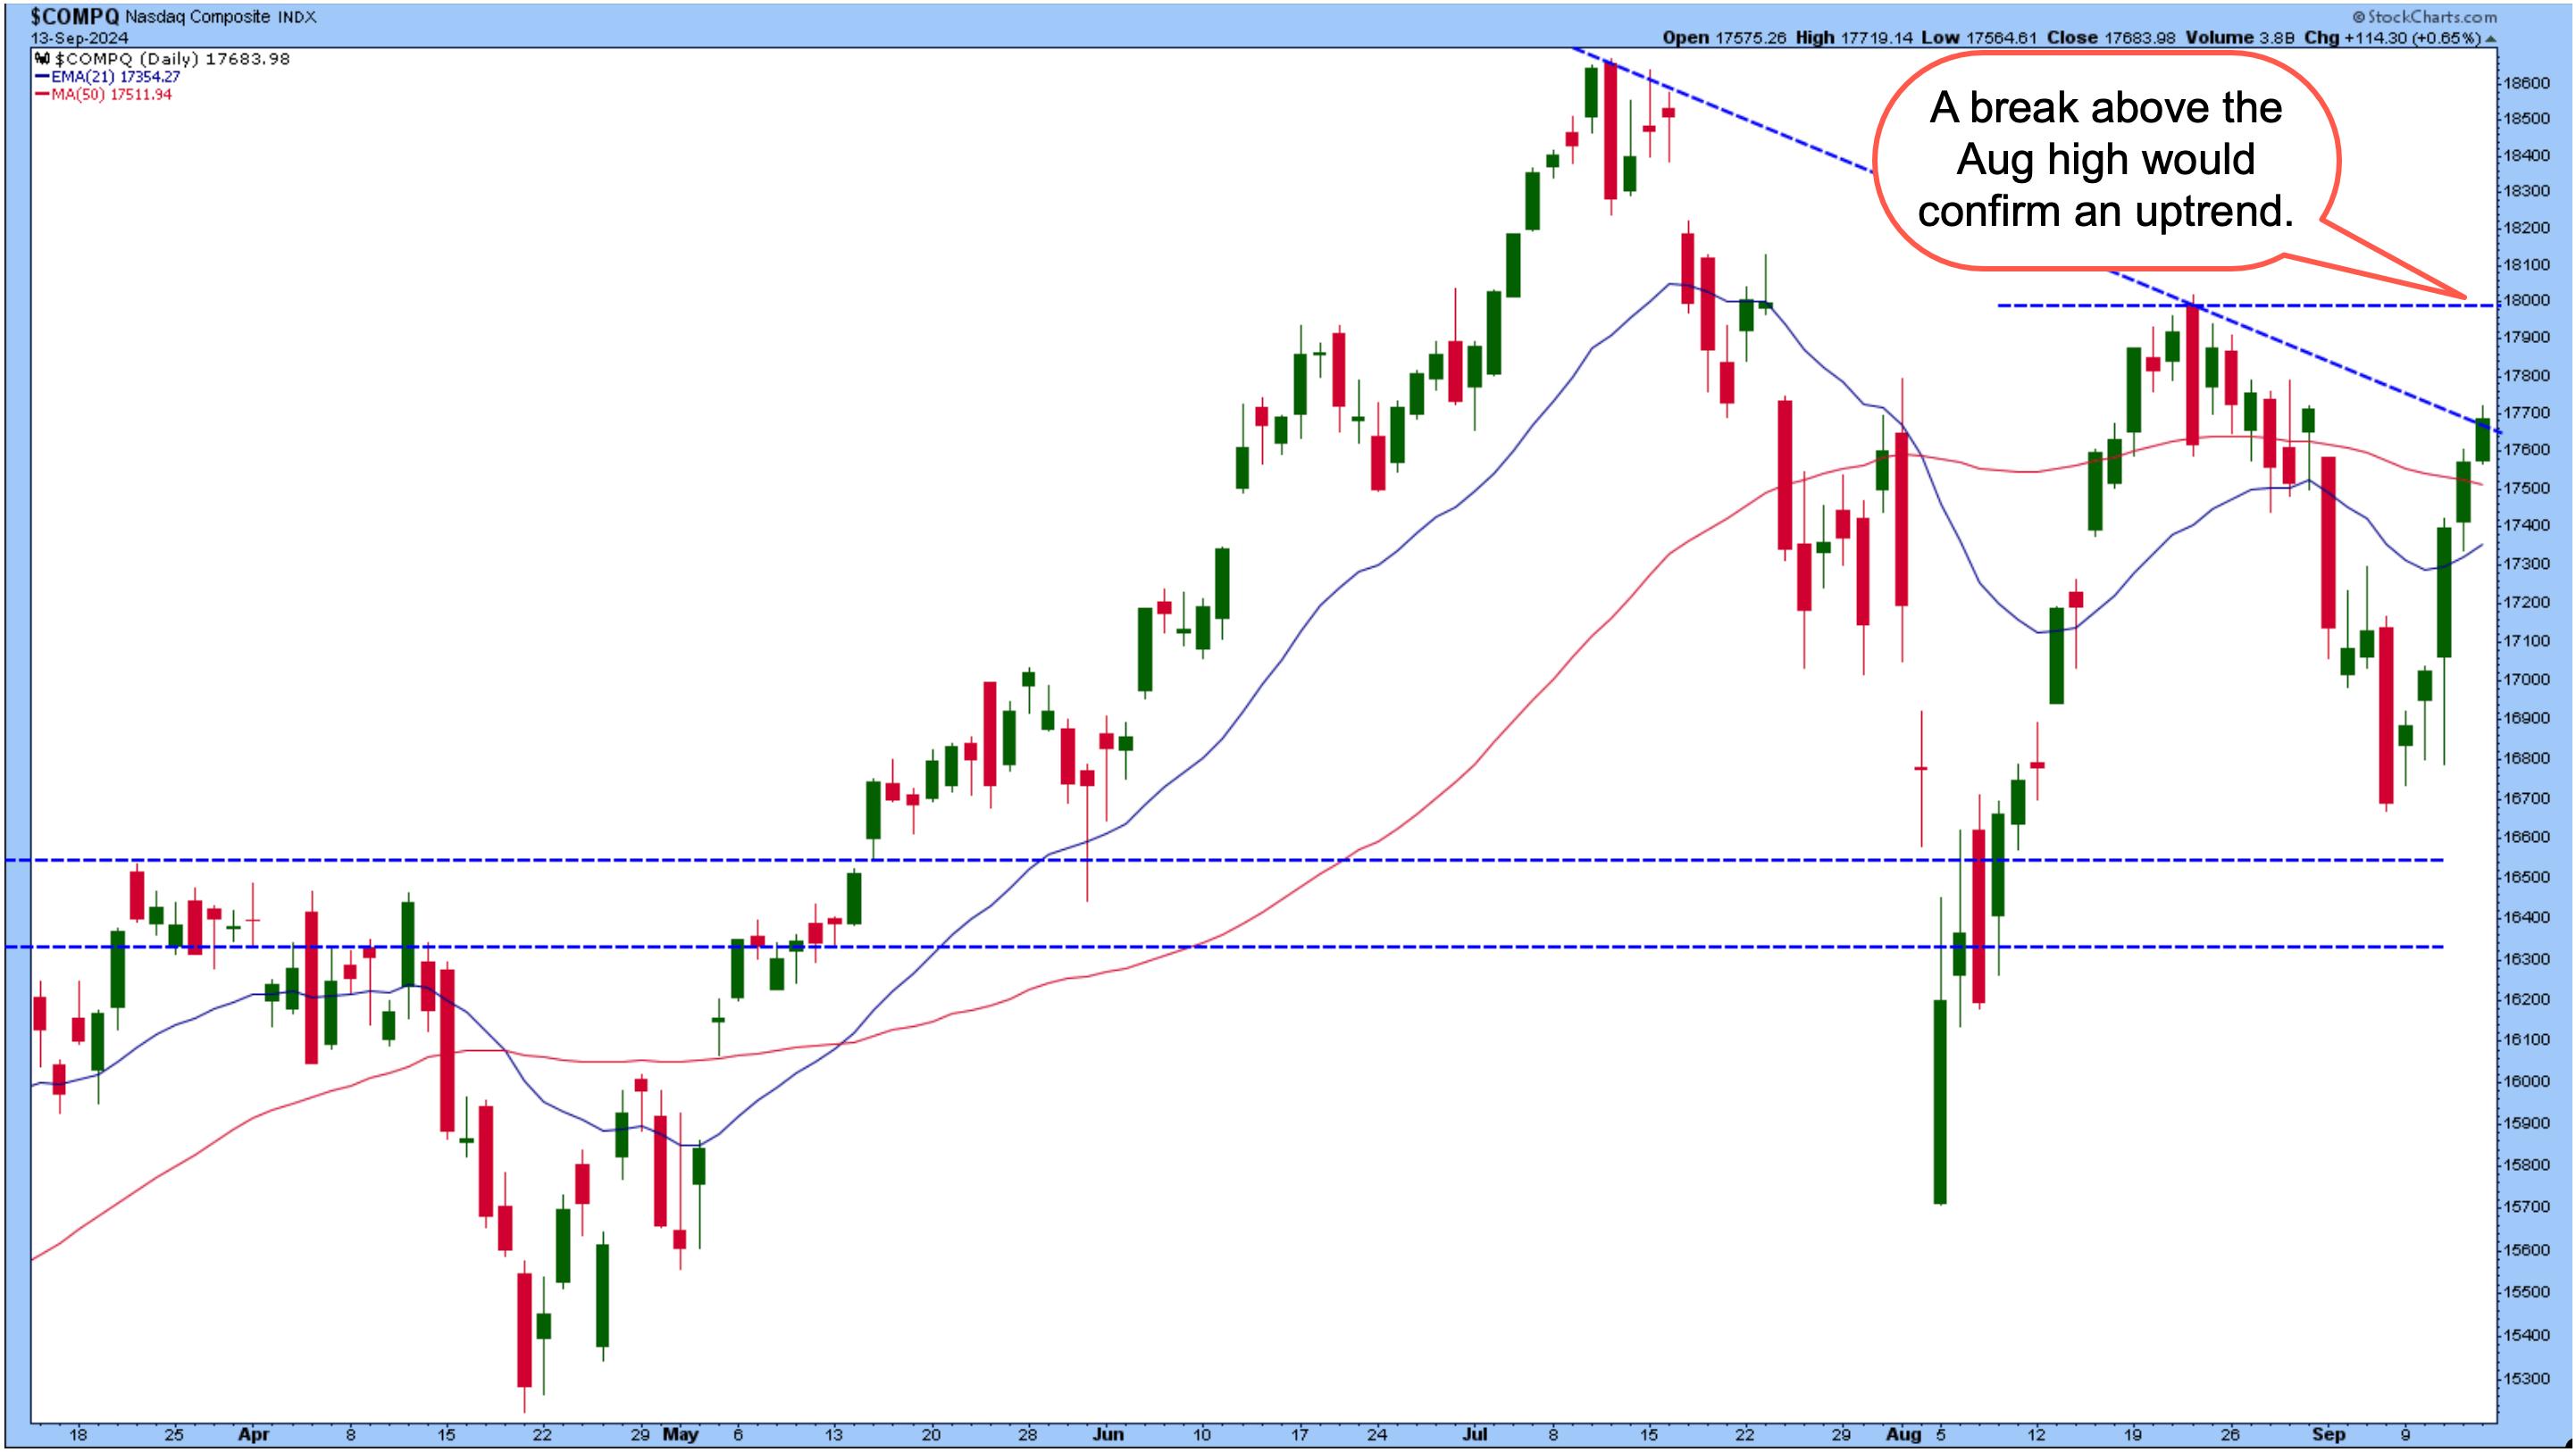
FIGURE 1. WILL THE NASDAQ COMPOSITE BREAK THROUGH ITS DOWNTREND? A break above the downtrend would be bullish for the tech-heavy index, but a more confirming move would be a break above its August high.Chart source: StockCharts.com. For educational purposes.
If you participated in the "dip buying" this week, the resistance of the downward trendline is one to watch carefully. And if you missed buying on the September dip, a break above the trendline should be an early signal to prepare to add positions, but waiting for the index to break above its August high would be wiser.
There are a couple of factors to keep in mind. One is that it's still September, a seasonally weak month for stocks. The second is there's an FOMC meeting next week. Investors expect an interest rate cut to be announced, but how much will the Fed cut rates? The odds of a 50 basis point cut have risen since last week; as of this writing, according to the CME FedWatch Tool, the probability of a 25 bps cut is 51%. The probability of a 50 bps is 49%. These percentages drastically differ from last week's odds, when the odds for a 25 bps rate cut were above 70%.
The stock market is acting like it expects a 50 bps cut. If the Fed cuts 25 bps, though, the market could be disappointed, so tread carefully. A lot is riding on the Fed's decision on Wednesday.
Small Cap Revival
The S&P Small Cap Index ($SML) started gaining traction this week, surging on Friday. Looking at the ratio chart of the iShares Russell 2000 ETF (IWM) and SPDR S&P 500 ETF (SPY), we can see small-cap stocks are beginning to gain strength, but still have some work to do before outpacing the bigger stocks.
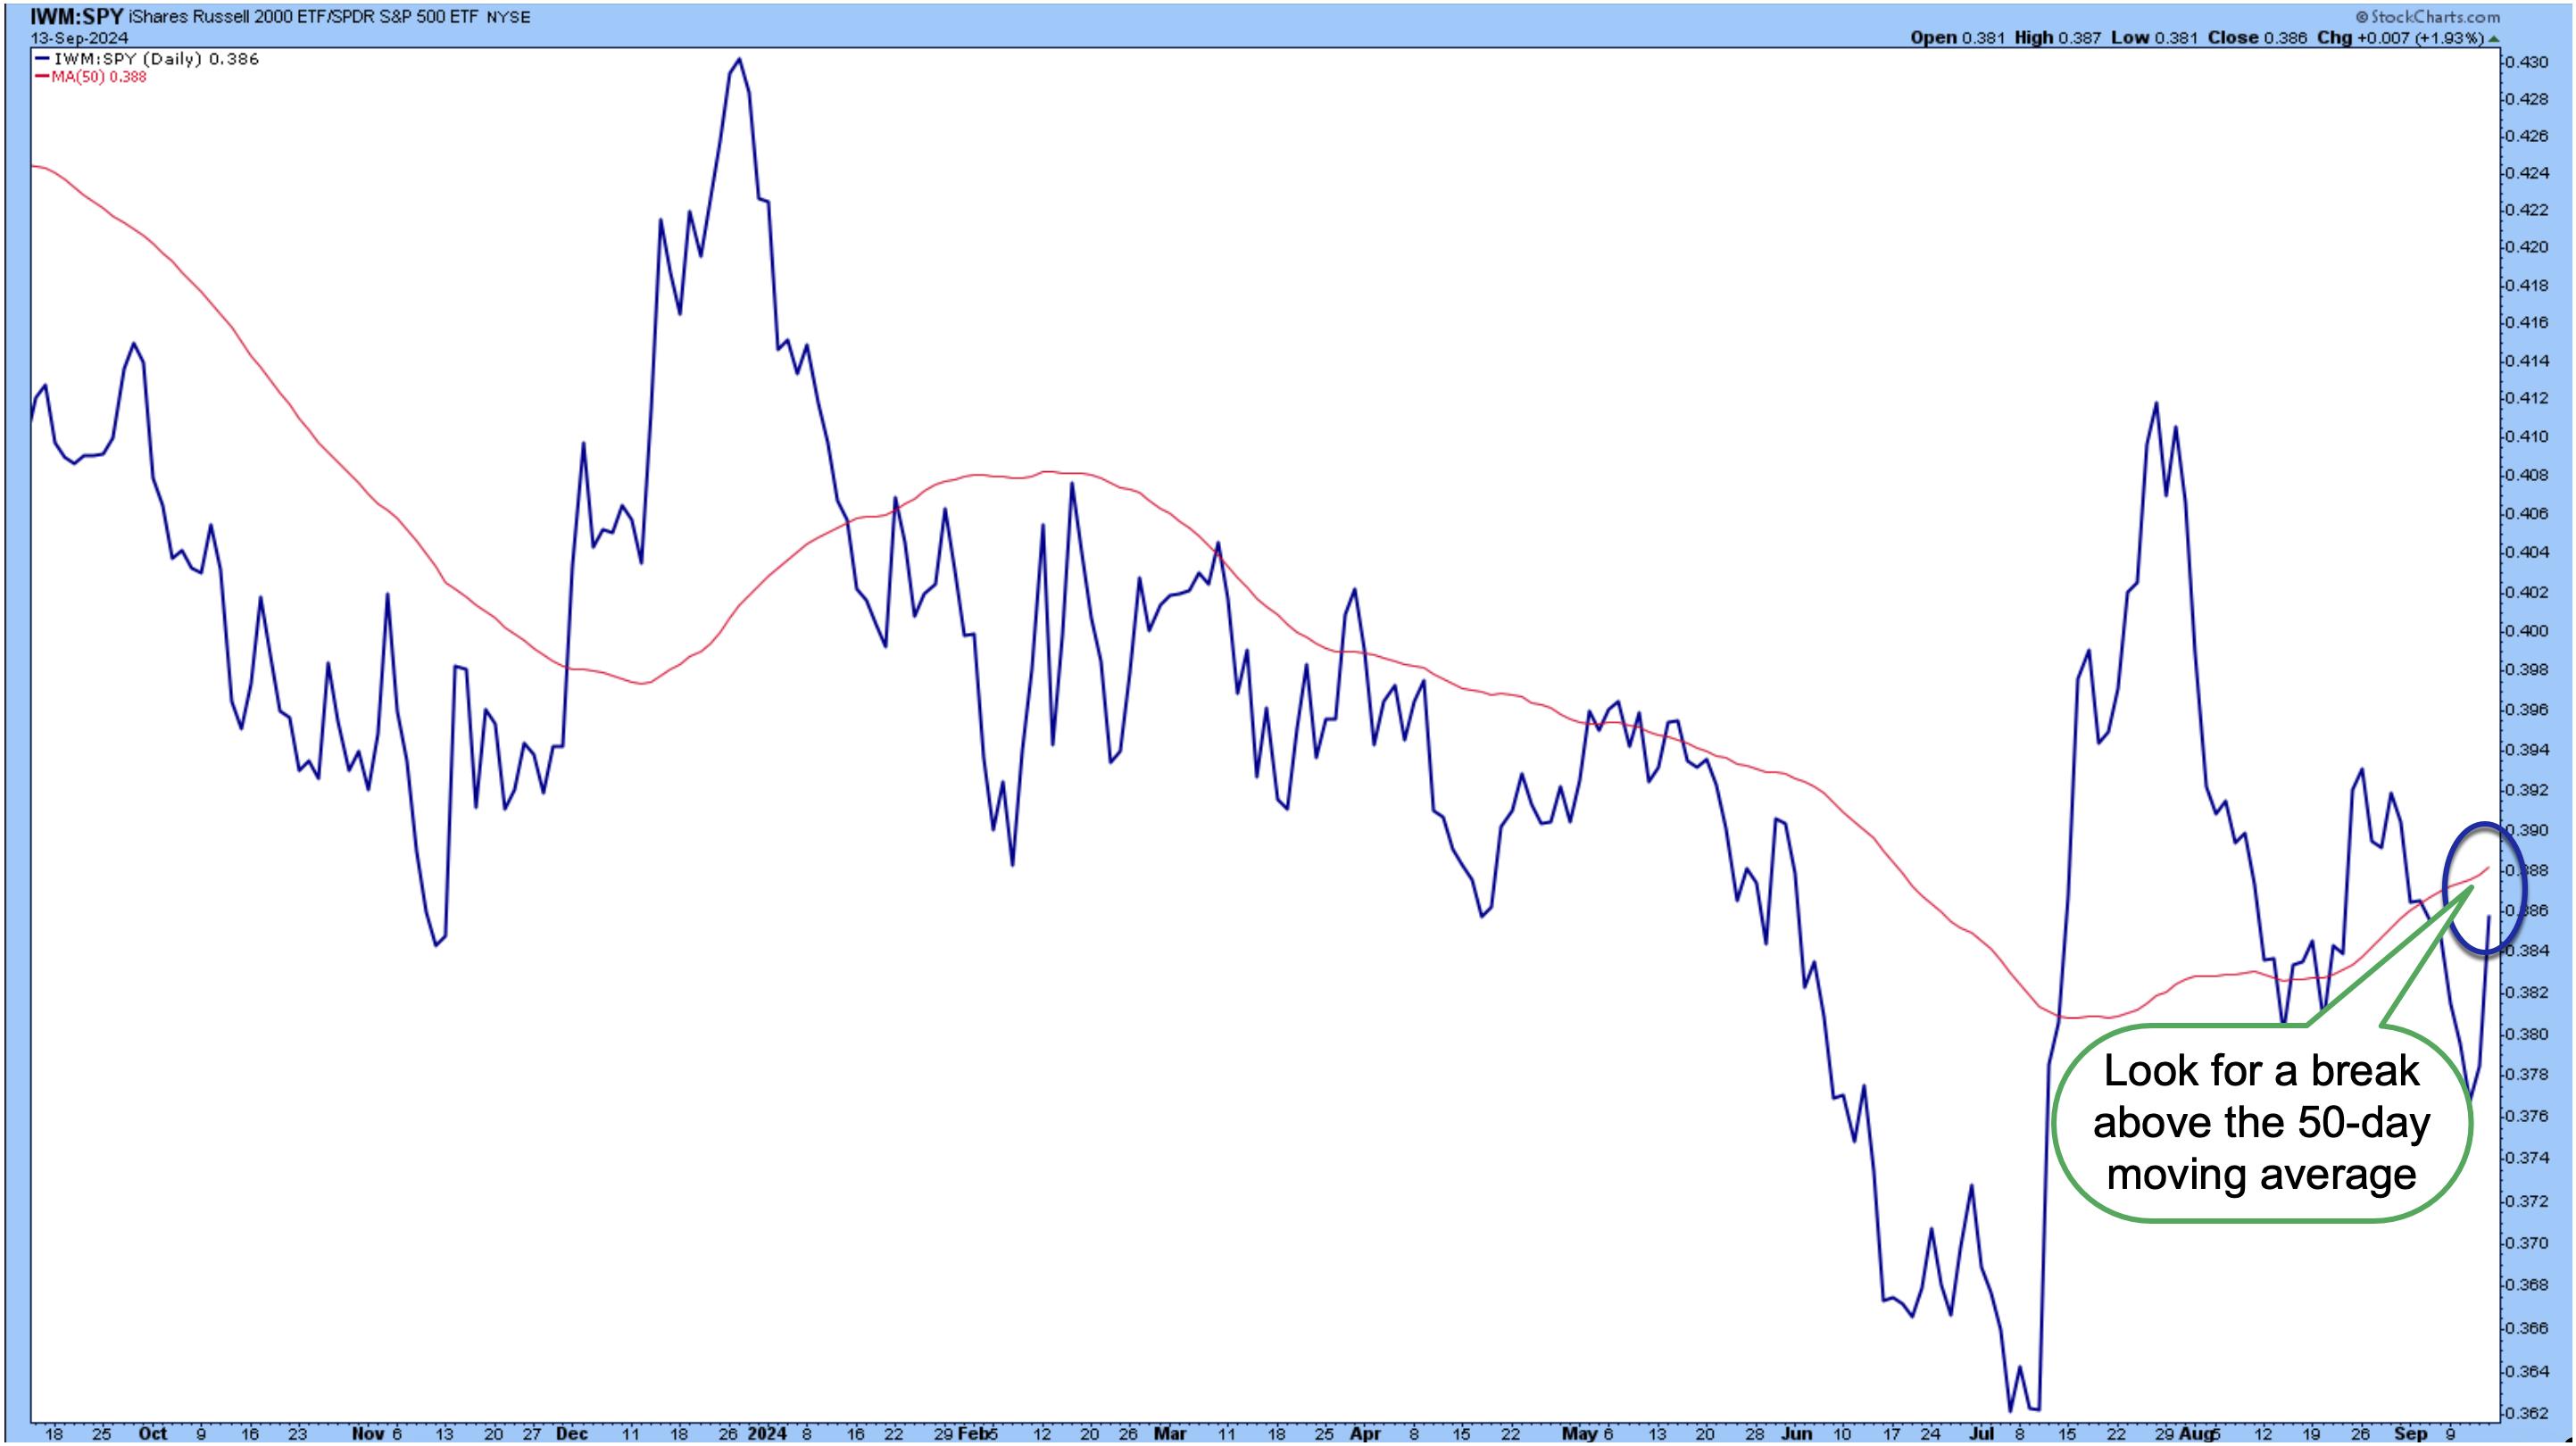
FIGURE 2. SMALL CAPS VS. LARGE CAP STOCKS. Small caps surged this week, but they still have more to go before catching up with their bigger cousins.Chart source: StockCharts.com. For educational purposes.
Small caps surged in July when inflation fears were in the rear-view mirror, but fell after concerns of a recession surfaced. Now that interest rate cuts are on the table, small-cap stocks may see more upside. A break above the upward-sloping 50-day simple moving average (SMA) could give IWM a further boost.
What's Happening With Precious Metals?
Gold prices hit an all-time high on Friday, riding on interest rate cut expectations. The daily chart of the SPDR Gold Shares (GLD) below shows price breaking above a consolidation area, gapping up, and hitting an all-time high.
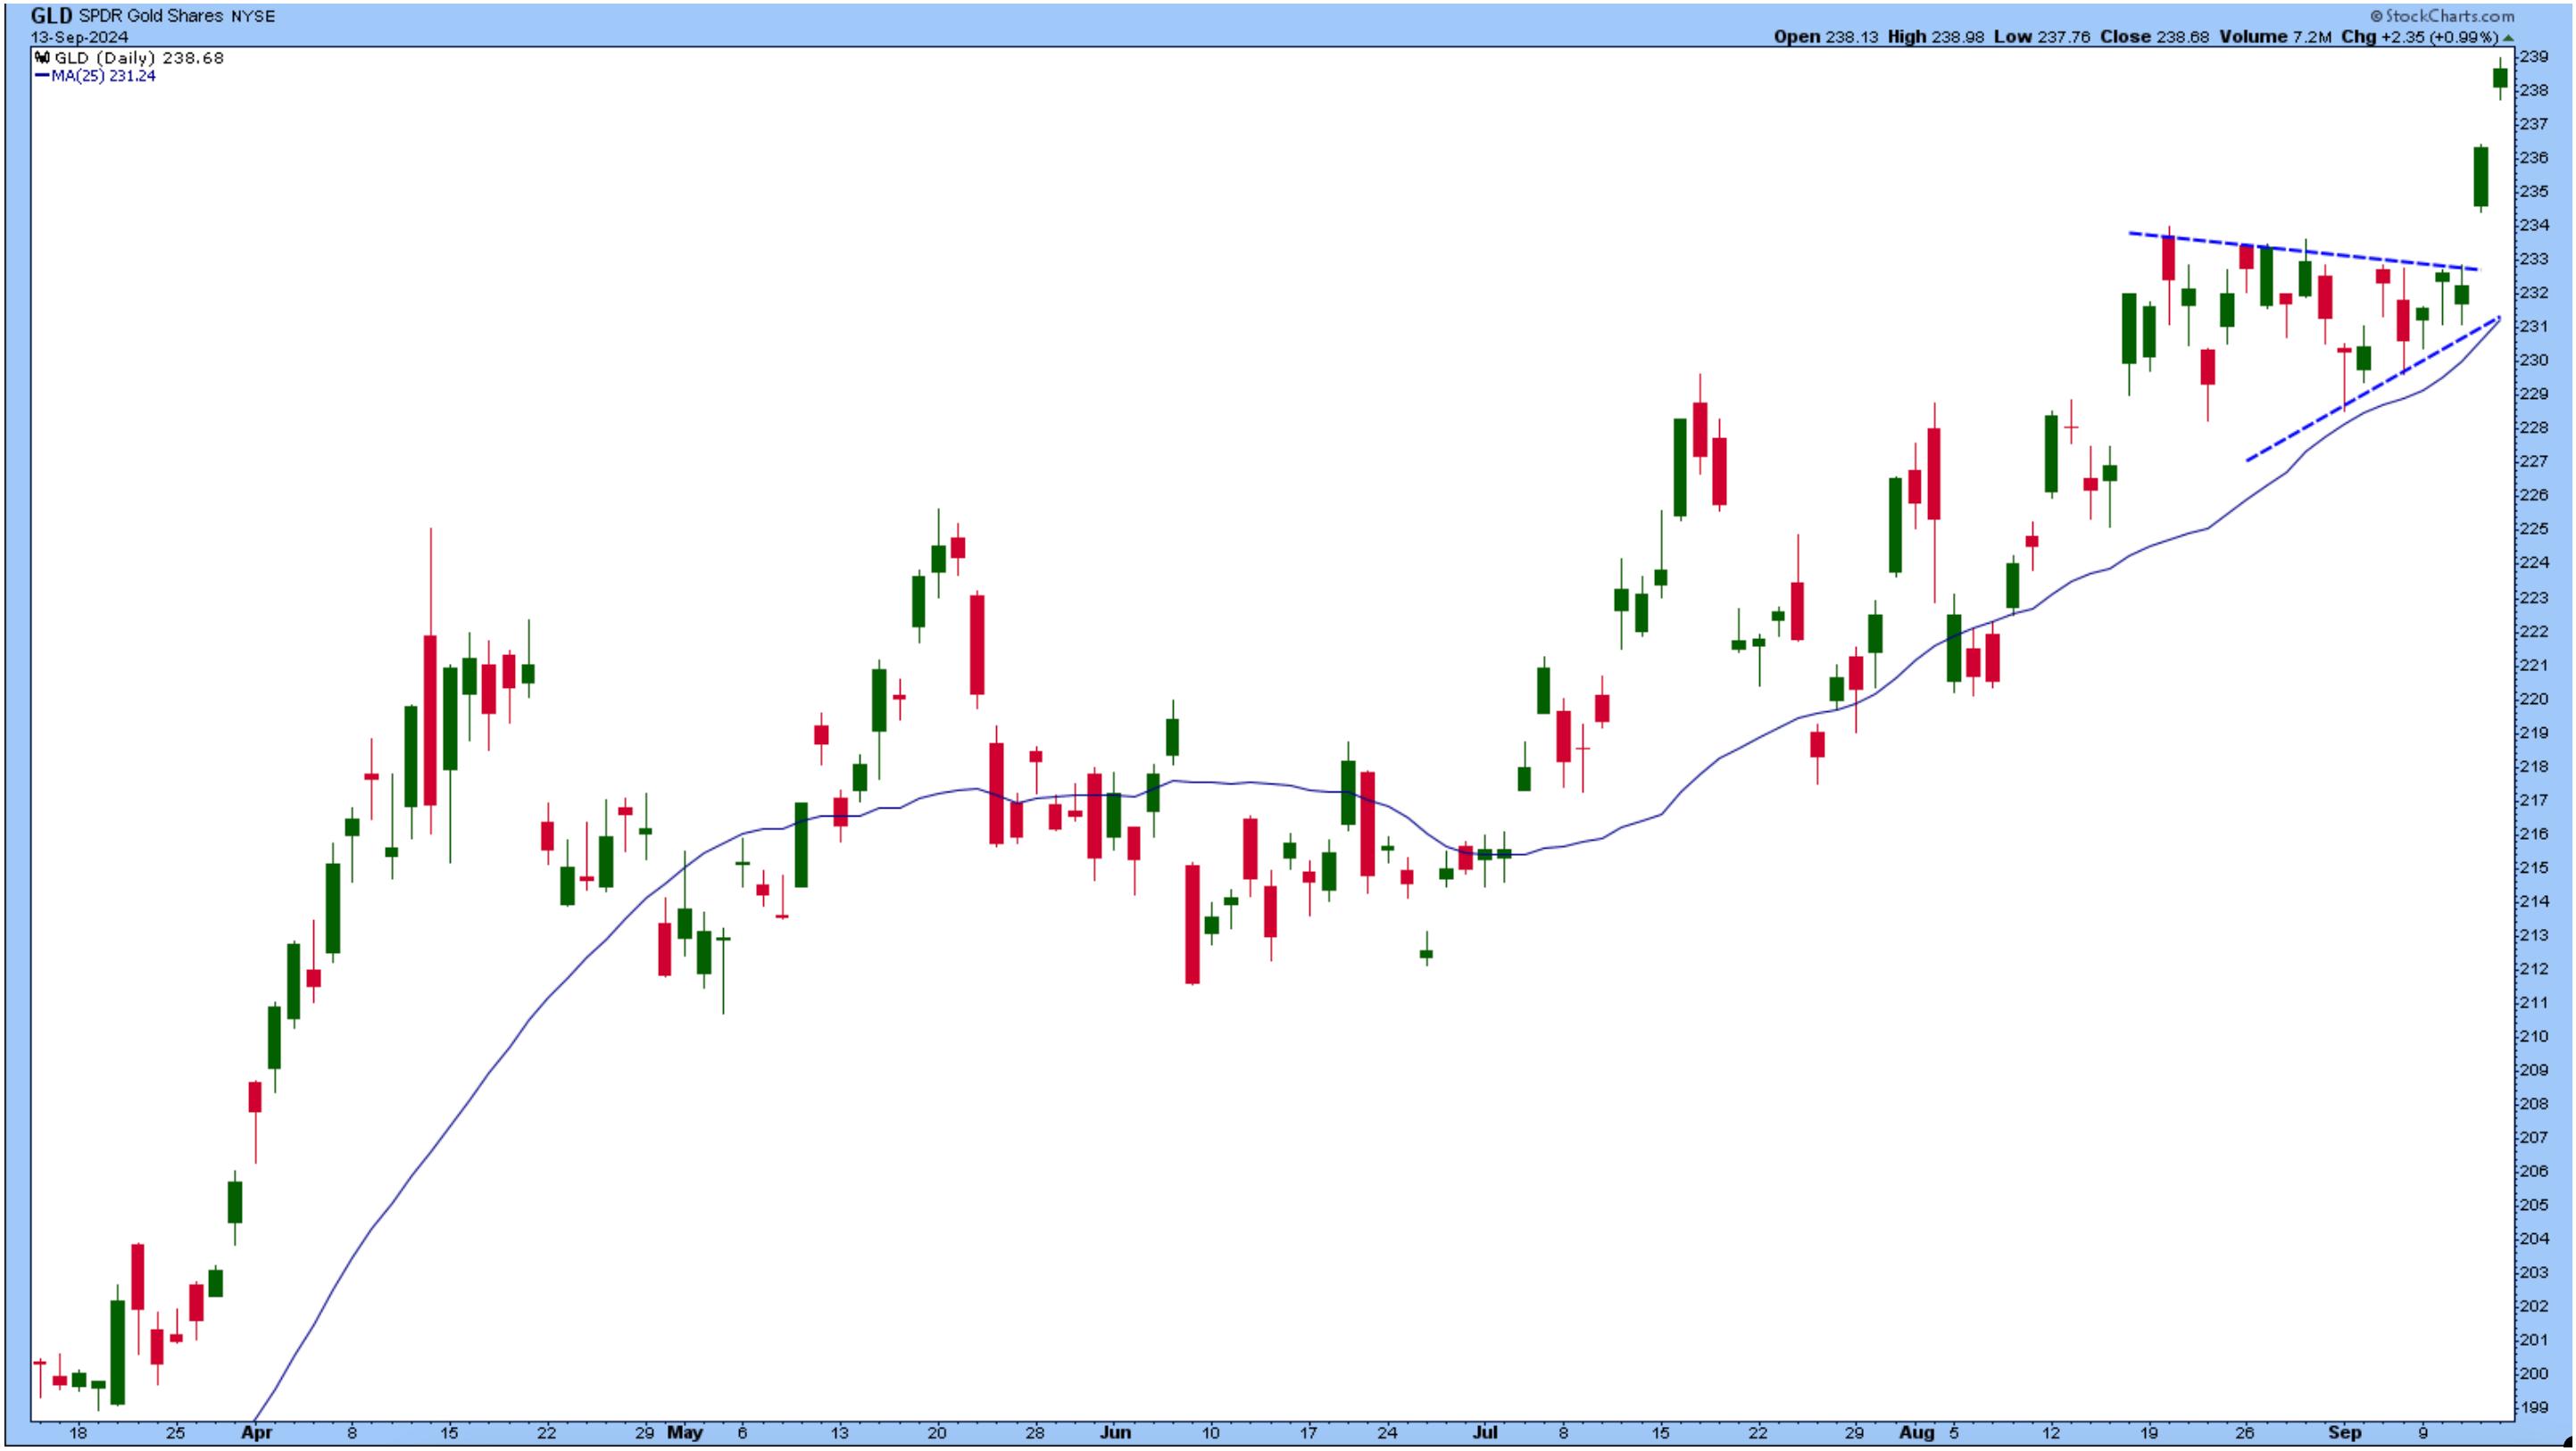
FIGURE 3. GOLD PRICES HIT AN ALL-TIME HIGH. After breaking out of a consolidation pattern, gold prices gapped up and surged.Chart source: StockCharts.com. For educational purposes. Why the rise in gold in tandem with a rise in equities? Investors want to hedge their positions in case the Fed makes a surprise move.
Silver prices also moved higher, as seen in the chart of the iShares Silver Trust ETF (SLV). A break above the downward-sloping trendline and Friday's large gap up are positive for silver traders. If silver prices continue to rise, the series of lower highs could be behind the white metal—for a while, anyway.
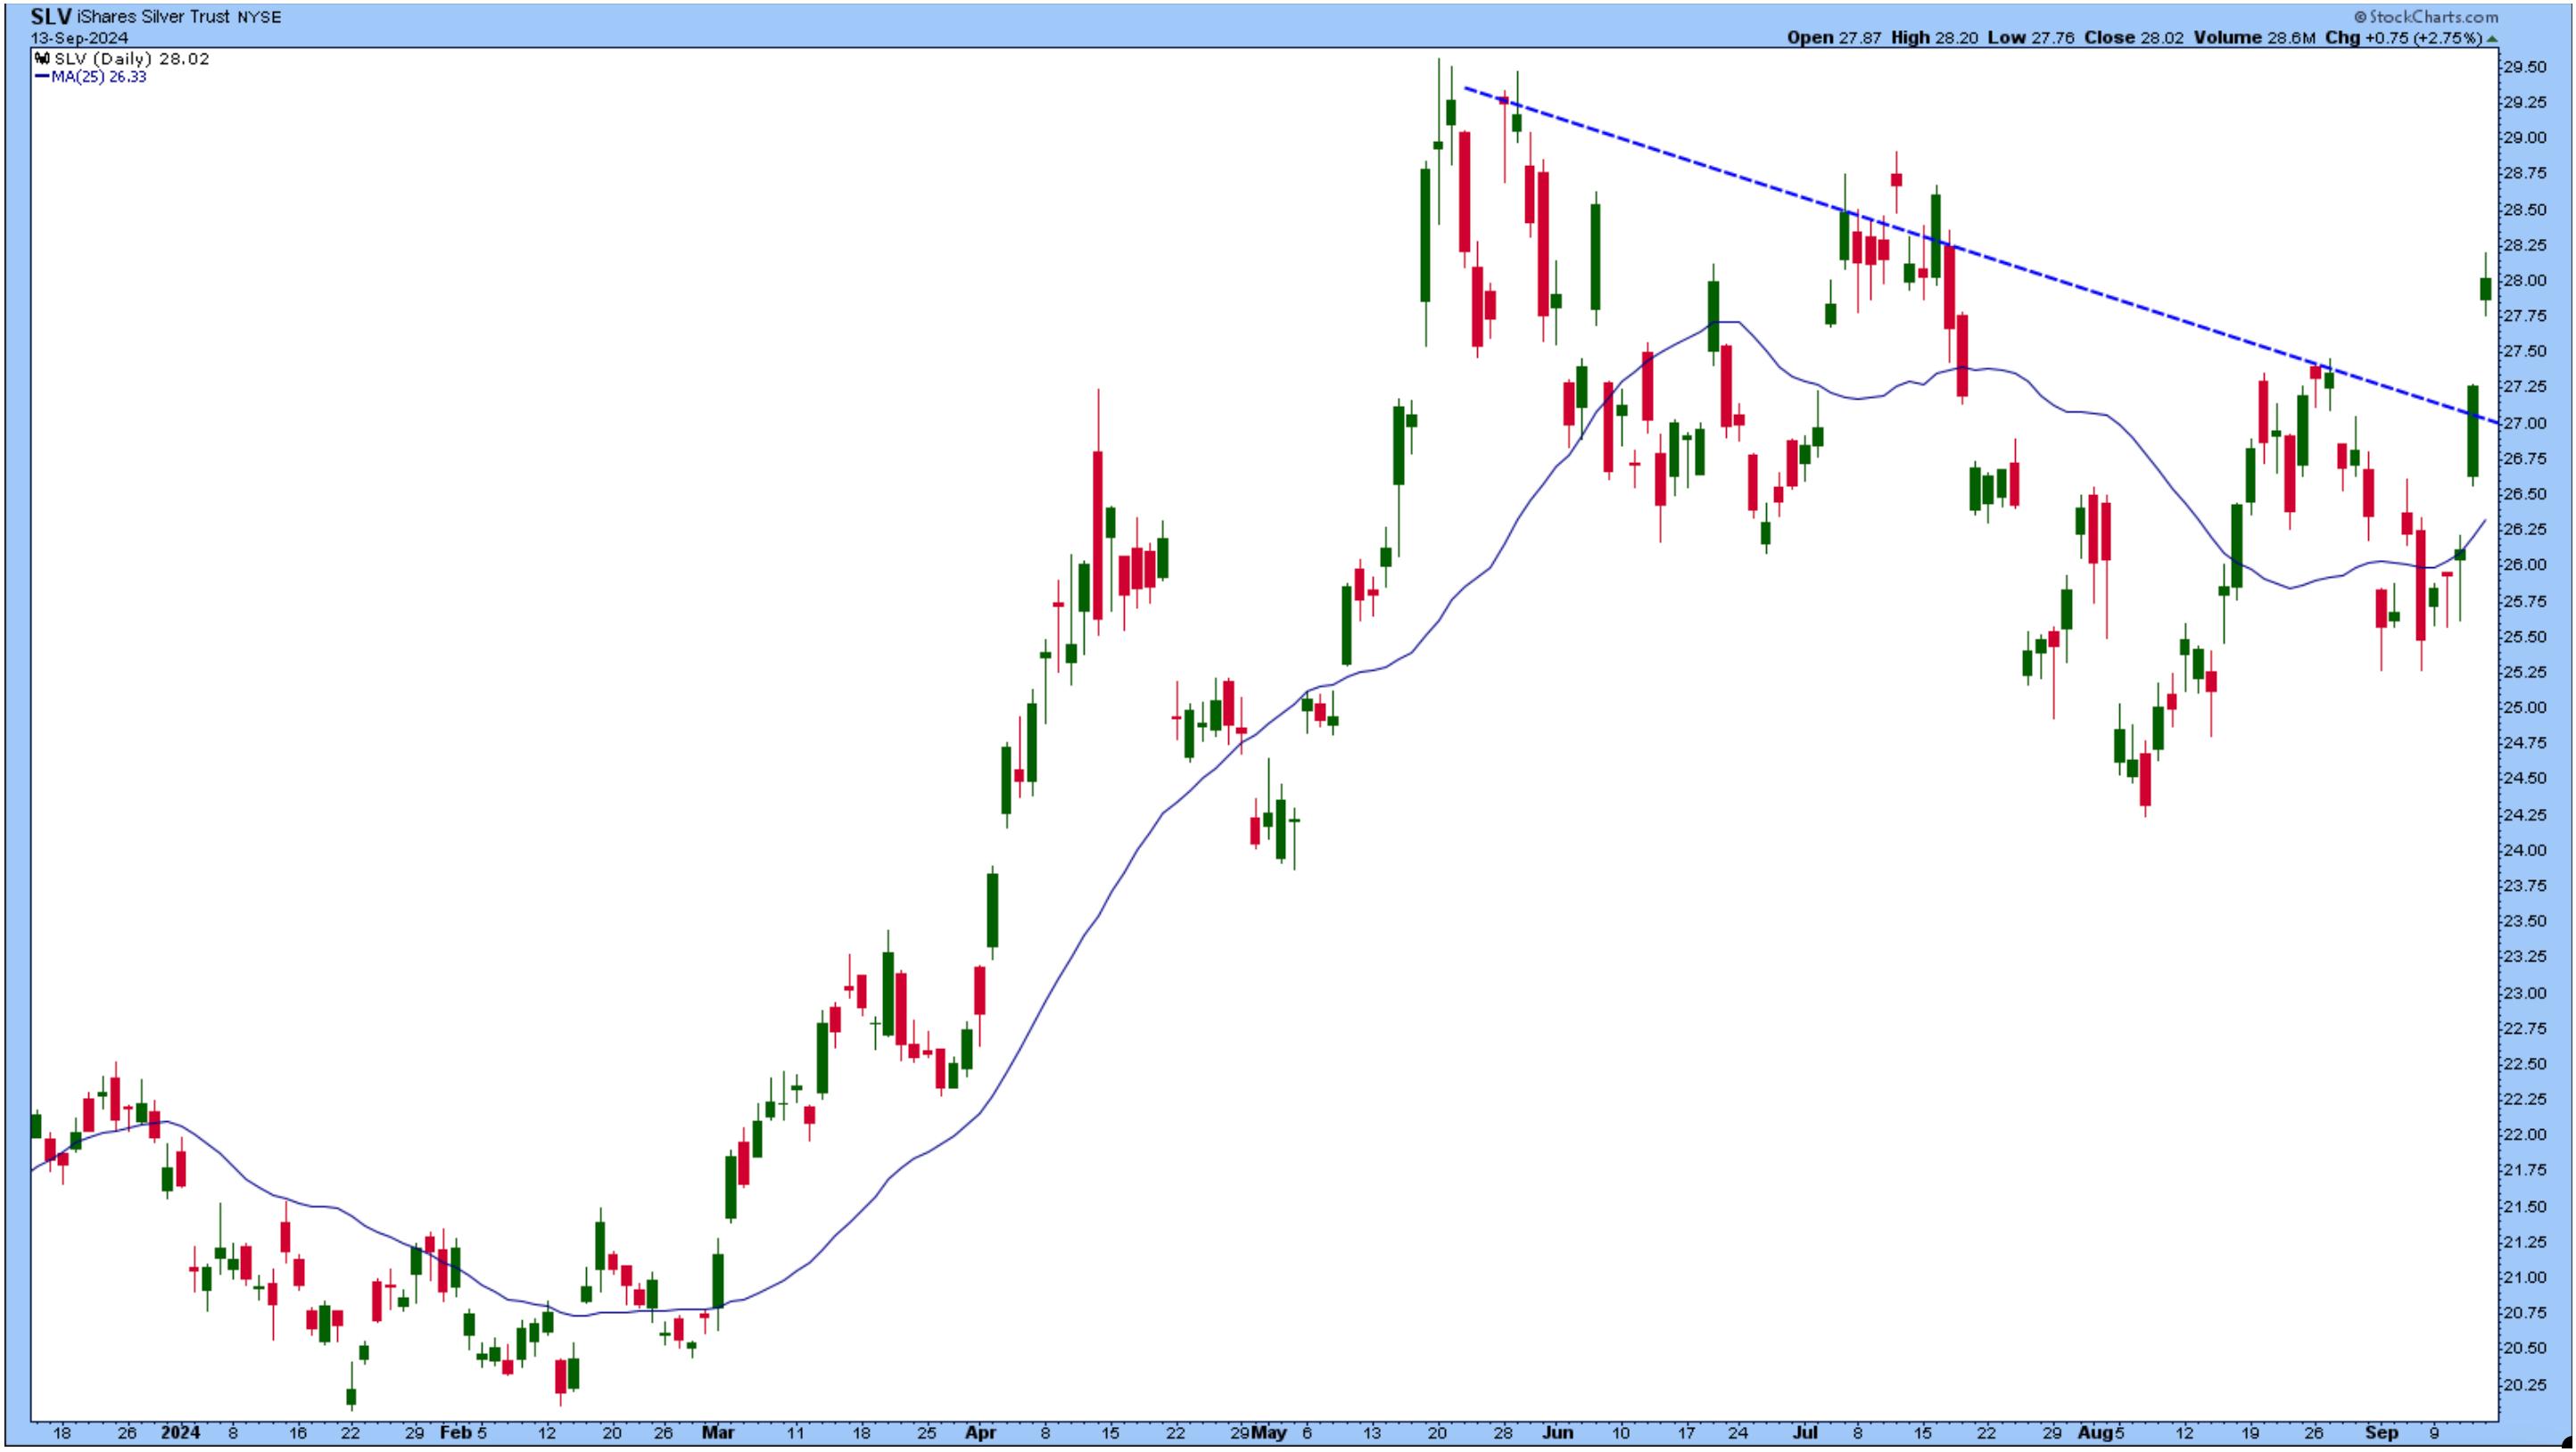
FIGURE 4. SILVER SURGES. SLV breaks above its downward-sloping trendline. Whether this upward move will continue rests on how much the Fed cuts rates in next week's FOMC meeting.Chart source: StockCharts.com. For educational purposes.
The only known market-moving event next week is—you guessed it—the FOMC meeting. Expectations of a 50 bps cut are rising. How much will the Fed cut? We'll know soon.
End-of-Week Wrap-Up
- S&P 500 closed up 4.02% for the week, at 5626.02, Dow Jones Industrial Average up 2.60% for the week at 41,393.78; Nasdaq Composite closed up 5.95% for the week at 17683.98
- $VIX down 26.01% for the week, closing at 15.56
- Best performing sector for the week: Technology
- Worst performing sector for the week: Energy
- Top 5 Large Cap SCTR stocks: Insmed Inc. (INSM); FTAI Aviation Ltd. (FTAI); Applovin Corp (APP); Cava Group (CAVA); SharkNinja, Inc. (SN)
On the Radar Next Week
- August Retail Sales
- August Housing Starts
- Fed Interest Rate Decision
- FOMC Economic Projections
- August Existing Home Sales
Disclaimer: This blog is for educational purposes only and should not be construed as financial advice. The ideas and strategies should never be used without first assessing your own personal and financial situation, or without consulting a financial professional.
Happy charting!


