TAKEAWAYS
- Stocks rebounded on Wednesday with wide trading ranges.
- Investors are rotating back into large-cap growth and momentum stocks.
- The Financial sector was hit hard by negative news from banks but made some recovery.
It was a massive turnaround day in the market on Wednesday—stocks sold off after the Consumer Price Index (CPI) data was released, but, after a couple of hours, rallied back to make up the losses and continue higher. The broader stock market indexes closed higher. The Nasdaq Composite ($COMPQ), S&P 500 ($SPX), and Dow Jones Industrial Average ($INDU) had a very wide range day, with the Nasdaq ahead of the pack closing higher by 2.17%.
On Wednesday, the Tech sector was the top performer, followed by Consumer Discretionary and Communication Services. The underperforming sectors were Energy, Consumer Staples, and Financials.
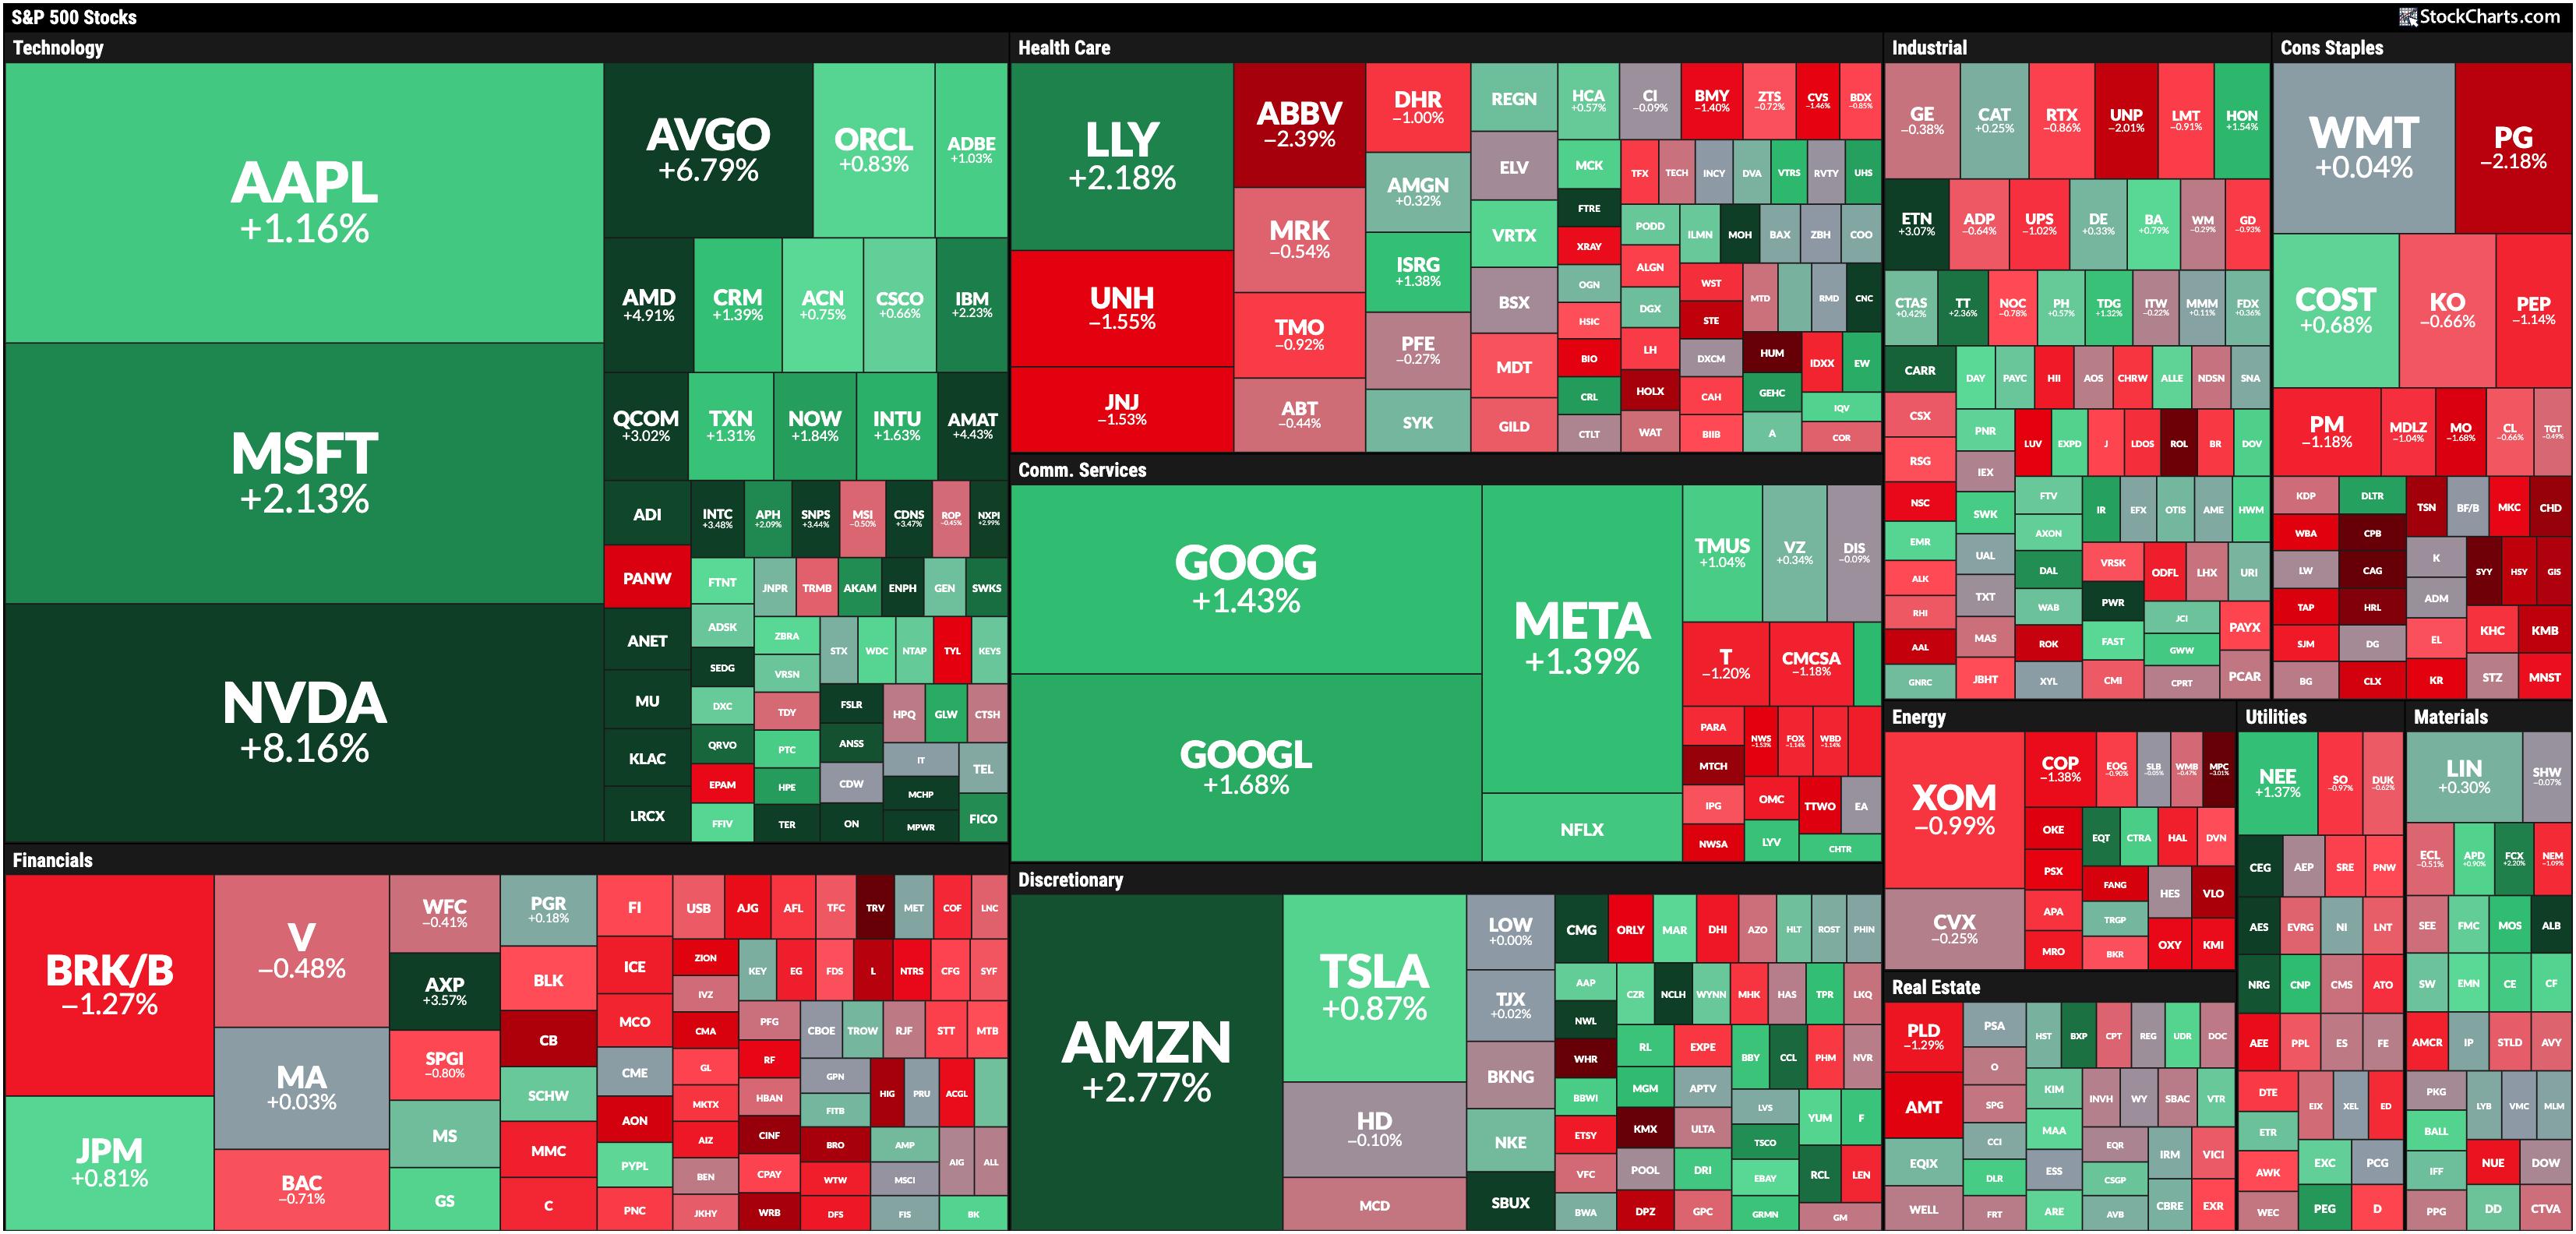
FIGURE 1. WEDNESDAY, SEPT. 11, MARKETCARPET. Tech stocks made a comeback today. Are investors rotating back to mega-cap tech stocks?Image source: StockCharts.com. For educational purposes.
Financials Pull Back
Financials are losing steam after their big run. Investors were stoked about this sector since interest rate cuts were a possibility. But there has been a sell-off in financial stocks, and yesterday's largely negative comments from JP Morgan Chase (JPM), Goldman Sachs (GS), and Ally Financial (ALLY) worsened the situation. This spilled over into Wednesday morning's trading. The Financial Select Sector SPDR Fund (XLF) fell to a low of $43.38, but, similar to the broader market indexes, it recovered and closed at $44.28. The sentiment shift isn't obvious in XLF, but I will watch the chart closely because buying pressure could come back.
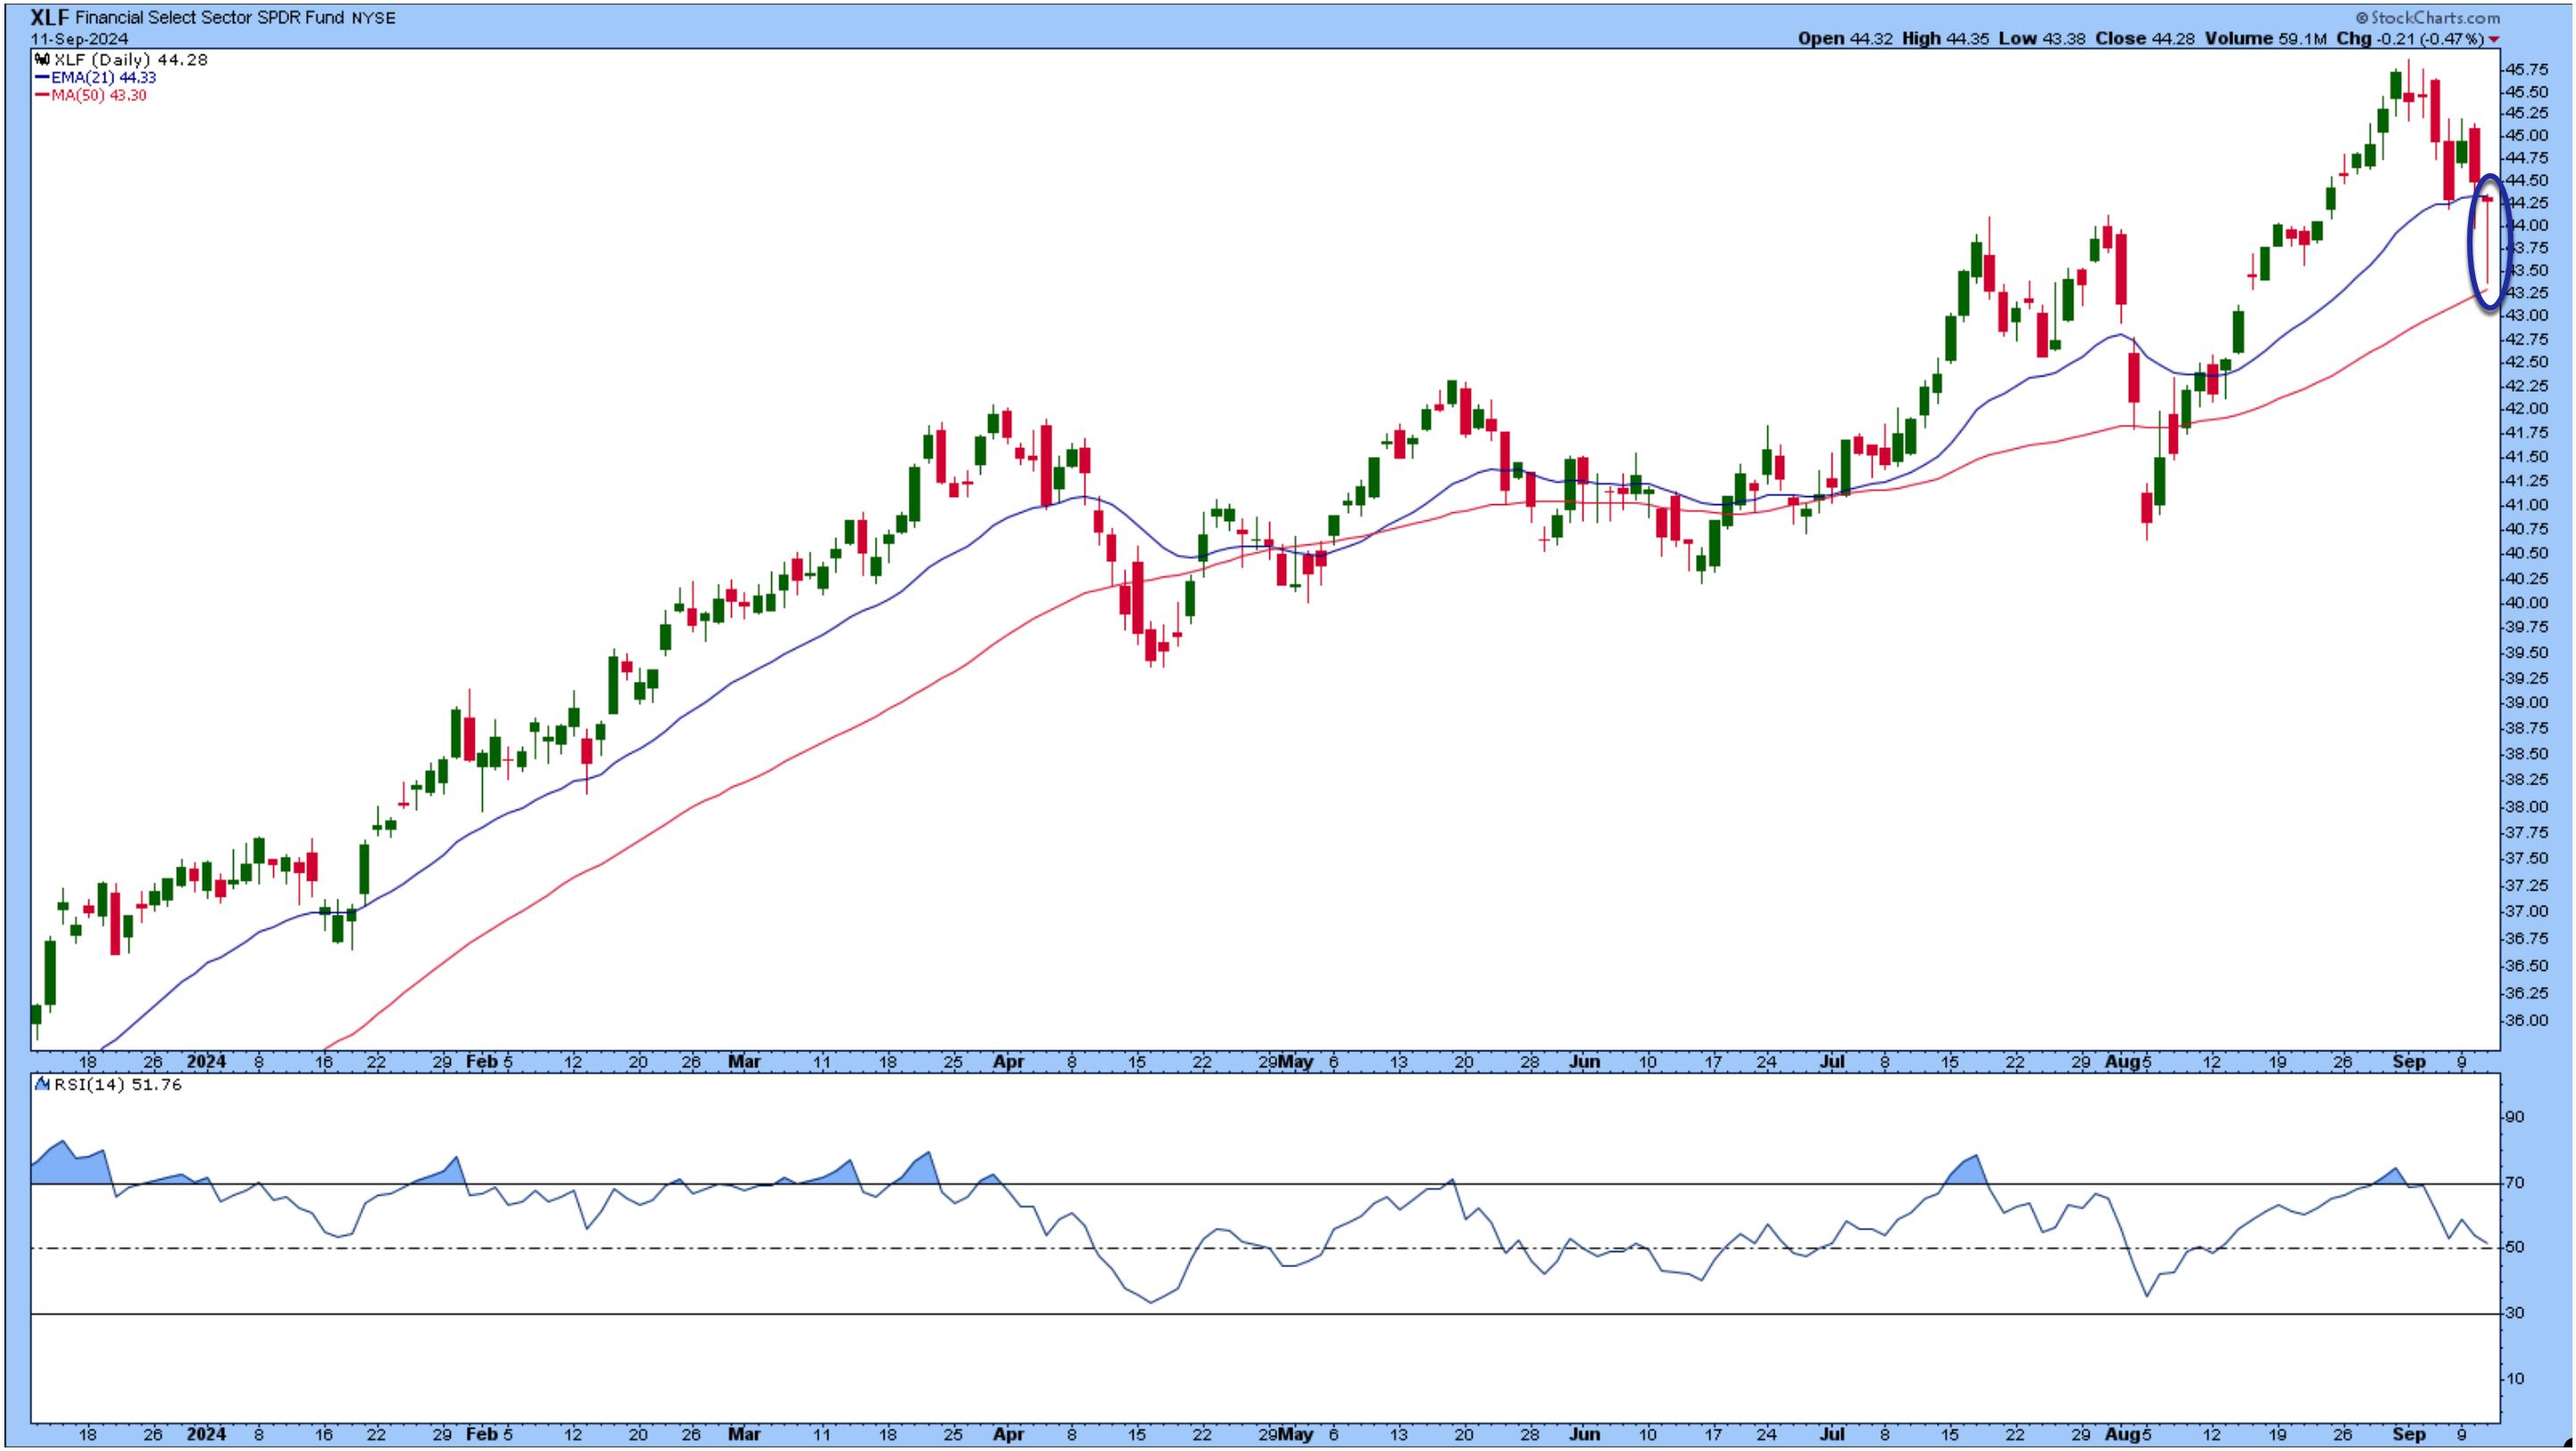
FIGURE 2. A PULLBACK IN FINANCIALS. Negative comments from banks hurt the Financial sector, but XLF recovered after a selloff. Will it maintain its uptrend?Chart source: StockCharts.com. For educational purposes.
Technically, XLF's chart doesn't look terrible, but it's not as great as it once was. XLF almost hit its 50-day simple moving average (SMA), bounced back, and closed at its 21-day EMA. It could continue to be shaky for some time.
The relative strength index (RSI) is at 51.76, but is declining. XLF could go either way here. The positive for the ETF is that interest rates will come down this year, which could boost financial stocks.
Financial stocks aside, could Wednesday's move confirm a shift toward bullish sentiment?
The Broader Markets
The daily chart of the S&P 500 shows that the index closed above its 21-day EMA and market breadth conditions are improving. The percentage of S&P 500 stocks above their 50-day moving average is at 66.60 and the Advance-Decline Line is maintaining its uptrend.
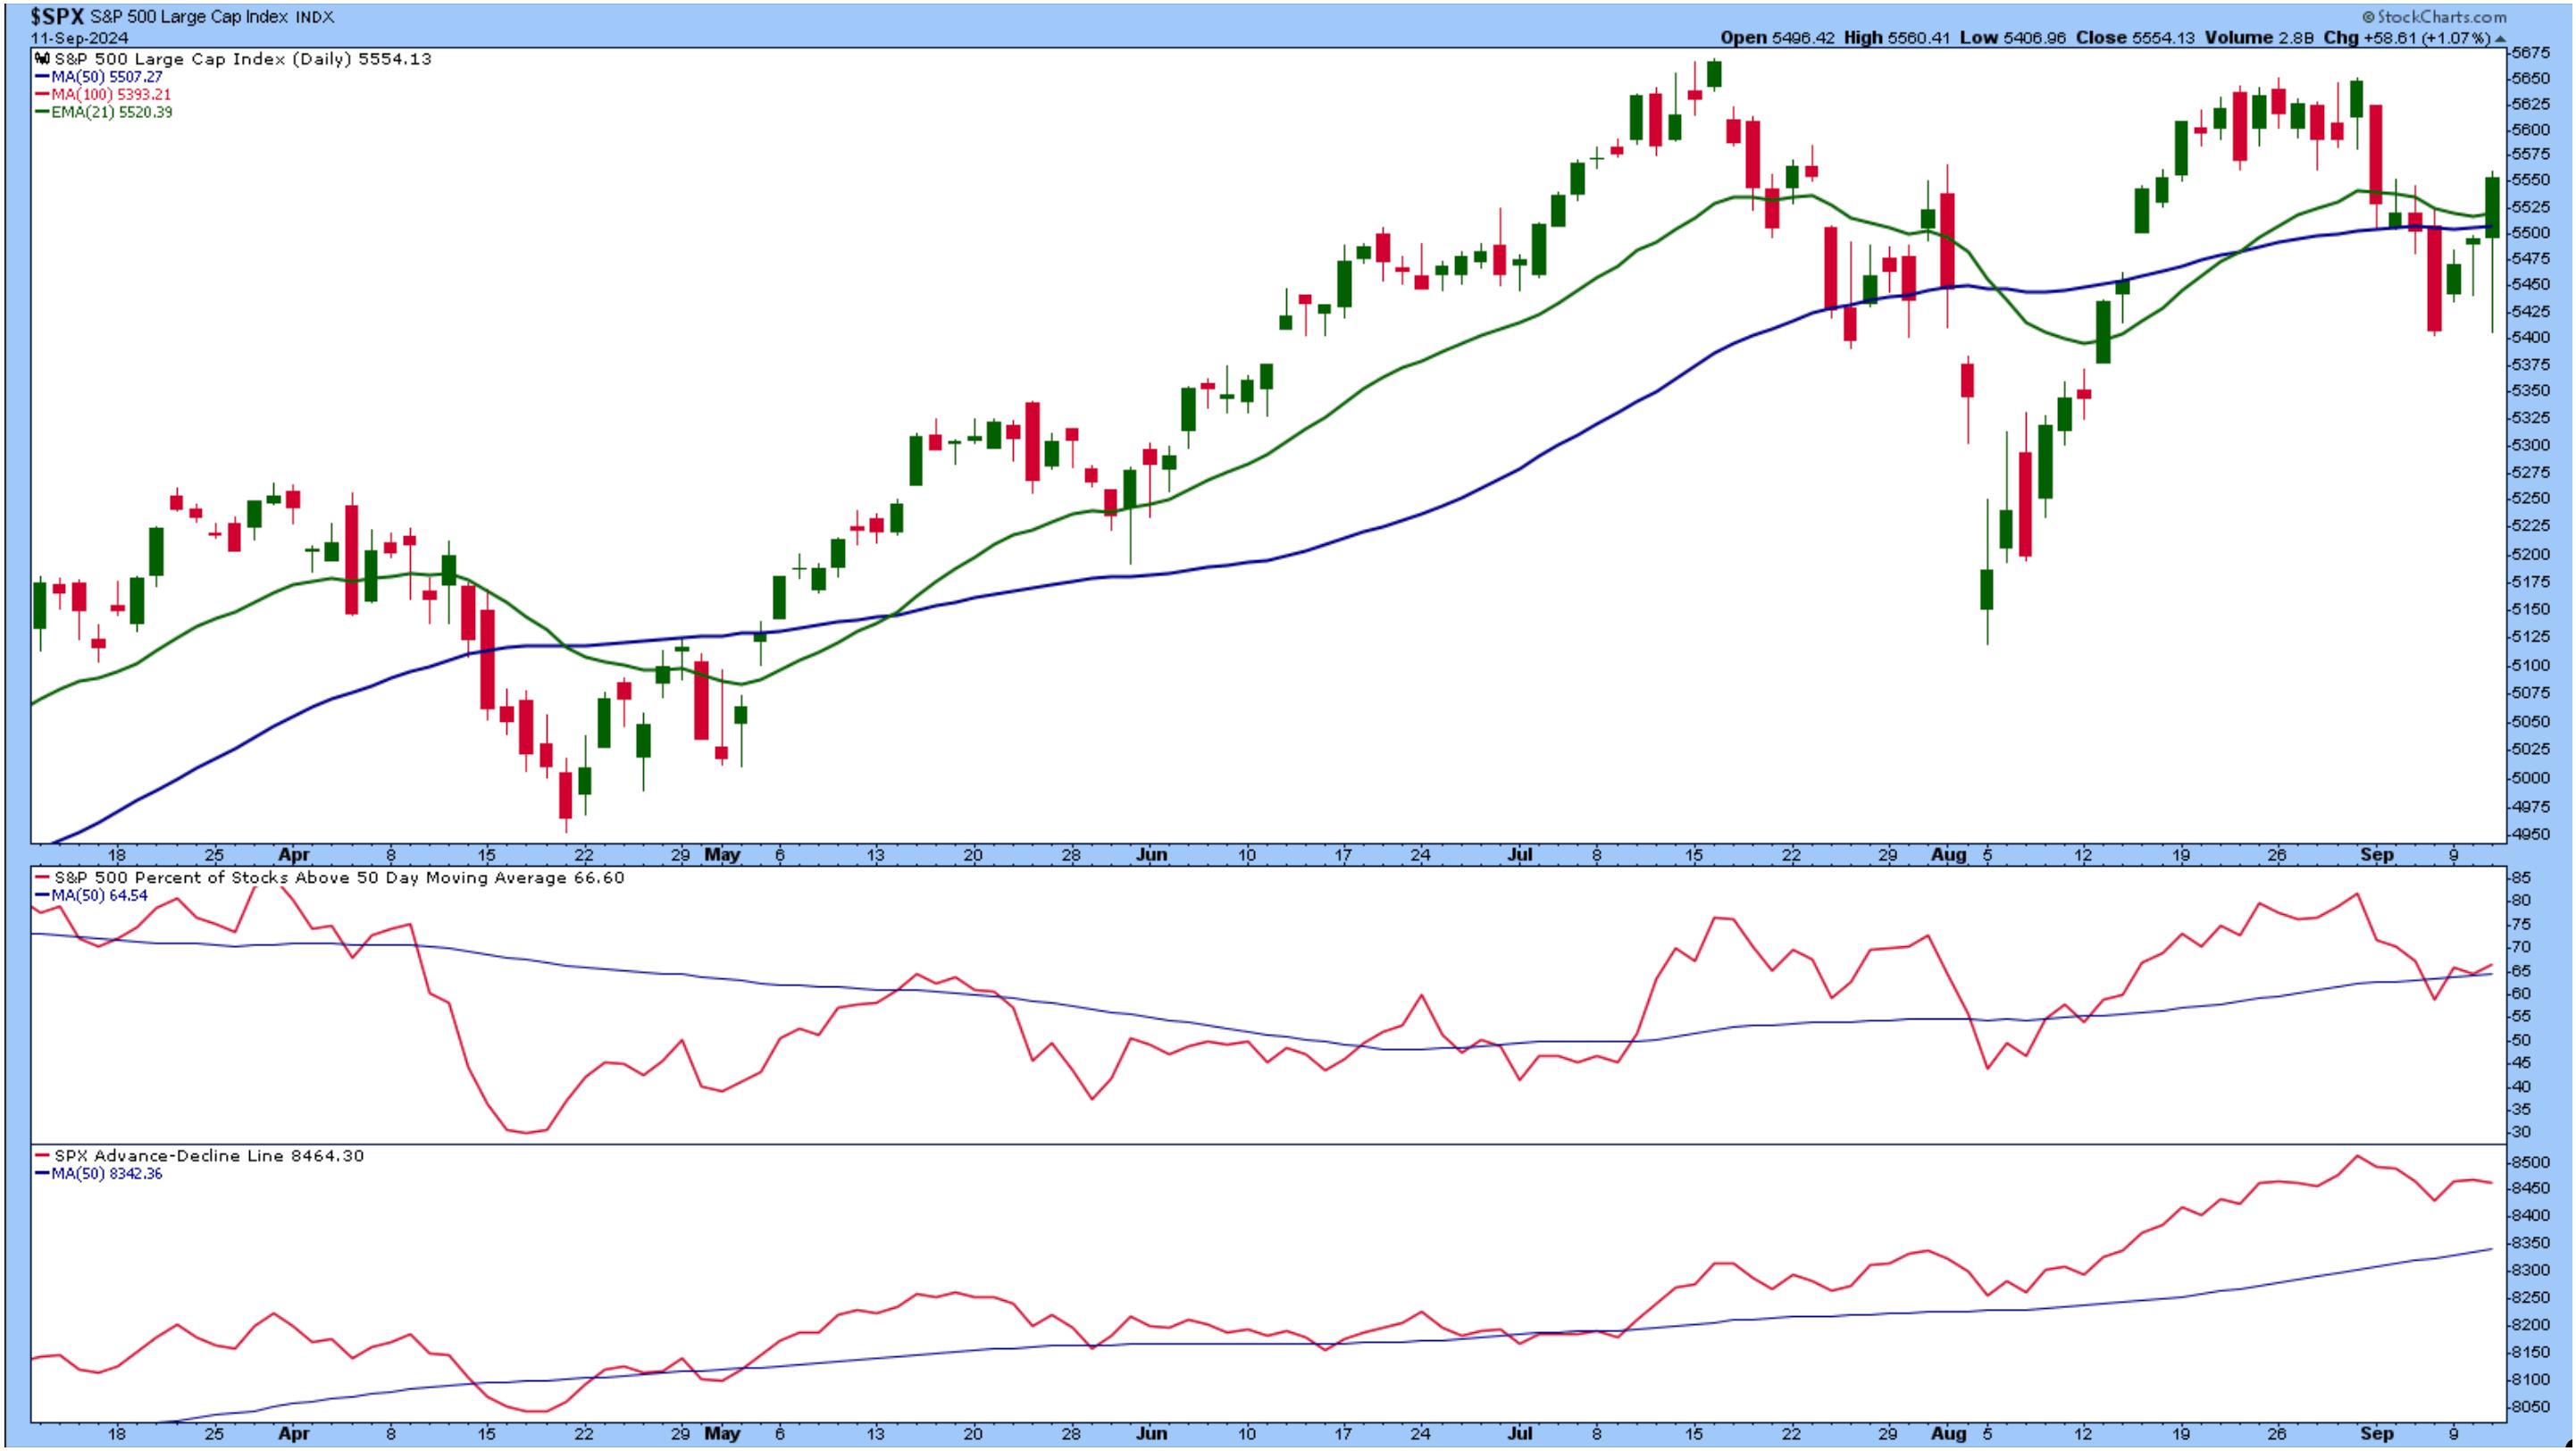
FIGURE 3: TURNAROUND IN S&P 500. After selling off in the first few hours of the trading day, the S&P 500 recovered all its losses and continued to rise, ending with a strong finish.Chart source: StockCharts.com. For educational purposes.
The StockCharts Market Factors widget (in your Dashboard data panels) shows that large-cap growth and momentum stocks were up the most today. In yesterday's post, I discussed the SPDR S&P 500 Growth ETF (SPYG) and would like to revisit the chart.
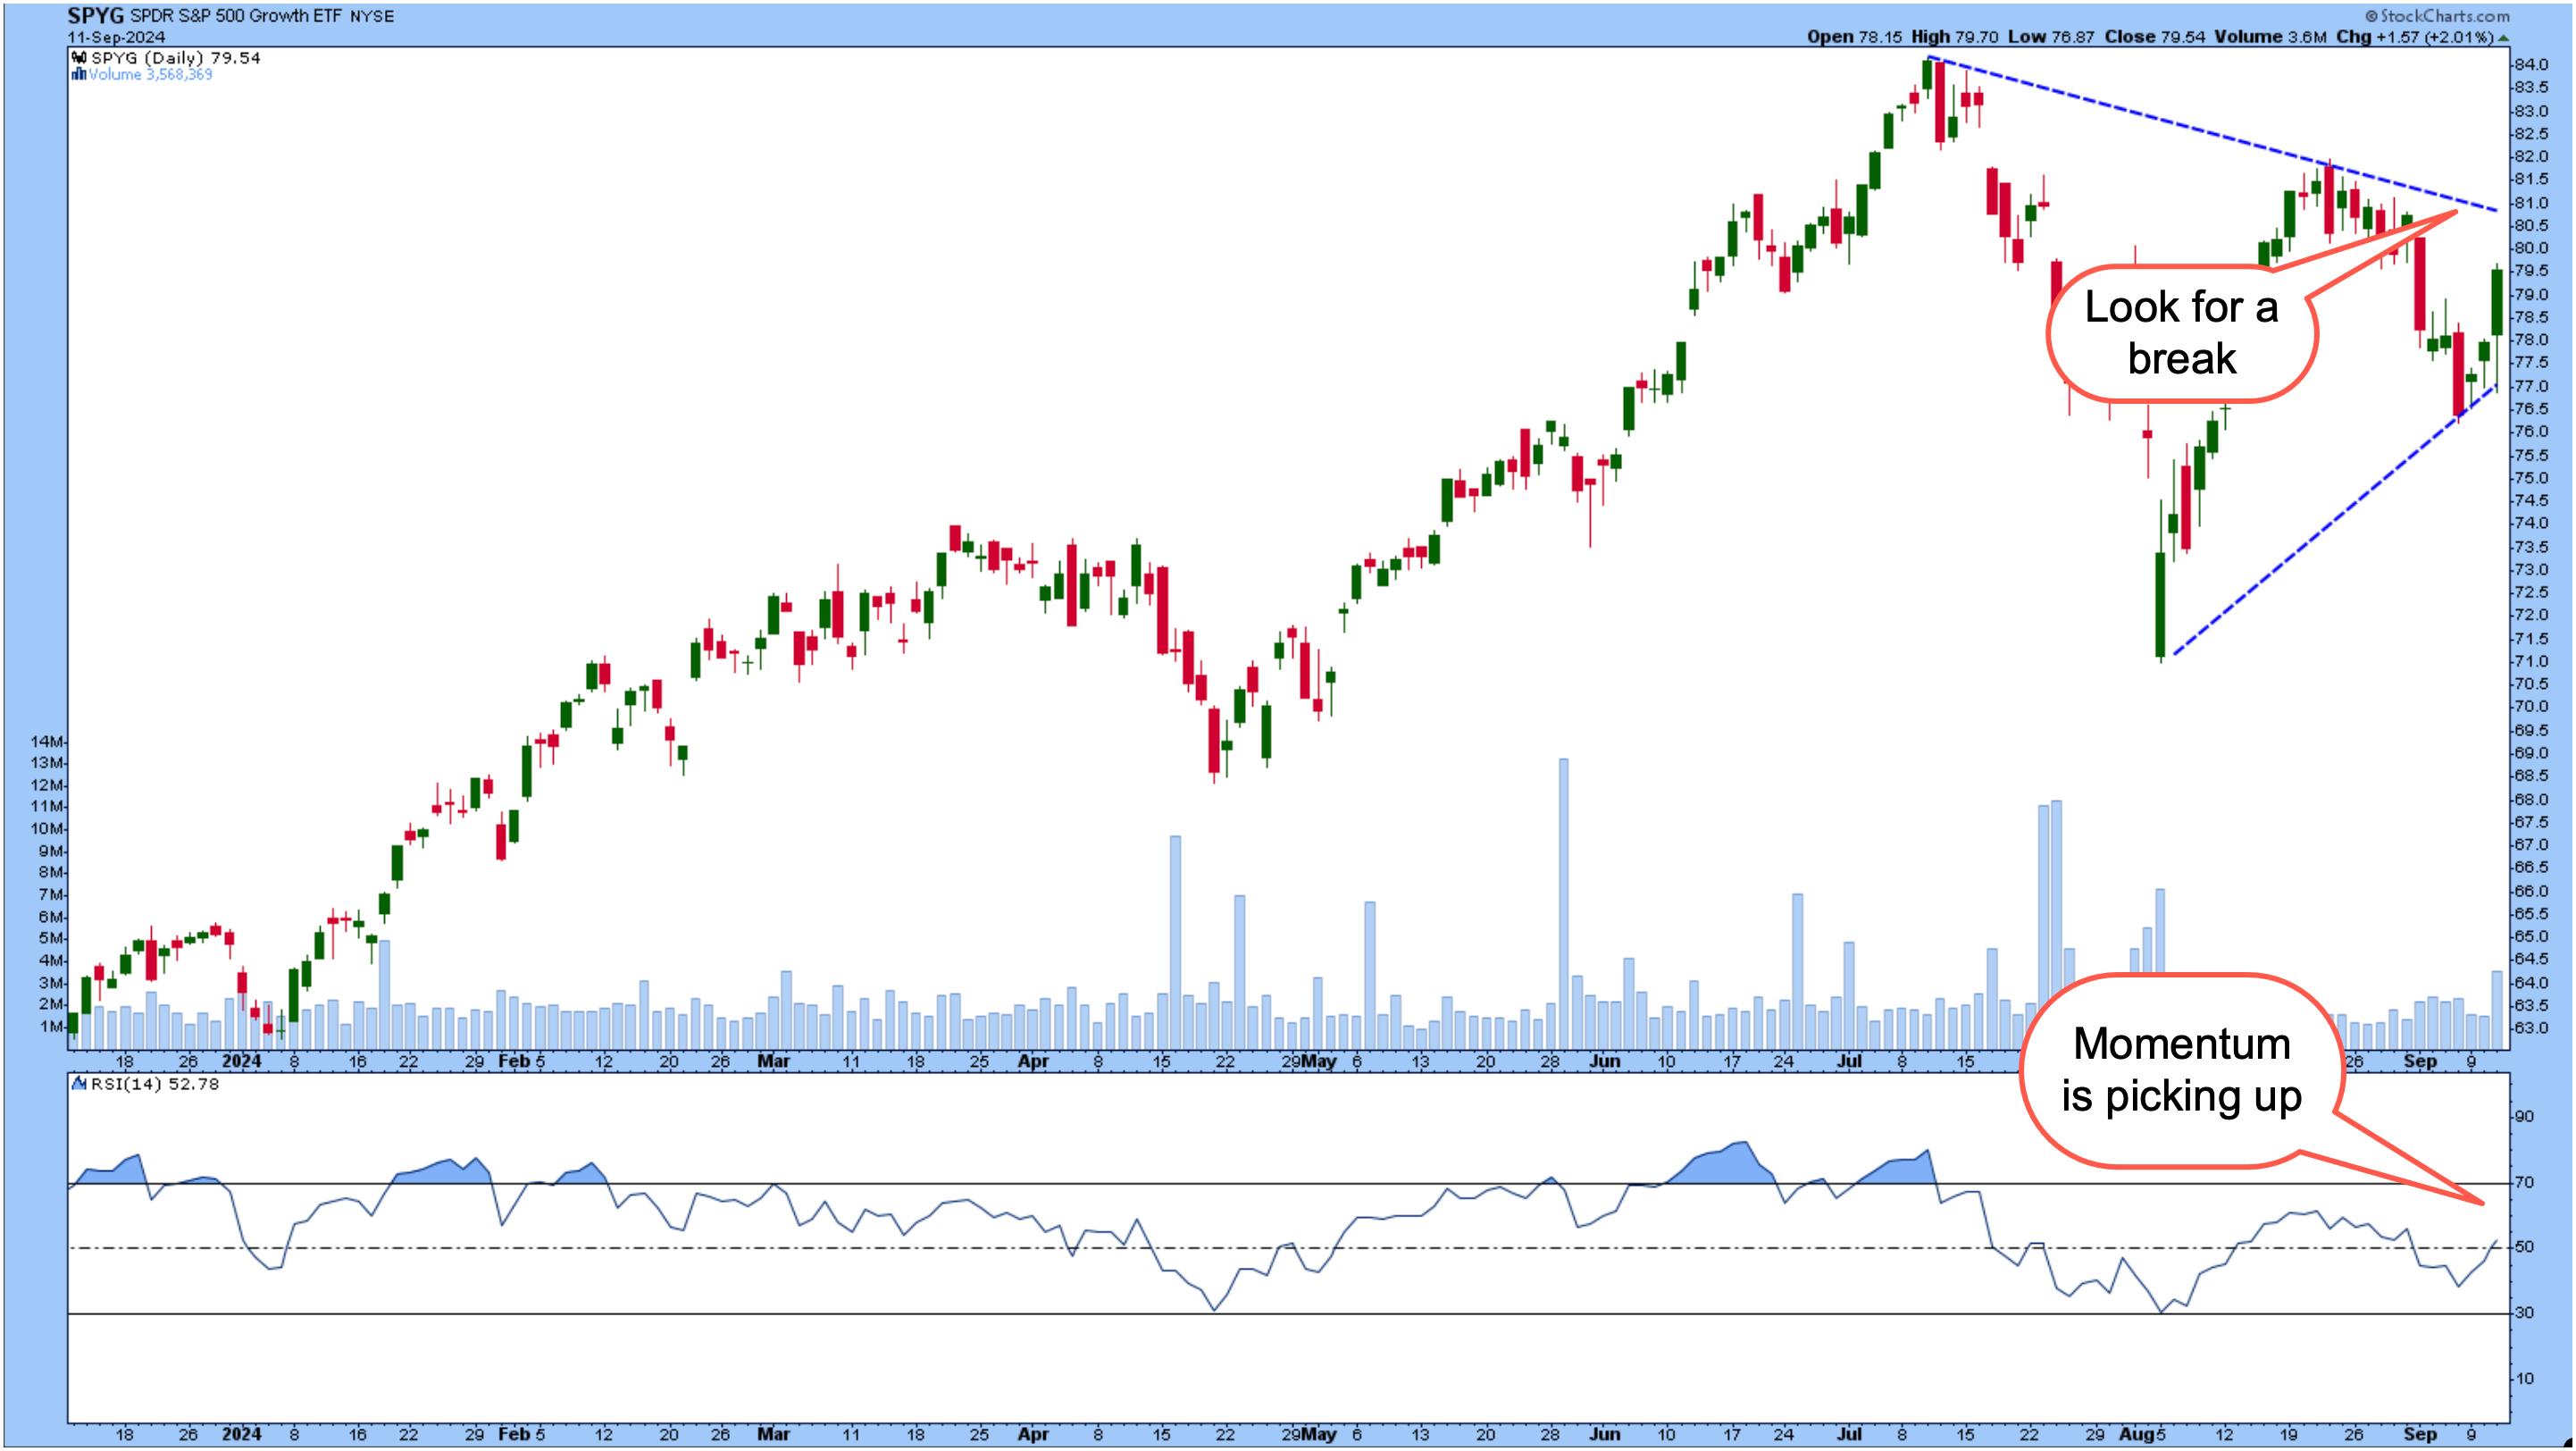
FIGURE 4. SPYG MADE A SIGNIFICANT UPSIDE MOVE. The ETF still has to break above the upper trendline to confirm an upside move. Momentum is picking up, and an uptrend could resume if it continues.Chart source: StockCharts.com. For educational purposes.
Wednesday's significant upward move indicates that sentiment is shifting toward large-cap growth stocks. If the momentum continues, SPGY could break above the upper trendline. The RSI is also trending higher. Right now, the technical picture looks positive for large-cap growth stocks.
Closing Bell
This week, more macroeconomic data, including the Producer Price Index (PPI) and Michigan Consumer Sentiment, will be released. Will they move the needle in the opposite direction? That's something to watch for in the next couple of days.

Disclaimer: This blog is for educational purposes only and should not be construed as financial advice. The ideas and strategies should never be used without first assessing your own personal and financial situation, or without consulting a financial professional.
Happy charting!
