TAKEAWAYS
- The real estate sector gains ground as interest rate cuts loom.
- Technology stocks are showing slight gains, but not enough to shift momentum.
- Energy prices slide lower on weakened demand.
The Real Estate sector took the lead in Tuesday's trading, probably because interest rate cuts are approaching. Technology and Consumer Discretionary took second and third place, respectively.
Overall, it was a pretty quiet trading day except for the energy sector, which showed the biggest decline. The Energy Select Sector SPDR Fund (XLE), the StockCharts proxy for the Energy sector, declined 1.75%.
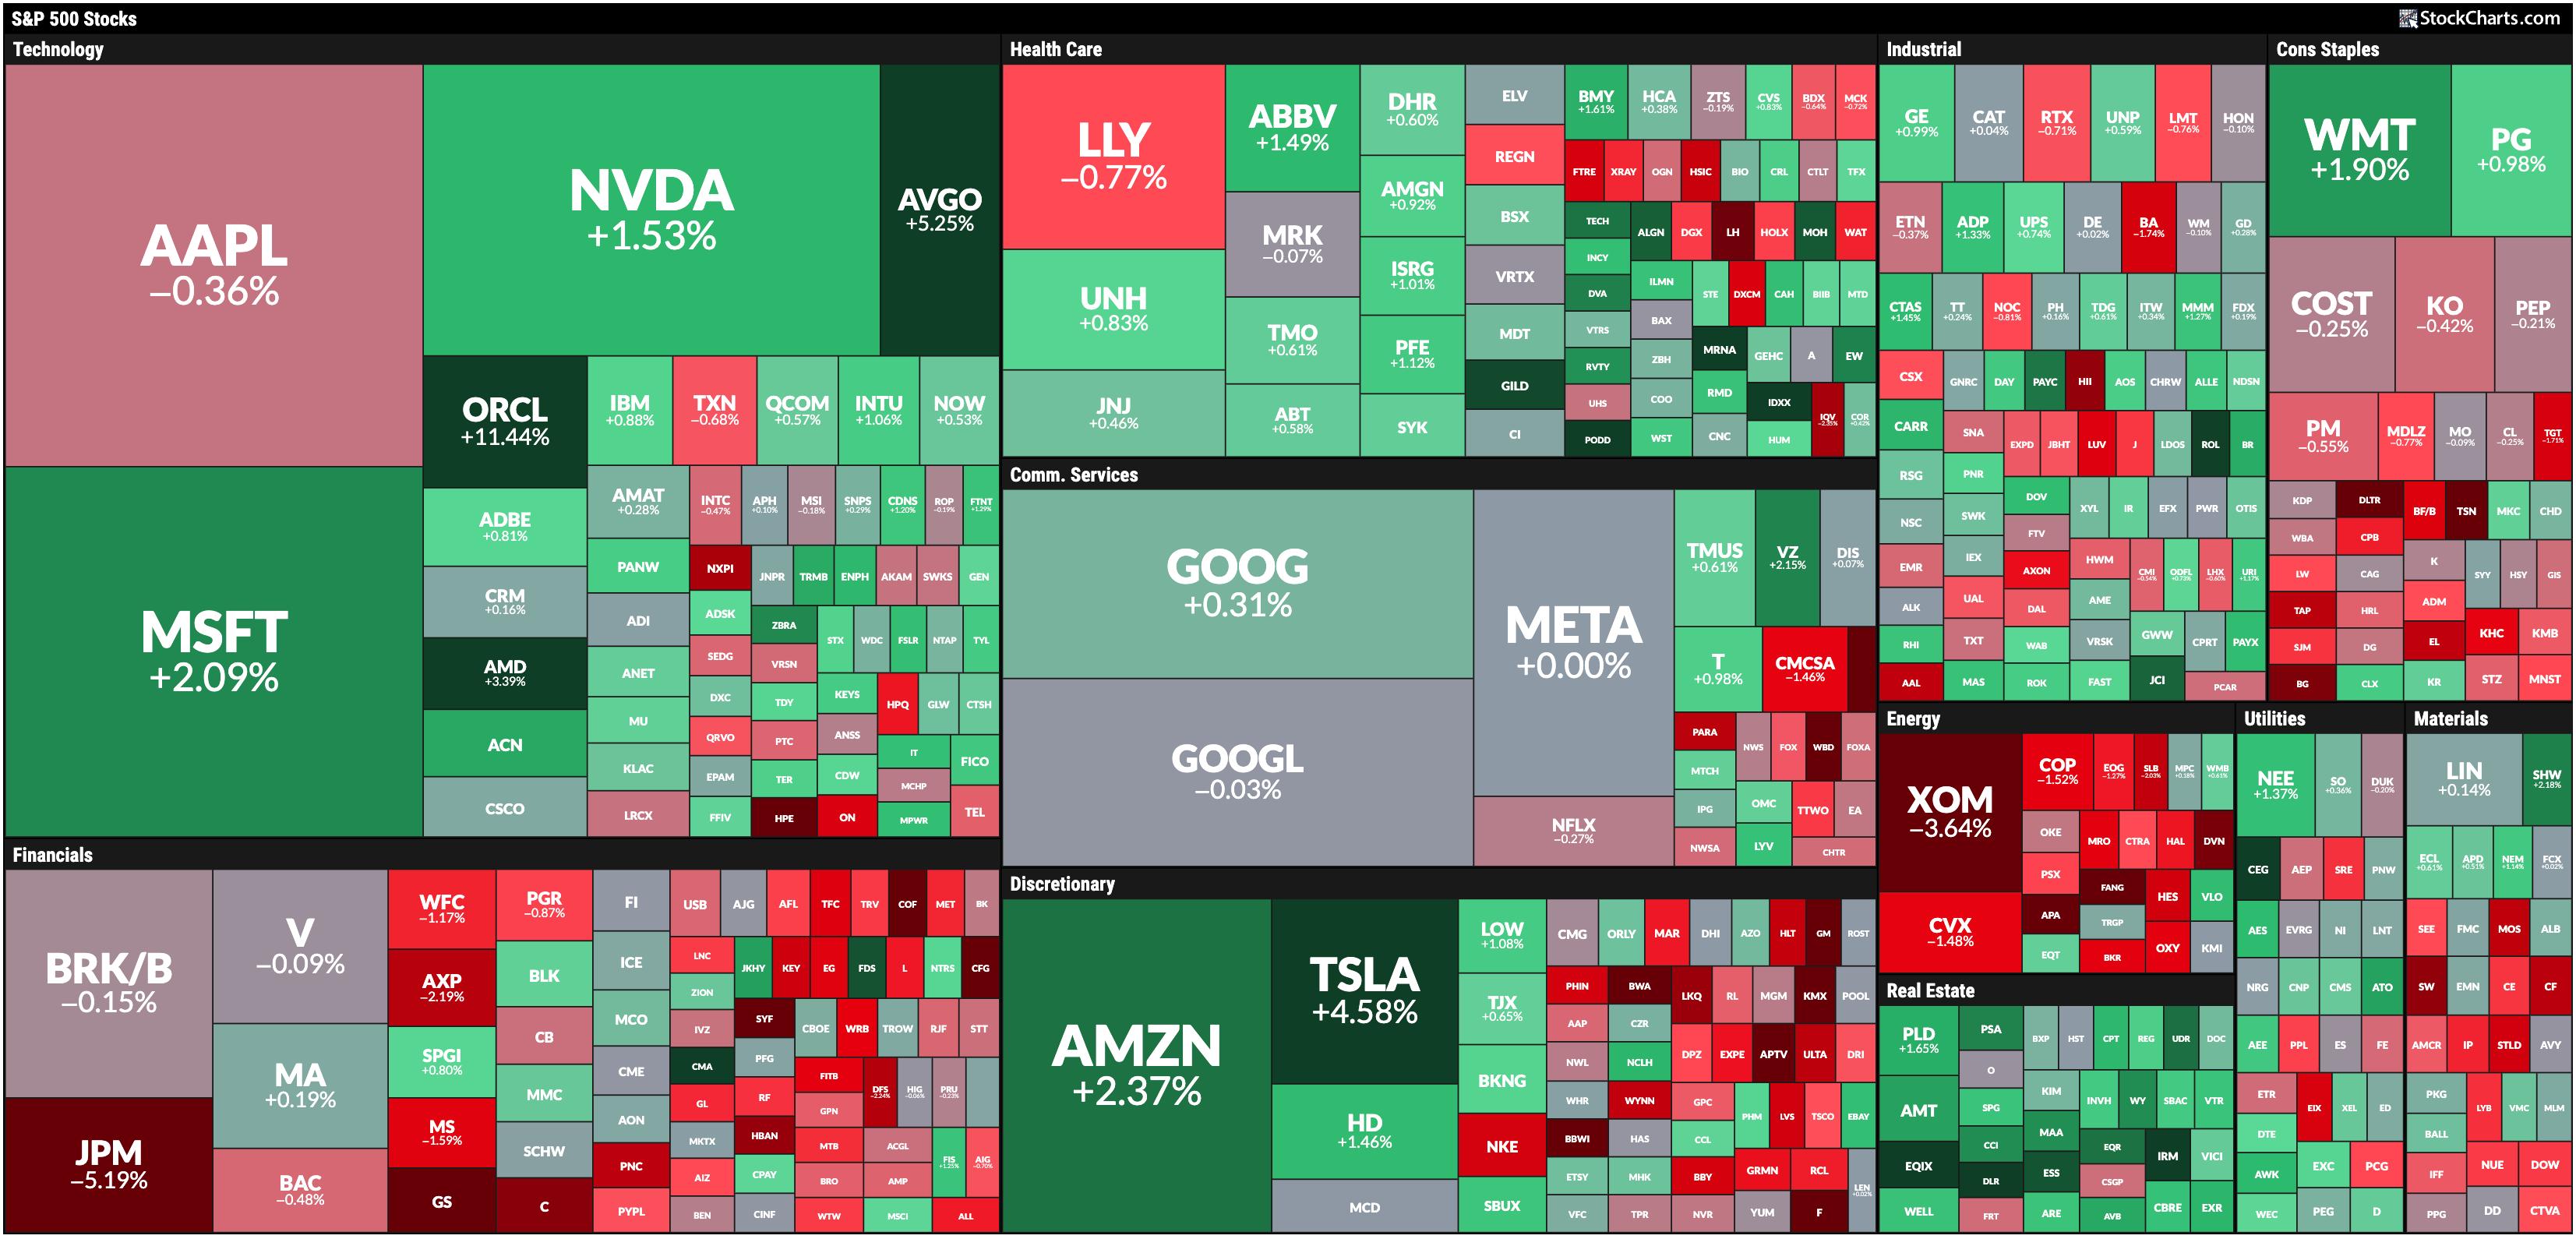
FIGURE 1. SEPTEMBER 10, 2024 MARKETCARPET. Real Estate was the leading sector, followed by Technology and Consumer Discretionary. Energy was the laggard.Image source: StockCharts.com. For educational purposes.
It looks like investors are slowly rotating back into large-cap growth stocks just in case the asset class quickly trends higher. At the same time, investors aren't losing sight of the FOMC September 18 meeting, in which the Fed is expected to cut interest rates by at least 25 basis points. A rate cut would favor the Real Estate sector, since lower interest rates encourage borrowing, which could increase real estate sales.
Real Estate Pushes Higher
The Real Estate Select Sector SPDR Fund (XLRE) chart below shows that the ETF set a new two-year high on Tuesday.
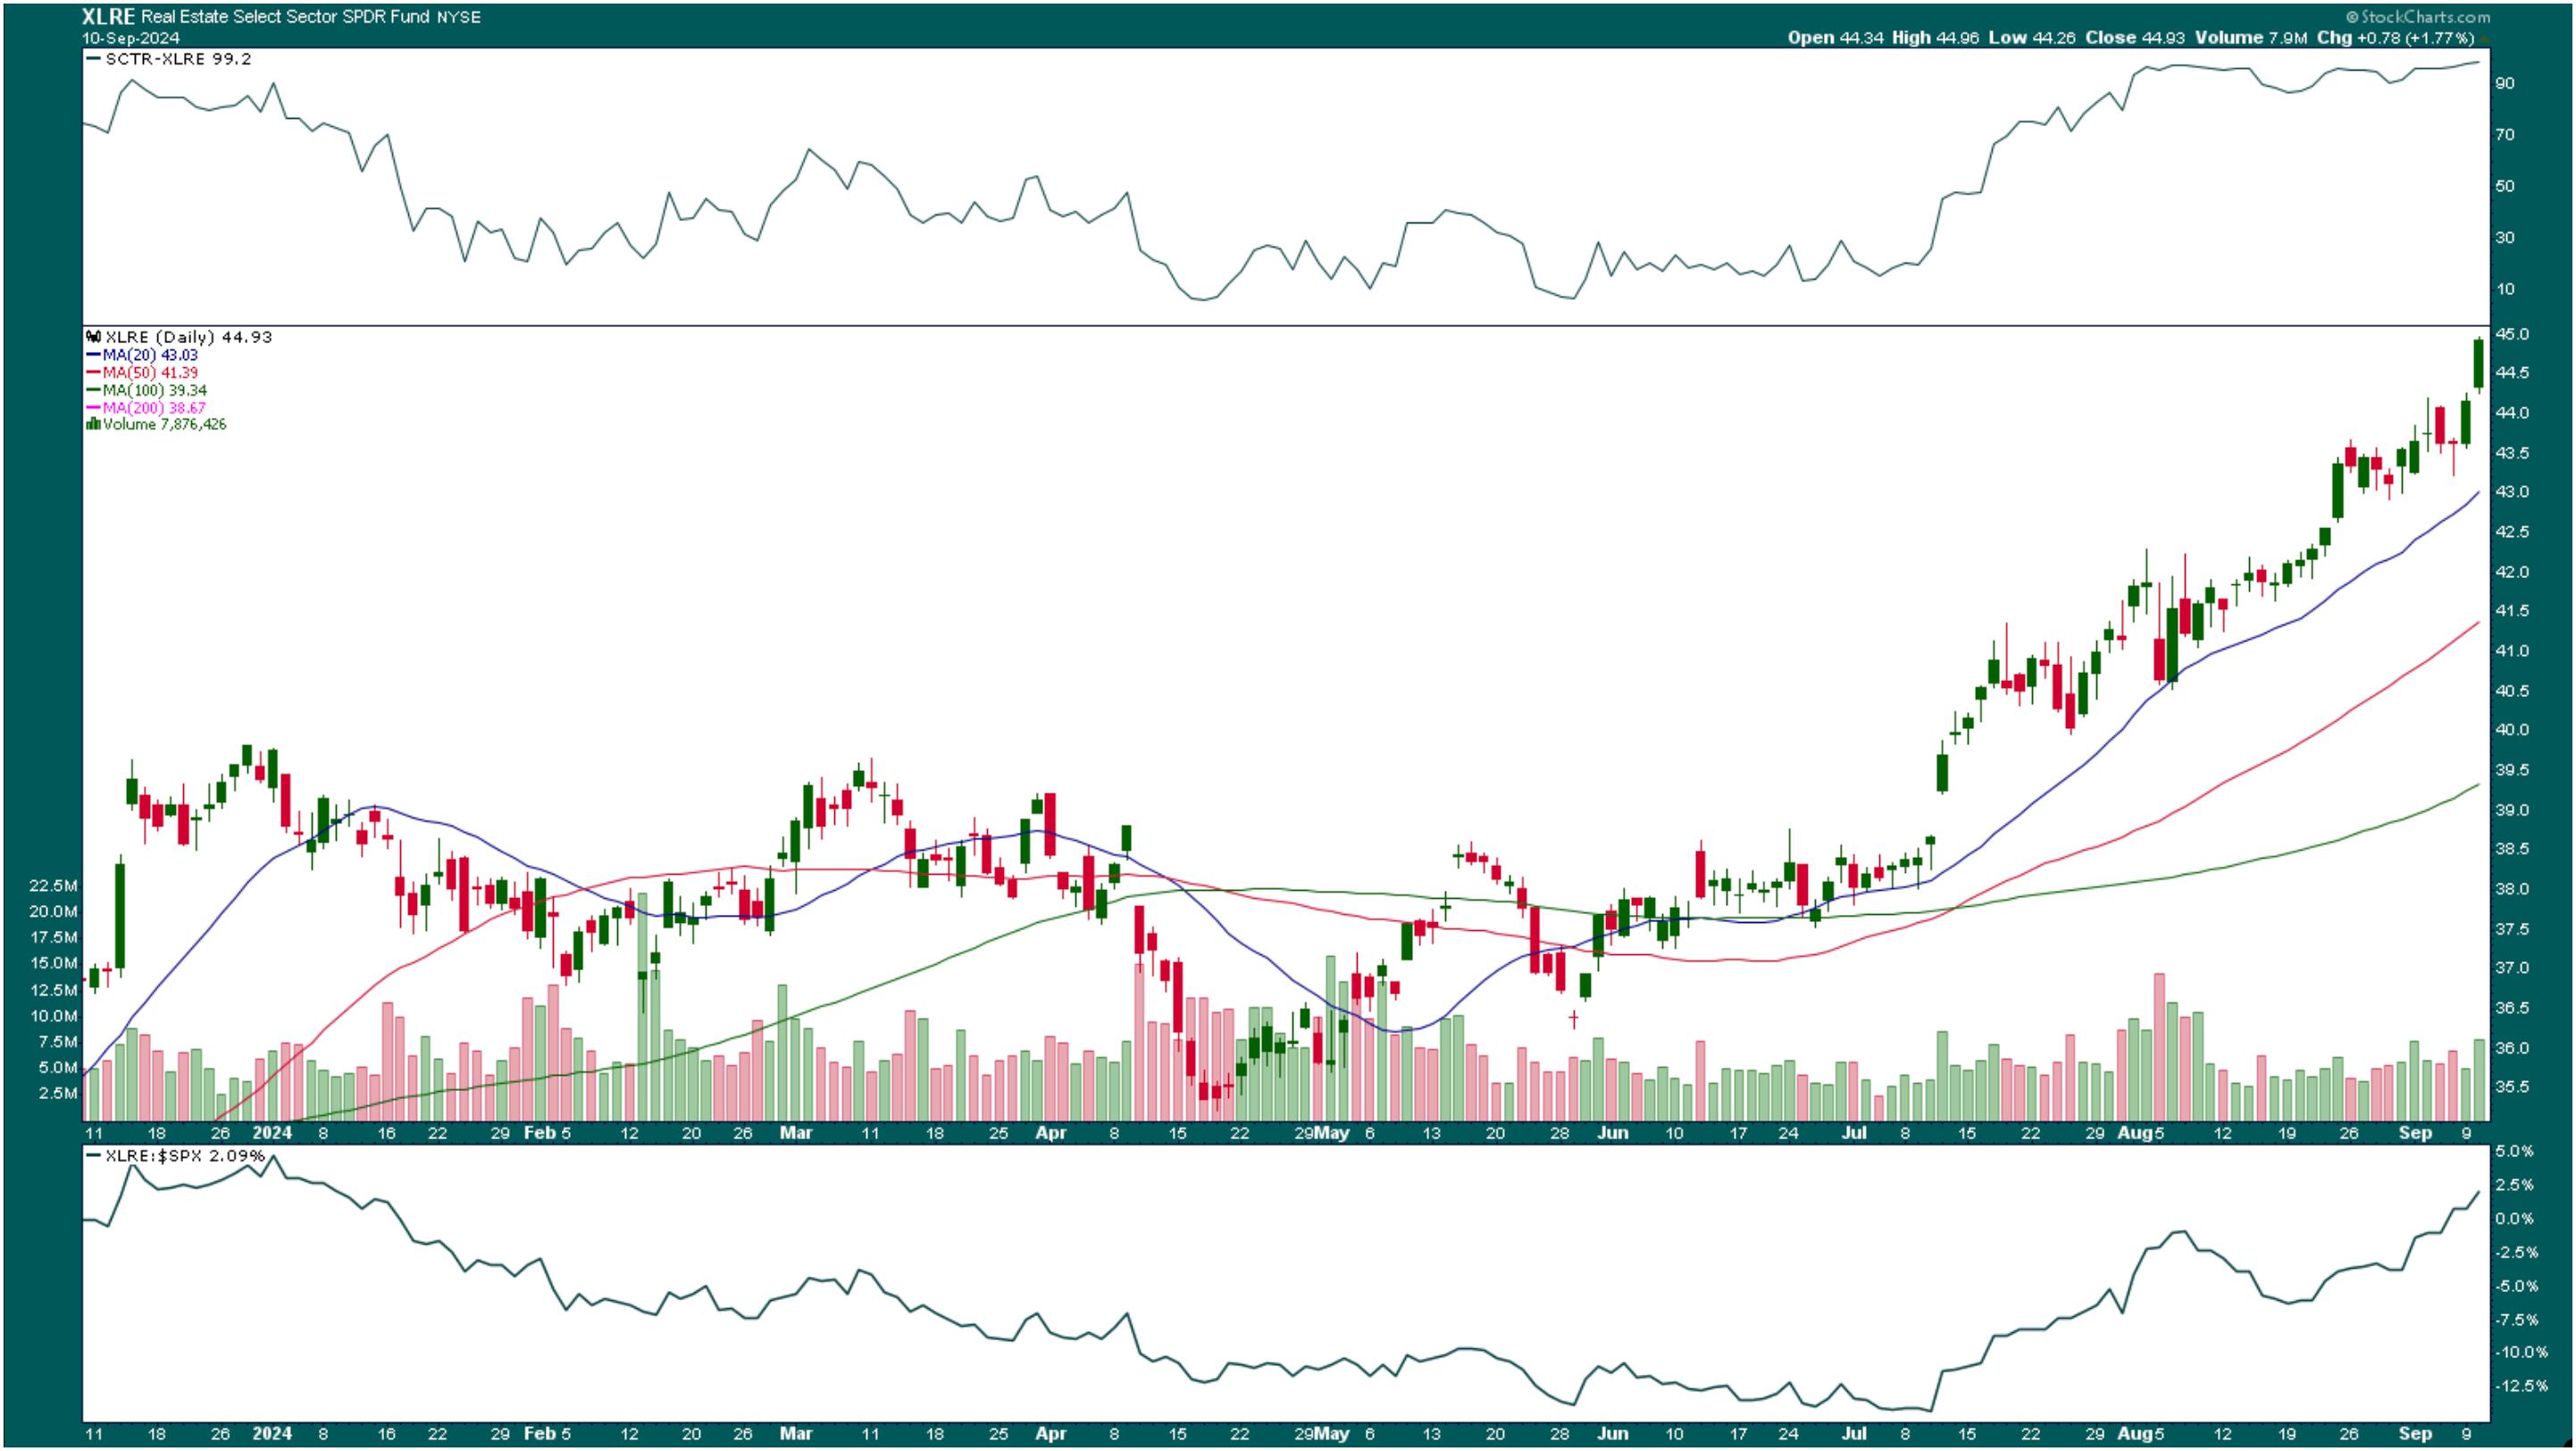
FIGURE 2. CHART OF REAL ESTATE SELECT SECTOR SPDR FUND (XLRE). The ETF is trading above its 50-day moving average, with a SCTR score of 99.2 and relative performance against the S&P 500 edging higher.Chart source: StockCharts.com. For educational purposes.
XLRE is trading above its 20-day simple moving average (SMA), and the StockCharts Technical Rank (SCTR) score is at 99.2. XLRE's relative performance against the S&P 500 ($SPX) is at 2.09%, which is slightly higher than the large-cap index, but there is potential for it to rise further.
CPI and Large-Cap Growth Stocks
The August CPI data is expected to rise 2.6% year-over-year and core CPI is expected to rise 3.2%. Investors will closely watch the data when it's released Wednesday morning before the open. The CPI will give insight into how much of an interest rate cut to expect at the FOMC meeting, which could cause some waves in tomorrow's trading. We could see a switcheroo in tomorrow's MarketCarpet or a continuation of the same, with more buying pressure in the large-cap growth stocks.
Looking at the Market Factors widget in one of the Dashboard panels, the large-cap growth factor was Tuesday's top gainer, with a 0.48% rise.
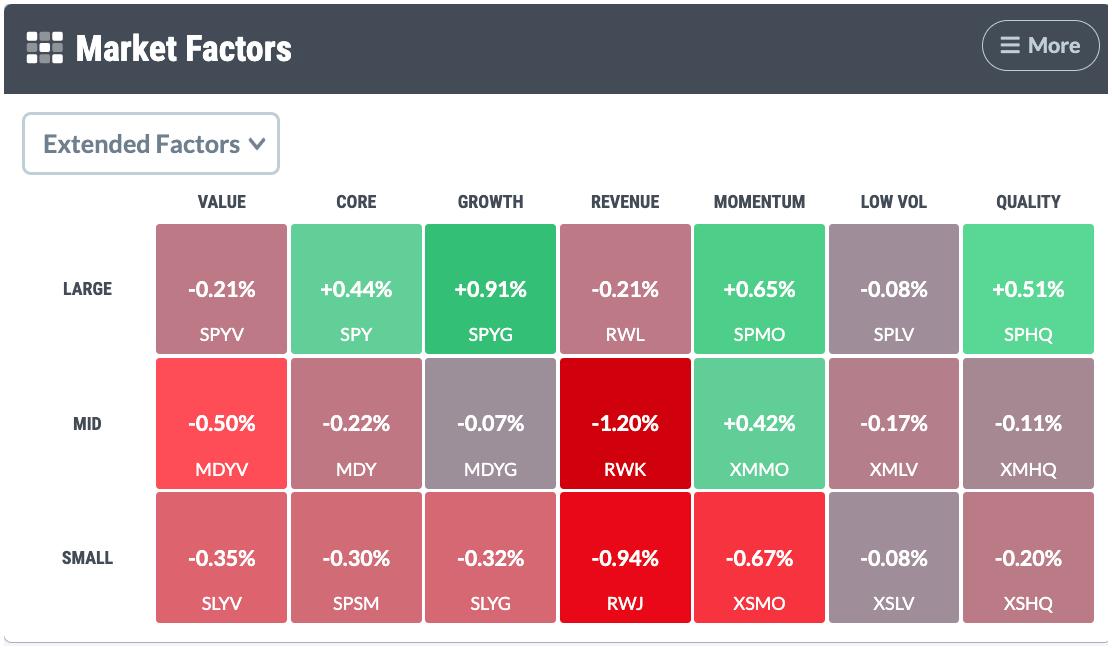
The StockCharts proxy for this market factor is the SPDR S&P 500 Growth ETF (SPYG). This fund's top holdings include all Mag 7 stocks.
The chart of SPYG is similar to the charts of the Nasdaq Composite ($COMPQ), Nasdaq 100 ($NDX), and Invesco QQQ Trust (QQQ). There's a little upside movement, but not enough to convincingly suggest a momentum shift.
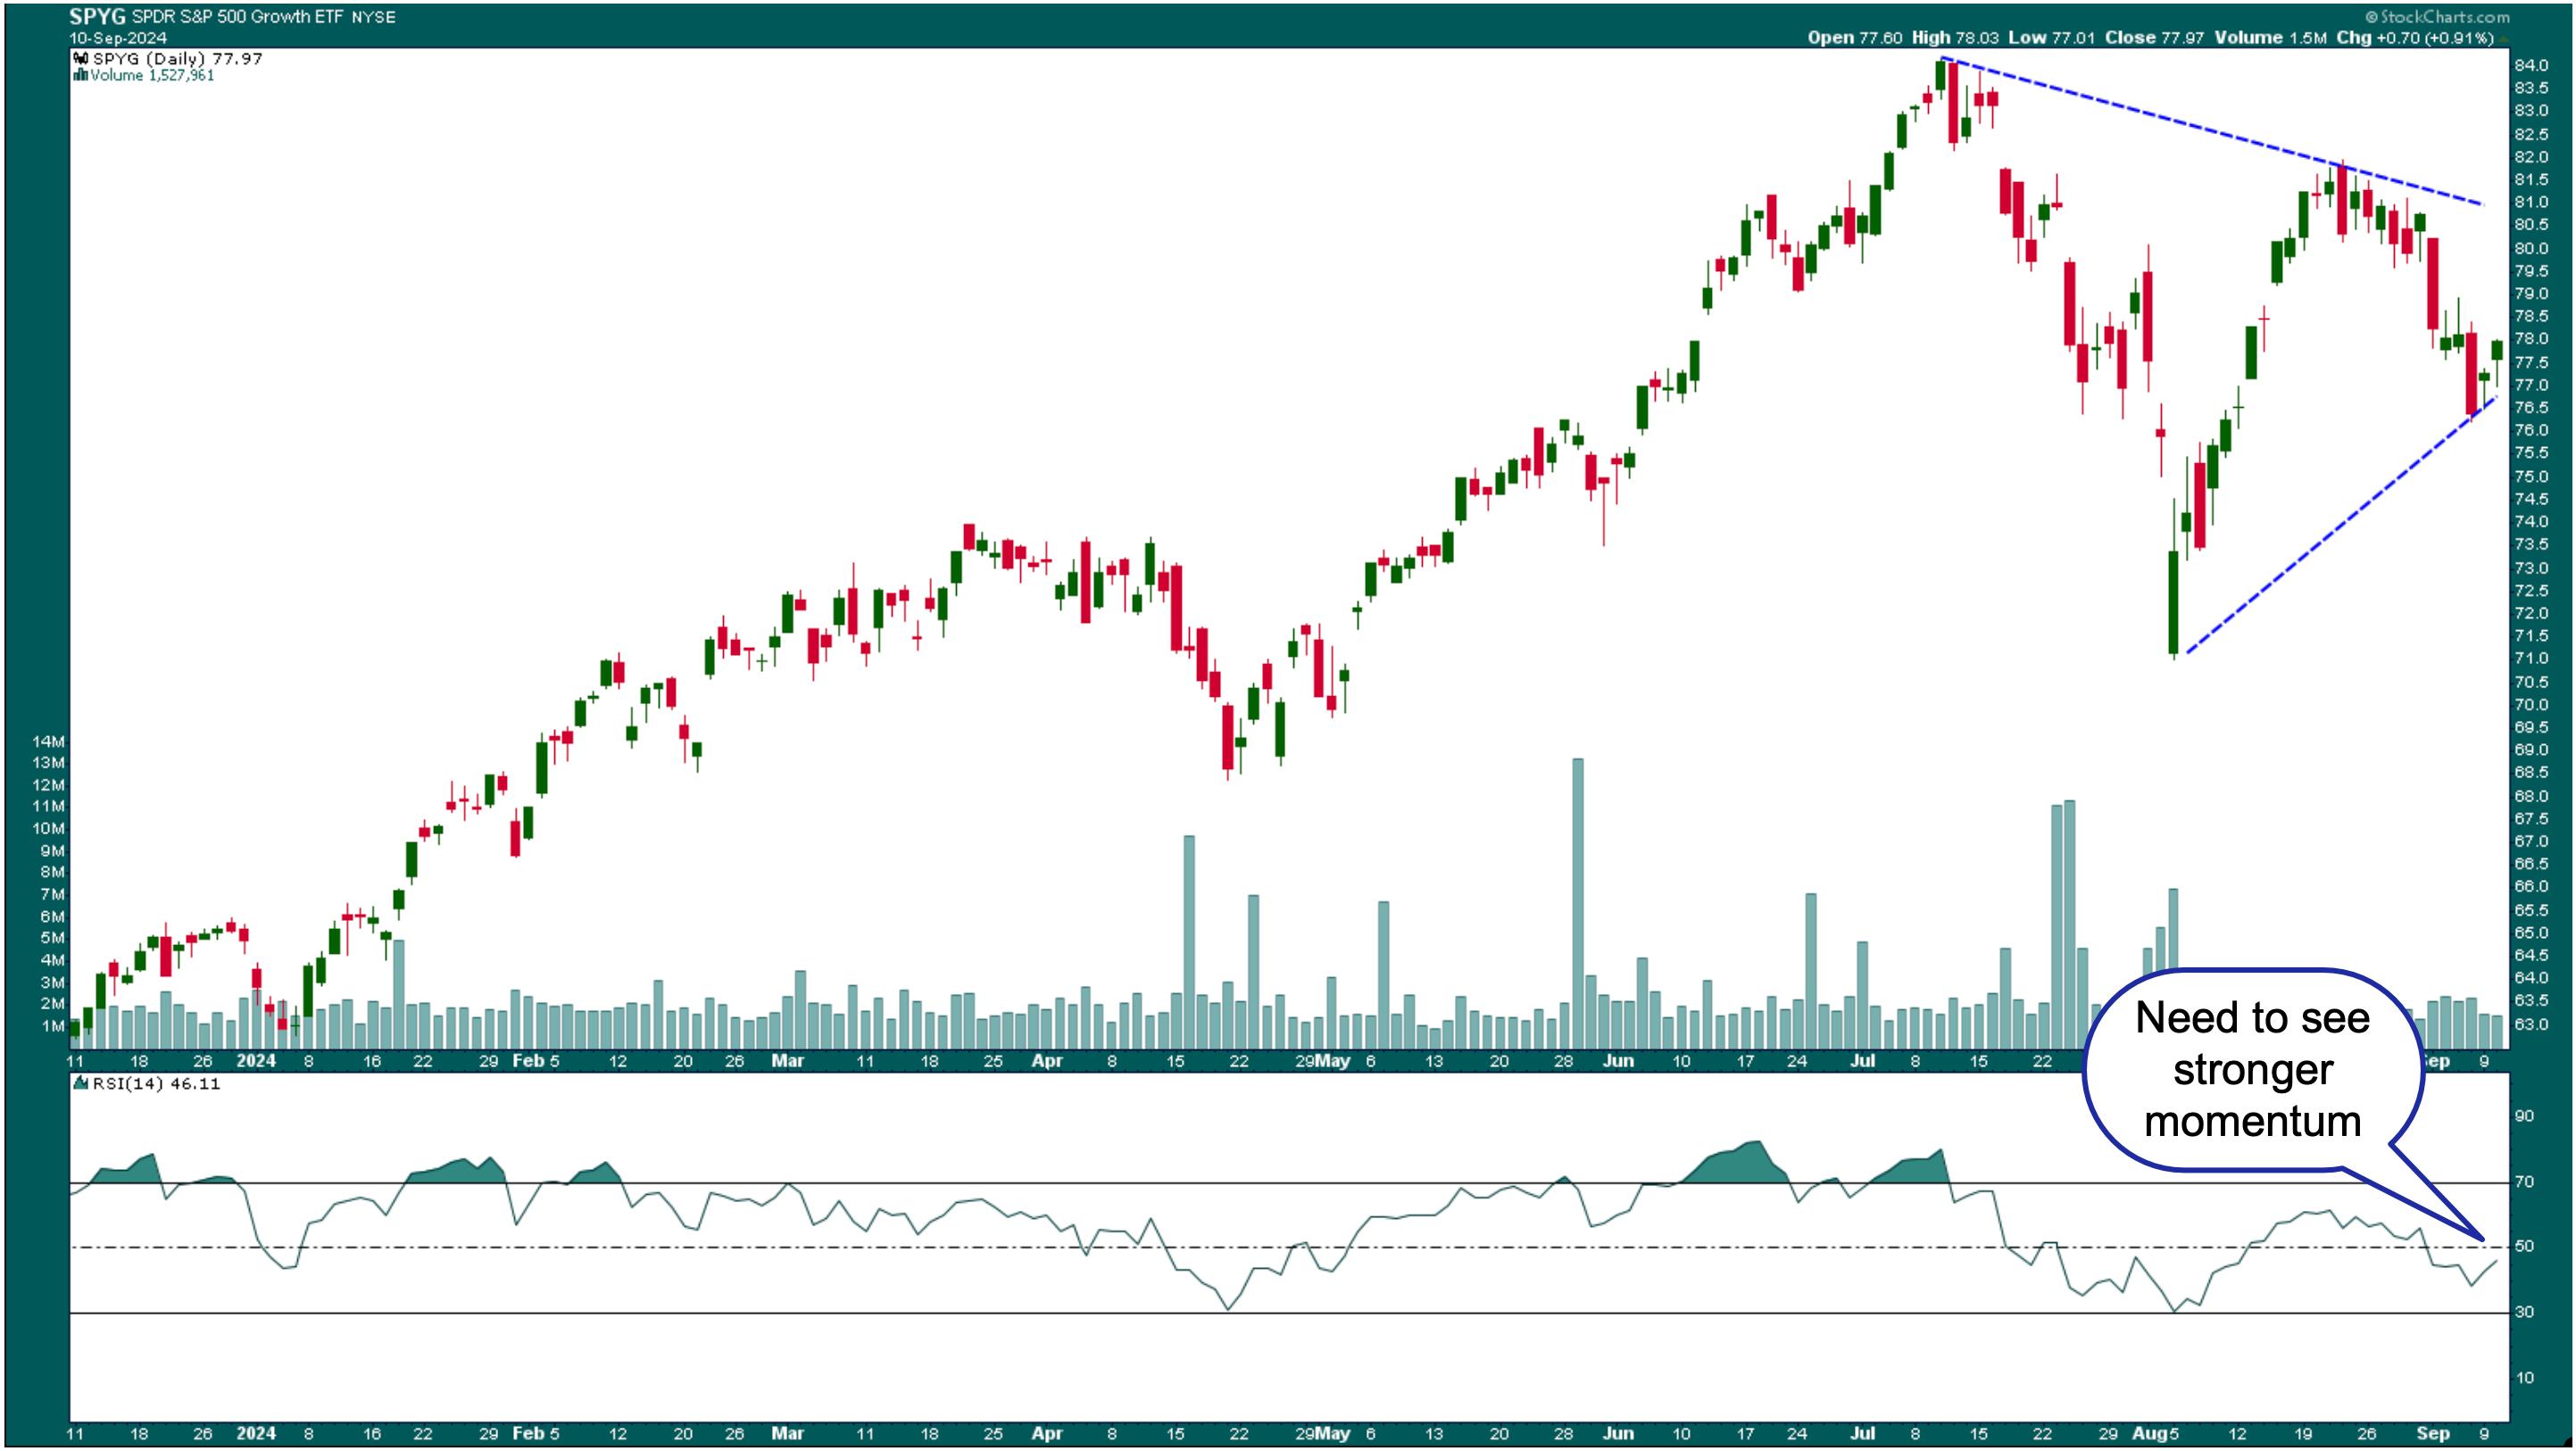
FIGURE 3. DAILY CHART OF SPDR S&P 500 GROWTH ETF. SPYG is trading in the middle of its July high-to-August low range, which means the ETF has an equal chance of moving in either direction. The RSI needs to move above 50 with above-average volume.Chart source: StockCharts.com. For educational purposes.
There still needs to be much more bullish pressure to move Tech stocks higher. The relative strength index (RSI) should cross over the 50 level with increasing volume. SPYG is trading in the middle of the July high-to-August low range and could move in either direction. A break below the lower blue dashed line could start a bearish move, whereas a break above the upper trendline would be bullish.
Hopefully, we won't have to wait too long to know whether it'll be the bulls or bears who dominate the large cap growth stock arena. Tomorrow will present a clearer picture of which way investors are rotating their holdings.
As a side note, Extended Factors is one of the latest additions to the SharpCharts dashboard panels. These are very useful for identifying which market factors are leading and lagging.
Energy Slump
Oil prices have slid lower recently and have now reached their lowest level in more than two years. The fall in price is related to weaker demand and concerns about China's economic growth. The chart of the Energy Select Sector SPDR Fund (XLE) shows the magnitude of the fall in energy prices. XLE is trading below its 200-day simple moving average, and the Energy Sector Bullish Percent Index ($BPENER) crossed below 30.
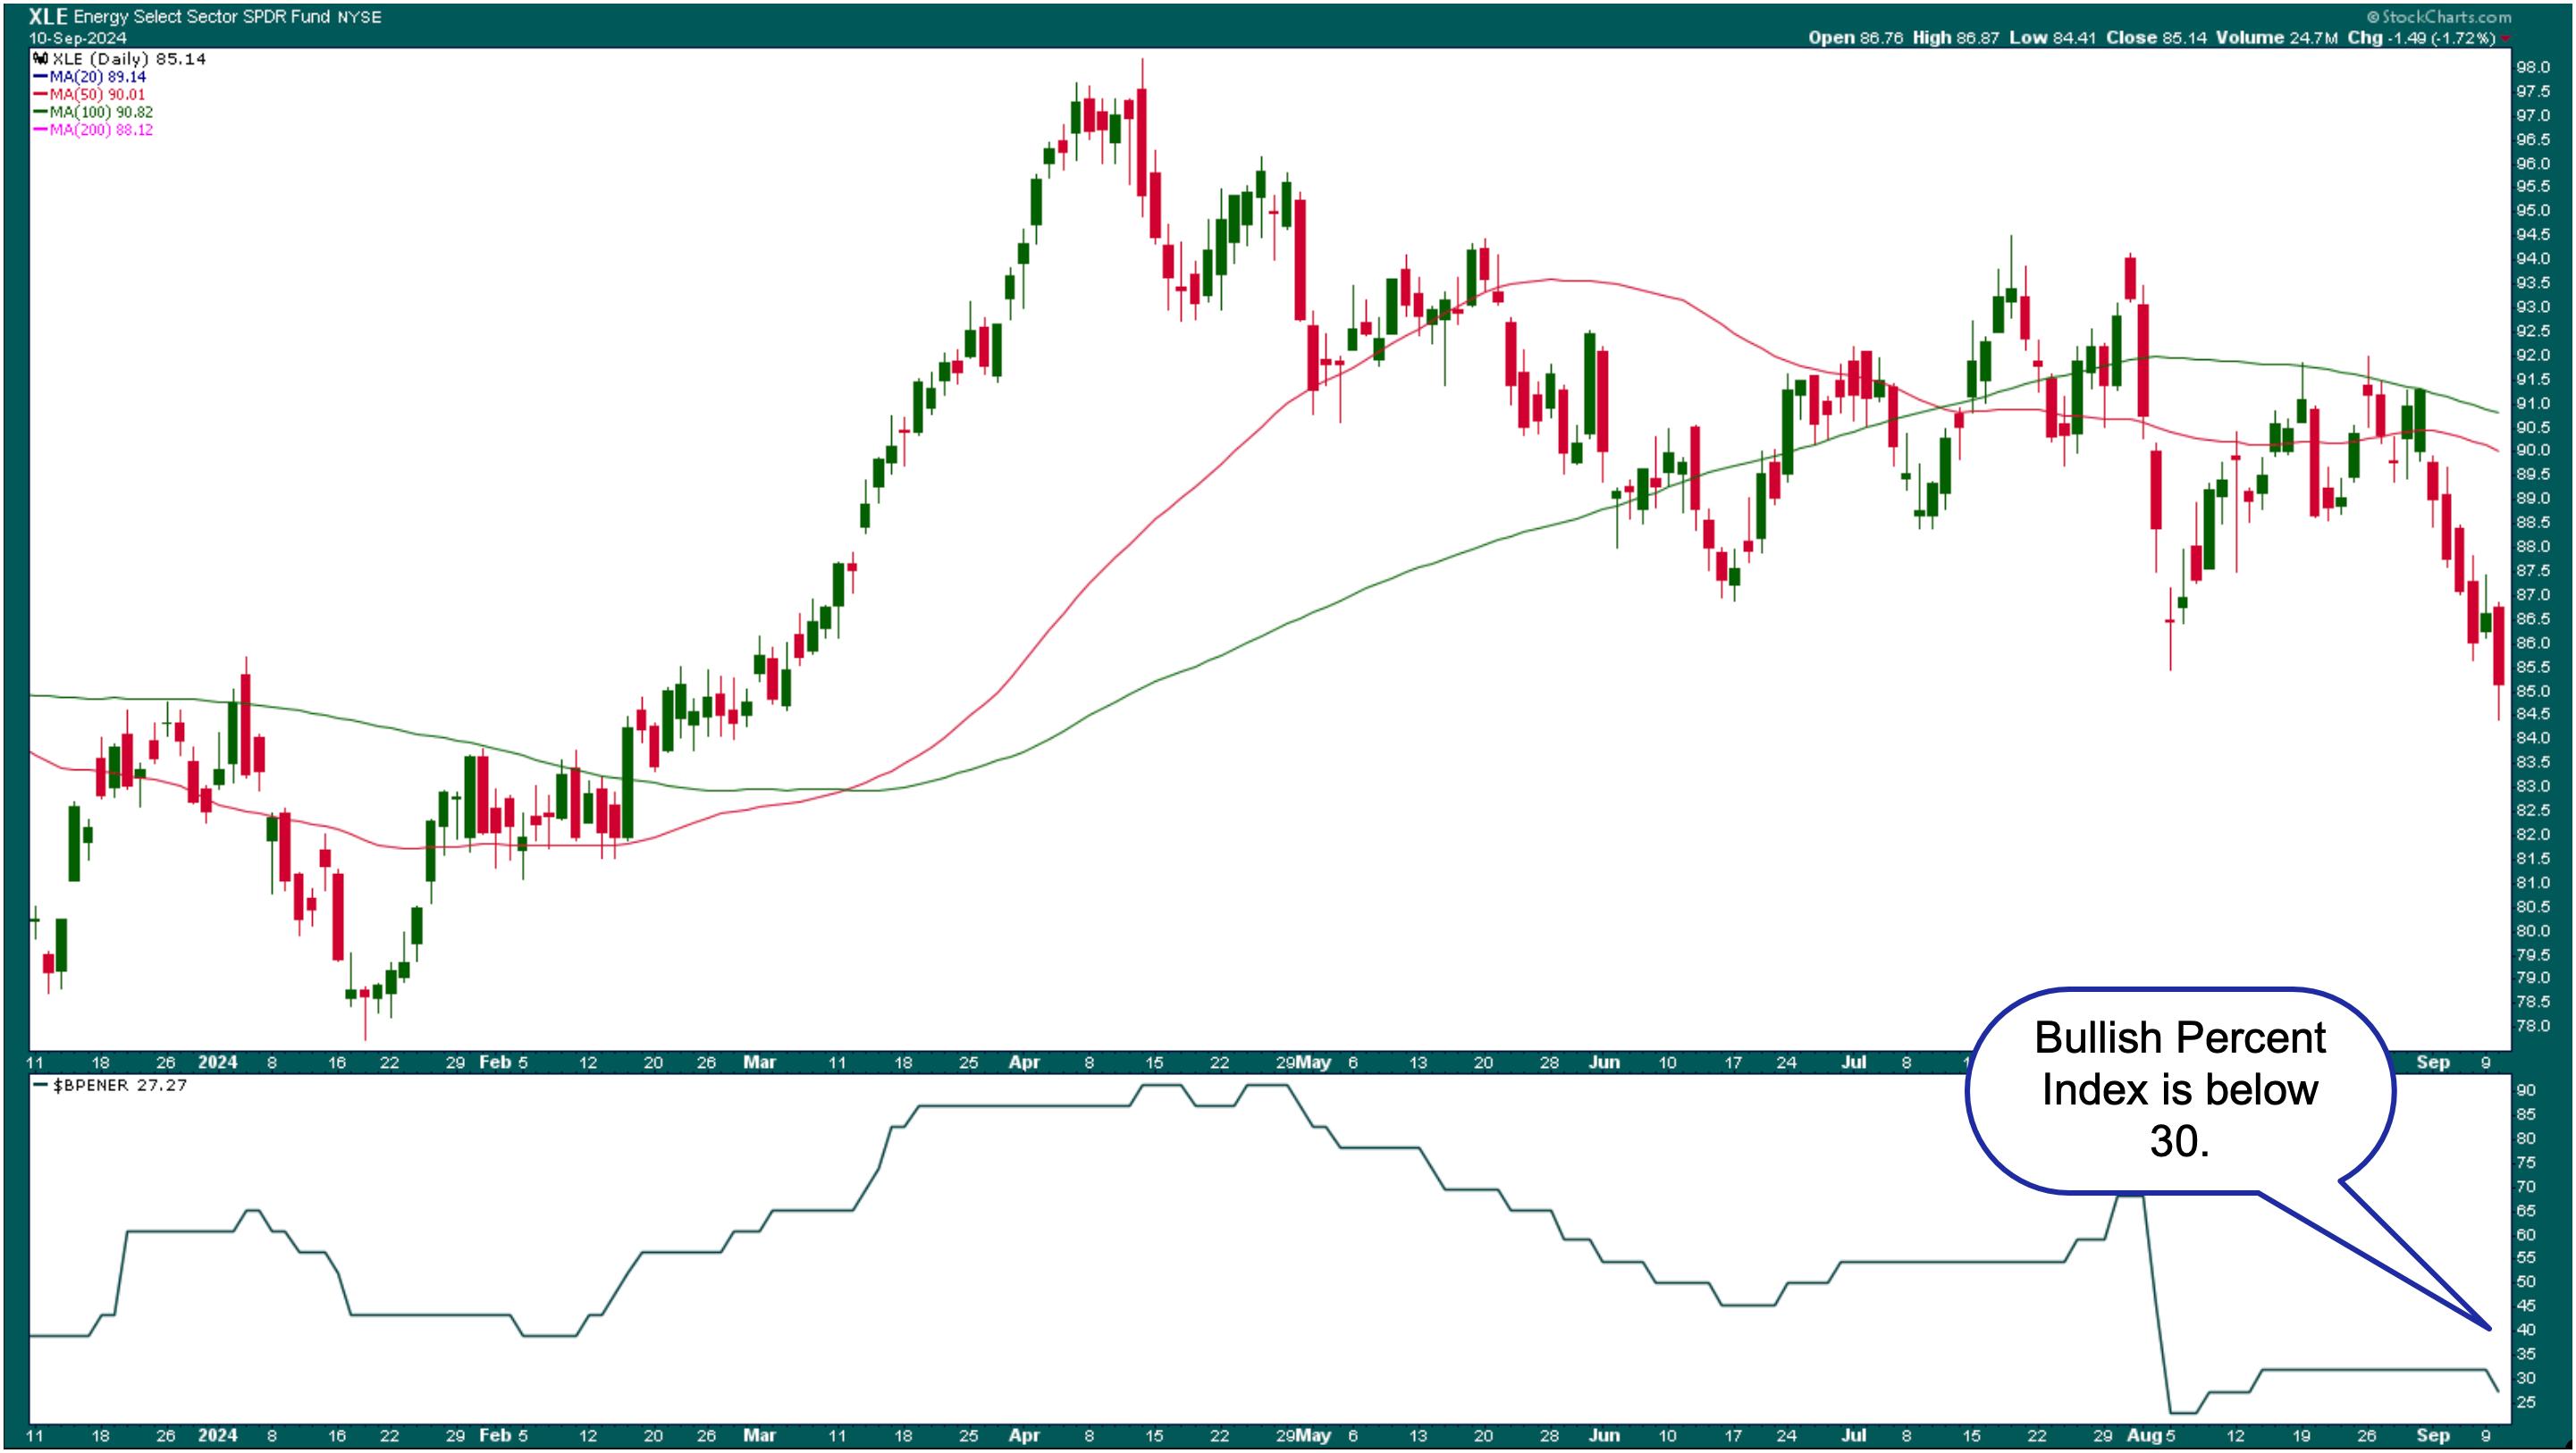
FIGURE 4. THE ENERGY SECTOR'S SLIDE. The Energy Select Sector SPDR Fund (XLE) is trading below its 100-day moving average, and its Bullish Percent Index is below 30. Technically, XLE looks very bearish. Chart source: StockCharts.com. For educational purposes.
Closing Bell
There wasn't much movement in equities today. Tomorrow could be a different story, with CPI data tomorrow morning before the close. There could be a lot of choppiness in early trading hours.

Disclaimer: This blog is for educational purposes only and should not be construed as financial advice. The ideas and strategies should never be used without first assessing your own personal and financial situation, or without consulting a financial professional.
Happy charting!


