Every week we do hundreds of behind-the-scenes things to make StockCharts.com better. Most of the time, these things are relatively unnoticed by users - which is a good thing - except that the website continues to perform reliably and accurately.
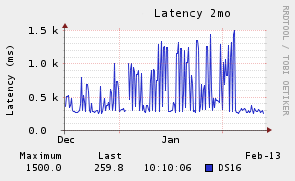
Occasionally we make one of these changes that can be seen. Check out this graph:
This graph shows the response times of the database servers that contains information about our members and their accounts. As you can see, the responses times for this test were getting slower and slower over time. (The test was
Read More
