Chip Anderson

January 2013

Chip Anderson

StockCharts.com Rated "Best of the Best" by AAII

by Chip Anderson

We are thrilled to learn that we have been called "the Best of the Best" in the latest comparison review of technical analysis websites by the American Association of Individual Investors!  You can read the full review by clicking here: http://www.aaii.com/computerized-investing/article/the-top-technical-analysis-charting-websites?a=20130126 - Chip Read More 

Chip Anderson

New Method for Creating, Using and Organizing ChartStyles and StyleButtons

by Chip Anderson

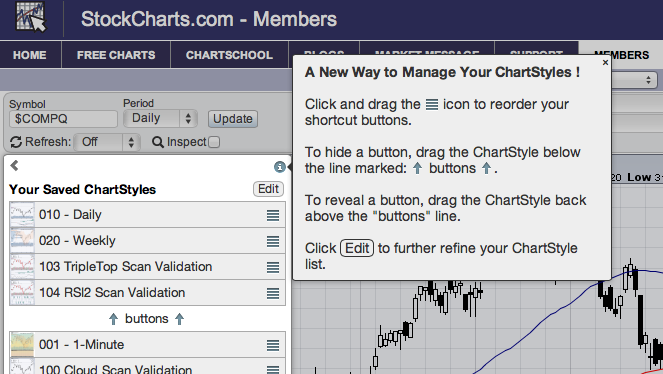
We've just released a new, OPTIONAL, method for creating, using and organizing ChartStyles and StyleButtons.  As a quick reminder, ChartStyles are essentially templates for new charts.  StyleButtons are little grey squares that appear to the left of each chart and let you quickly switch the current chart to a different ChartStyle. StockCharts Members should now see an additional arrow icon located just to the left of the top of each SharpChart.  Clicking on that arrow causes a panel to slide out from the left side of the workbench.  That panel looks similar to this: Read More 

Chip Anderson

Scan Engine and SCTRs Quickly Find Last Year's Stock Market All-Stars

by Chip Anderson

Here's all you need to know in order to find all-star stocks: [min(200, SCTR.sp5) > 50] That Advanced Scan will return all stocks in the S&P 500 that have had a StockCharts Technical Rank (SCTR) of that has been higher than 50 for the past 200 trading days. Again, our SCTR ("scooter") rankings quickly show you how technically strong a stock is compared to the other stocks in its group (in this case, the S&P 500 stocks).  SCTR rankings go from zero to 99.9.  For a stock to have a SCTR ranking above 50 for 200 days or more is very impressive. Right now Read More 

Chip Anderson

PctDiff Function Added to Advanced Scan Workbench

by Chip Anderson

Today we're adding a new function to the Advanced Scan Engine called PctDiff. PctDiff will return the percentage difference between two values. PctDiff can be found in the Technical Indicators list on the Advanced Scan Workbench.   For example, PctDiff(close, SMA(50,close)) will return the percentage difference between the current closing price and the 50-day simple moving average of the close. Here is what a simple scan might look like:    [type = stock] and [pctdiff(close,sma(50,close)) < 5]      Since Read More