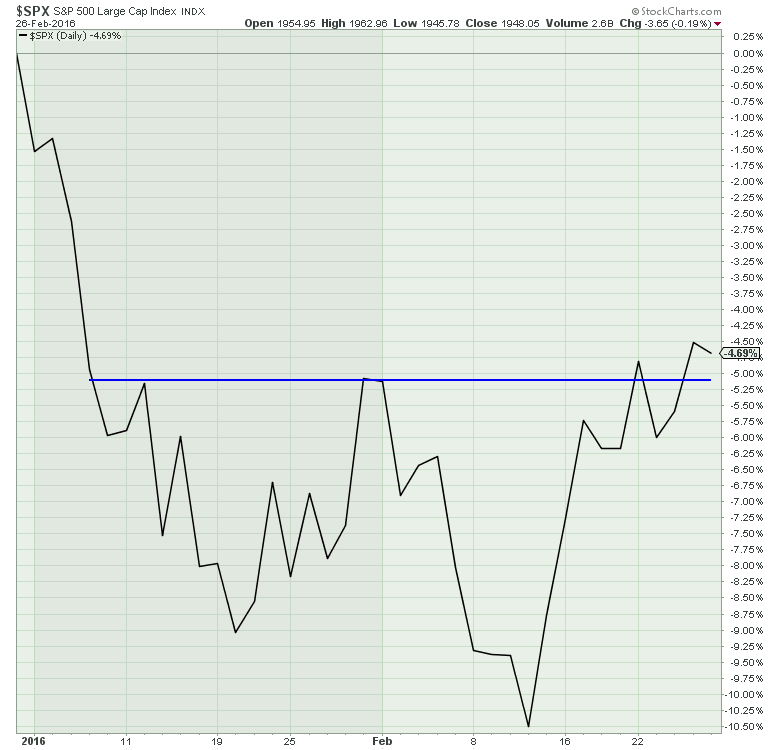
Wow, what an uneventful breakout! With the Central Banks meeting in Shanghai, you would expect the markets to rally as the 'Pirates of Shanghai - aka- The Shorts' of the market would be forced to cover on all the bullish enthusiasm expected. Whoops. No walk-the-plank action today. The Monday breakout rolled over immediately and Thursday's had all the enthusiasm of going for a biopsy. We broke out and went flat.
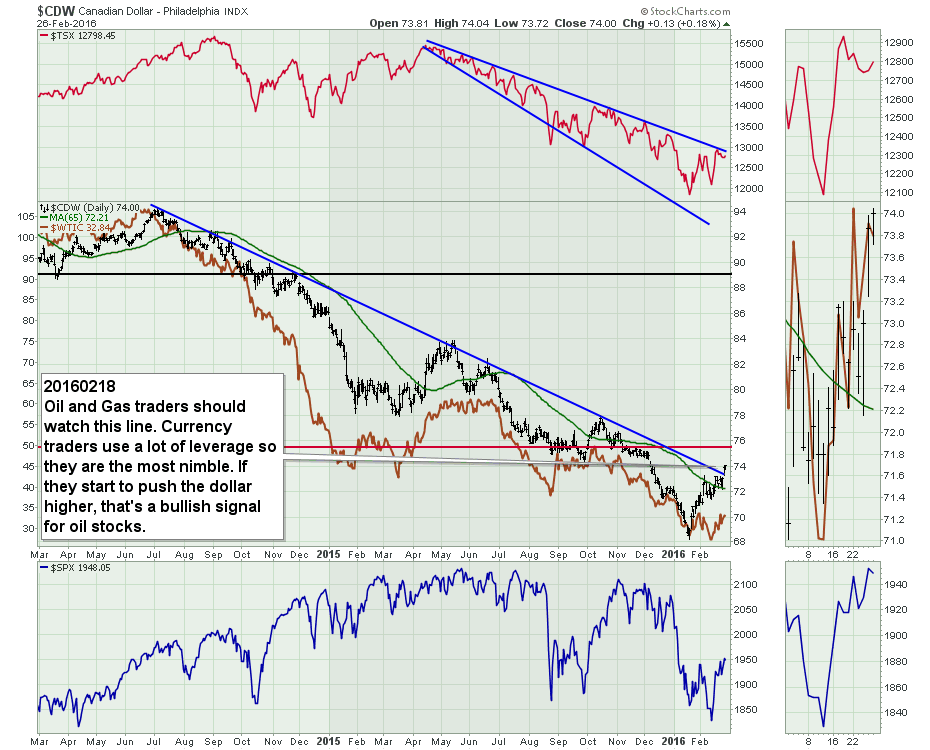
The currency traders appear to think the lows are in for oil. Note the price of Crude Oil in brown. In June of last year, the currency started dropping before the price of oil. Now, the Canadian Dollar appears to be rallying before the price of oil. This Canadian Dollar ($CDW) chart topped as crude oil topped in June 2014 and now the downward trend line has broken. If nothing else, it should put bullish investors on notice that there might be opportunities starting to appear in the oil and gas sector.
 Hey, crude continued to try to break to the topside. Today. However, it actually had a bad candlestick reversal day. It opened by gapping higher, traded lower all day and closed below yesterday's close. This is just another in the fleet of bearish reversals marked on the chart by the red arrows.
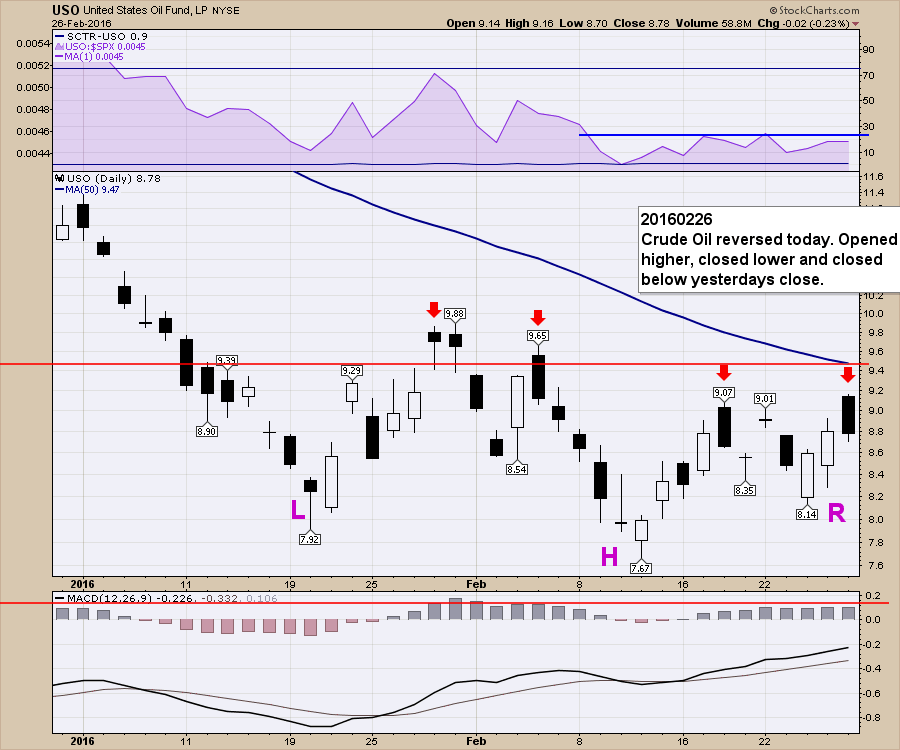 If oil, as depicted by USO on the chart above, can break through the red horizontal trend and close there, we'll probably get a nice move in the oil stocks. Friday's price action suggests we were not ready to go higher into the weekend. We'll see if next week can bring a worthy breakout. We can see a competing bullish head and shoulders bottom formation setting up. Now the battle begins as we test the $9.50 level.
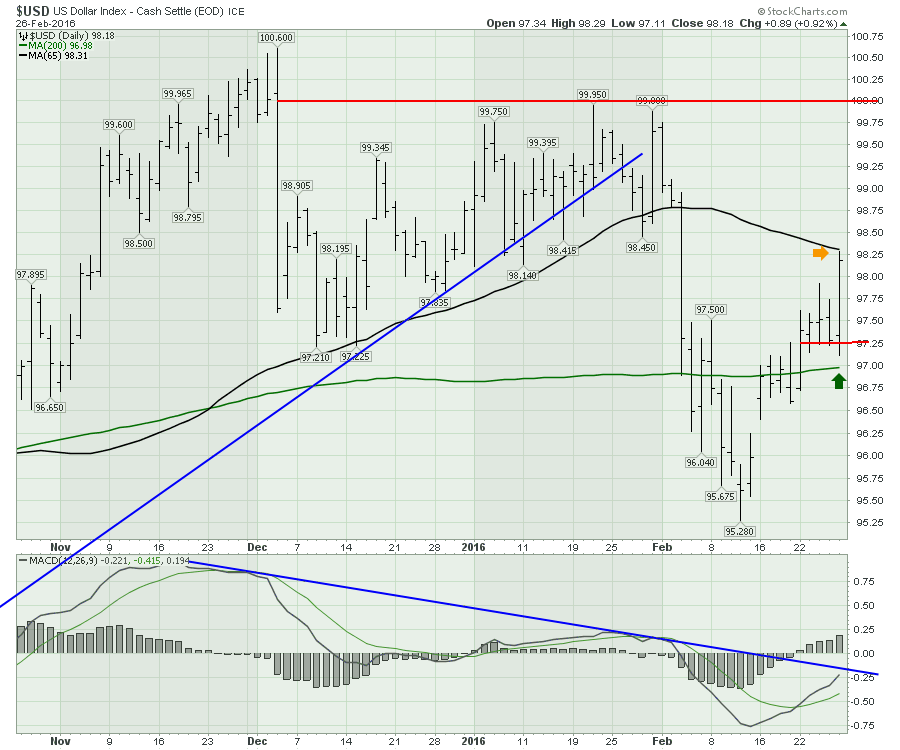
The US Dollar ($USD) was expected (by me) to make a big move this week based on my work. It spent the week going sideways, hugging the 200 DMA. Today, the $USD finally had a big push. It was very hard for day traders as the dollar lined up by going below the previous 3 days, then reversing and going higher. The 50 DMA became resistance. We also have the resistance line above at 100, as the market reversed from there and sold off quite hard at the end of the previous month. In order to keep the downtrend of lower highs and lows, that 100 level will have to hold as resistance on the upside.
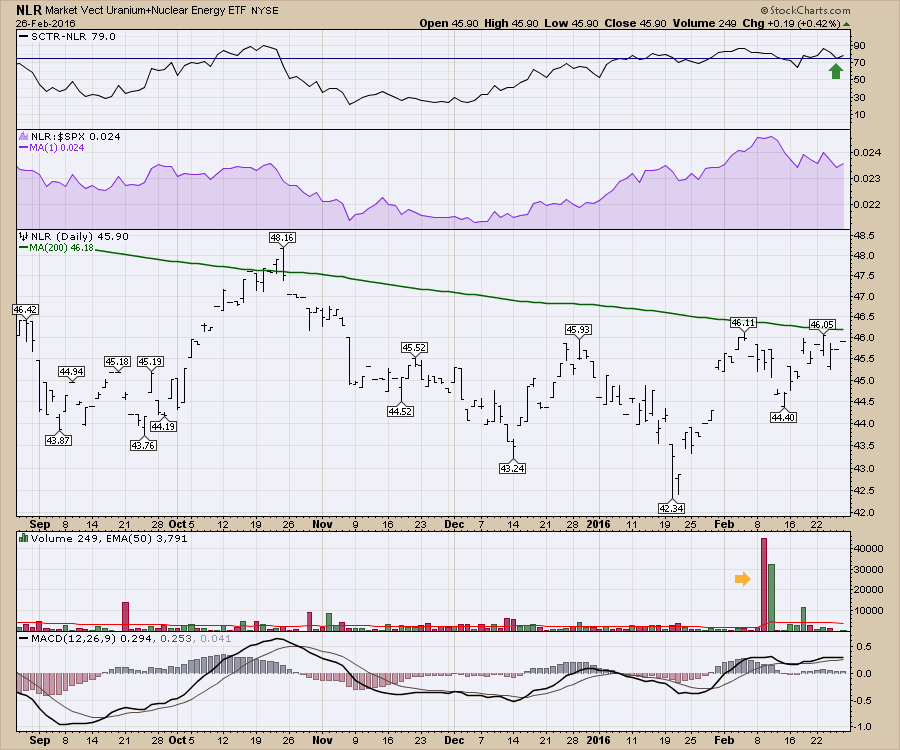
 On the webinar (Commodities Countdown 20160225) we discussed Nuclear stocks because the NLR ETF was breaking out on the SCTR. Upon further analysis, it does not look like a new bull market is shaping up for uranium-related stocks. Here is the NLR. The chart looks ok. The big paradox from the chart looking so bullish (rising relative strength and an SCTR above 75) is the makeup of the ETF. The NLR has a lot of nuclear power-generating utility companies in the top 20 holdings. As the defensive sector is leading the market right now, this ETF looks bullish because of the weighting towards utilities in the ETF. However, most people are expecting the uranium mining companies to soar on the back of the nuclear plants currently under construction. This ETF was not providing a signal to get bullish on uranium yet. You can see more in the Commodities Countdown Webinar 20160225. However, we did cover off how to set alerts to help identify when a trend might be changing. The webinar also spent about 10 minutes defining how to research that information.
 A brief dip into gold below. By now, if you own Gold you are happy to see so much coverage. If you missed the move so far, you are sick of hearing how Gold continues to push higher. The trader's conundrum. Let's look at the chart. Gold is expressed for this article through the GLD chart below. The GLD is currently rallying well above both moving averages. It is extended as the MACD is rolling over. However, on all of the daily, weekly, and monthly charts, Gold looks to have confirmed a major breakout on all time frames.
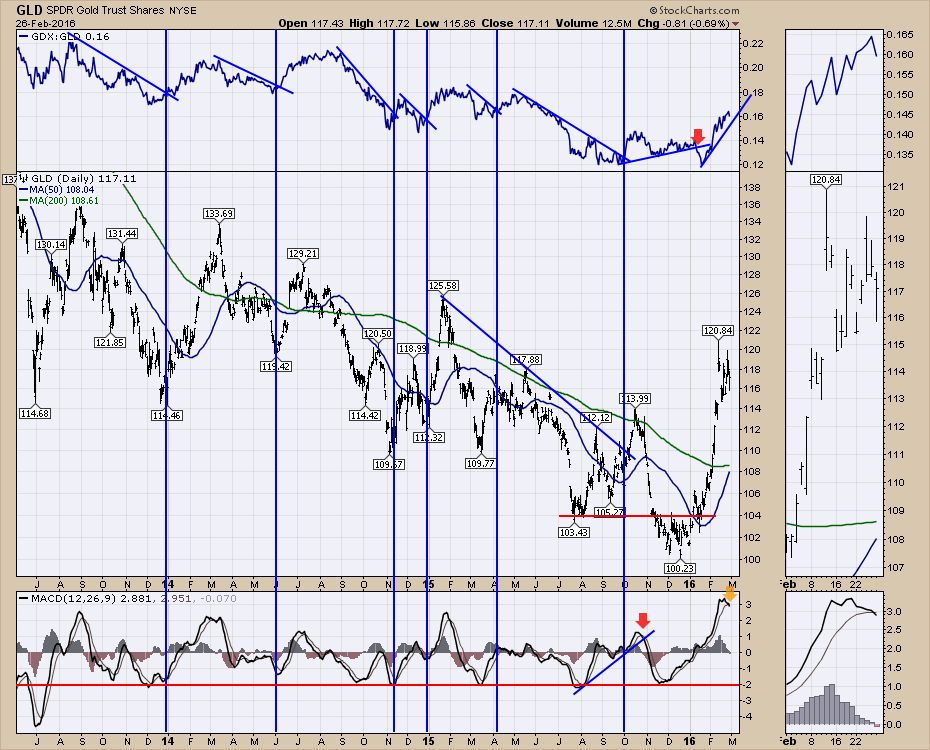 A little pullback might be in order, but bull markets never seem to let you in and the bear markets never seem to let you out. This looks like the big battleground for the next two weeks.
One of the major discussion points from the webinar was making sure all of the StockCharts users were ready to get onboard a big bull run in oil related stocks whenever it happens. I committed to demonstrating how to set up the StockCharts chartlists, set alerts and make sure that when the opportunity comes, viewers are well positioned to jump on board the trend. If you would like to see how to set up a major sector in your chartlists, this will be a must-watch webinar next Thursday, March 3rd, 2016 at 5 EST. Click here to register. Hopefully, this is worth the annual subscription many times over for you. Commodities Countdown 20160303 - Getting Ready for the Bottom in Oil! Some of the gains made on the bottom in Gold so far have been massive without the use of options. An example would be over 40% in a month on a few of the names listed in previous webinars. Some have doubled. If you find these moves are missing you, please attend. If you want to be more prepared, this will be a valuable hour.
Enjoy the weekend and good trading,
Greg Schnell, CMT, MFTA.
