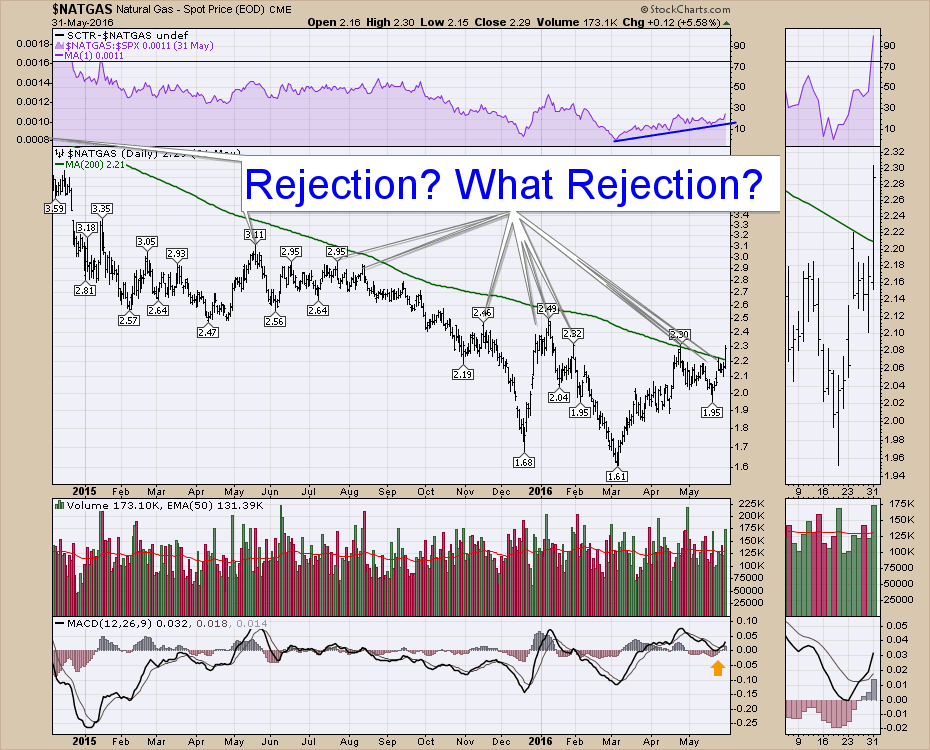
Natural Gas ($NATGAS) has been trying to break out for a while. For those following the Commodity Countdown webinars, we have been finely tuned towards this trade. This week it went from the bottom of the range to the top of the range in two days, but it also made one more change that is important. It broke above the 200 DMA.
For algorithmic traders, they have a couple of challenges. They need to write programming code that is flexible for multiple situations and can recognize trends. One of the coding themes is usually is the price above or below a long-term trend. Usually, a simple system will use the 200 DMA. The second condition will be a shorter term moving average, perhaps a 50 DMA. Chart 2 displays what this looks like.
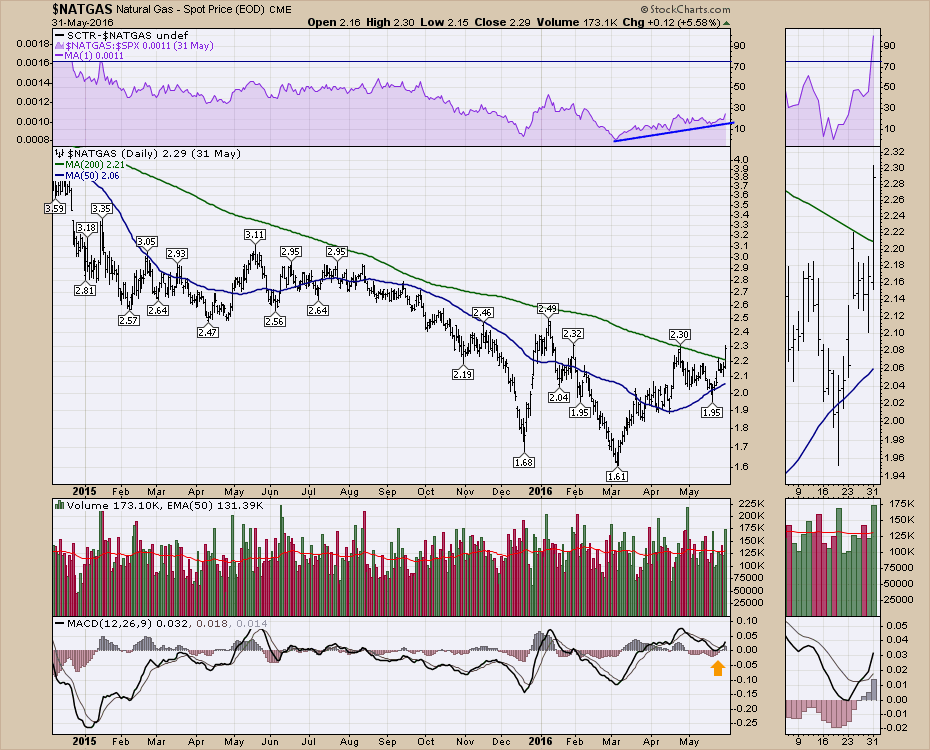 Now two basic tenets have been met on this chart for a long position. The price is above both the 50 DMA and the 200 DMA. The next criteria that we would wait for in this example is: Is the 50 DMA also above the 200 DMA? For systemic traders, these simple methods of using different moving averages to help define trends for short, intermediate and long-term trend signals is important. Currently, the intermediate trend is now in place on Natural Gas. In the example above, a computer could also program the slope of the moving averages to help with decision making. In this case, the 50 DMA is turning up but the 200 DMA is still down. With the purpose of using these trend indicators, people can stay on the right side of most trades.
There is a common belief about the natural gas situation that it will not maintain a level above $3.00 anytime soon. I also think this is somewhat relevant, but I don't think anyone expected prices to double dip below $2.00.
At this point, the Natural Gas trade is breaking out, and the oil trade is having some correction from the $50 level. It is important to watch both of these now. Natural Gas also trades as a non-correlated asset to the S&P 500. It can trade on its own, in any given direction, on any given day. This lack of correlation also makes it a nice place to trade if the equity markets are in a correction. So as the $SPX struggles at 2100 and pulls back, the Natural Gas trade starts percolating. It may be coincidence, but if hedge funds were looking for uncorrelated assets as the market approaches resistance, they might be looking into Natural Gas.
I will be hosting the Commodities Countdown Webinar 2016-06-02 on Thursday at 5 EDT. You can register by following the link. I also post interesting charts on Twitter. You can follow me there @Schnellinvestor. Lastly, click Yes below a blog to get new articles in your email.
Good trading,
Greg Schnell, CMT, MFTA
