 As I have traveled the world giving presentations on technical analysis and money management, I have found there are a few things in technical analysis that many do not realize. Of course, I’m referring to all the other technical analysts out there, not you. Many of these are amazingly simple yet they often escape one’s full understanding of a concept. My goal is to hopefully show you - I mean "others" - something that many people overlook. Plus I’ll repeat a little of what everyone knows just in case someone has forgotten.
Simple and Exponential Moving Averages
I can almost see the eyes rolling. I’m not going to mention the details of these but highlight a difference that just might not have been obvious and is certainly nice to know if you sometimes cannot decide which you prefer. Hopefully, with this knowledge, that issue will be solved. Look at Chart A, which shows a price chart and a 50 day simple (arithmetic) moving average (red) and a 50 day exponential moving average (blue). No surprises here! We all know the exponential average will hug the data closer and reverse sooner than the simple average. Now here is the information I want to share. Because of the math of calculating the exponential average it will ALWAYS reverse direction immediately after crossing the price data (blue arrow). Always – every time, no exceptions! Of course the simple average will most times continue and eventually roll over in the direction of price at a later date. This is all dependent upon the magnitude of the movement of the price data and the number of periods used in the average. In the example in Chart A, the simple average did not reverse its upward movement until almost 2 weeks later at the red arrow.
I think you will agree that there is a time to use simple averages and a time to use exponential averages and hopefully that time is used consistently and not fitted to display the message you are trying to convey, or worse yet, hope for. Since all of this is an art, I’ll just share how I do it and some reasons why. The underlying purpose of smoothing a data series is to remove some of the noise. My favorite description comes from my 5th printing edition of J.M. Hurst’s 1970 tome, “The Profit Magic of Stock Transaction Timing.” Incidentally, the price of the book was $5.95 when I bought it in the late 1970s.
1. A moving average of any given time span exactly reduces the magnitude of the fluctuations of duration equal to that time span to zero.
2. The same moving average also greatly reduces (but does not eliminate) the magnitude of all fluctuations of duration less than the time span of the moving average.
3. All fluctuations greater than the time span of the average “come through,” or are present in the resulting moving average line. Those with durations just a little greater than the span of the average are greatly reduced in magnitude, but the effect lessens as periodicity duration increases. Very long duration periodicities come through nearly unscathed.
Personally, I use simple averages whenever using periods of 65 or less, and exponential for periods greater than 65. Why? Using exponential smoothing on short term data does not effectively reduce the noise which is what I’m trying to accomplish. Similarly, using simple averages on longer term data, does not respond in a timely enough manner. I realize this concept is totally debatable but do strongly believe one should use them consistently, whatever they are. Share your preferences with the others in the comment section.
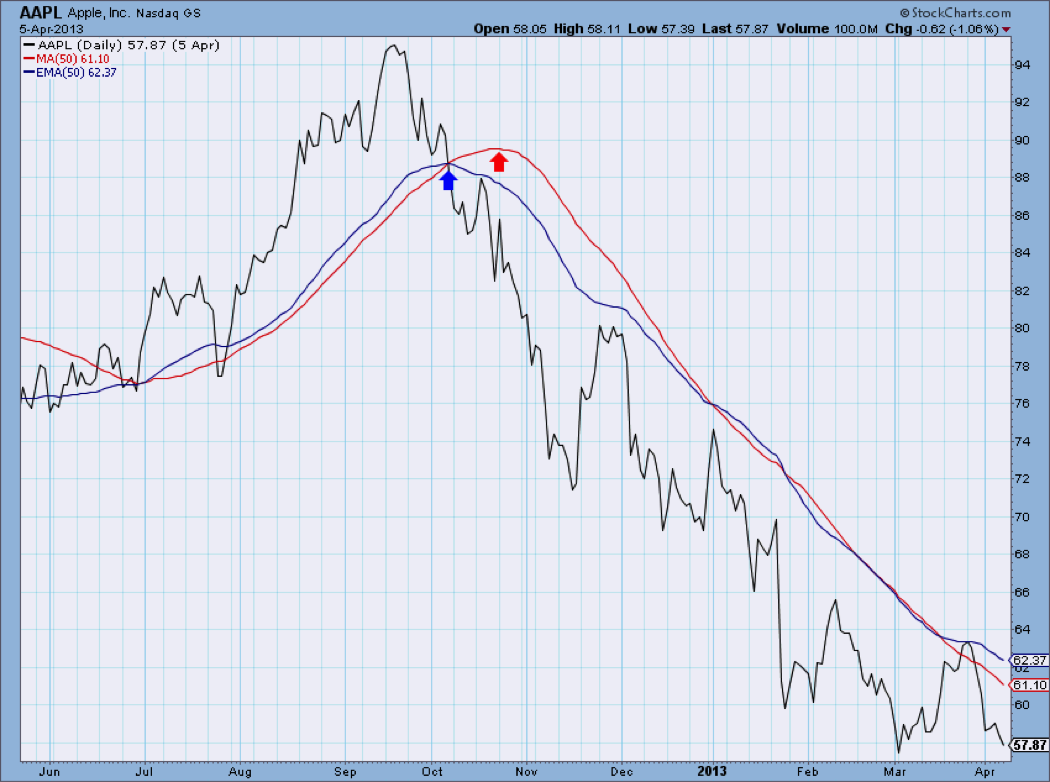
Chart A
Stochastics %K and Williams %R
Simply, one is the complement of the other. Absolutely no additional information is provided by one that is not provided by the other. It should be noted that I’m talking about %K, which is the raw Stochastics without any smoothing. Hopefully you know that the other two lines are just 3 period simple averages of the raw %K in progression (%D is the 3 period average of %K and %D slow is the 3 period average of %D). There are other terms used to describe various relationships such as Fast Stochastics and Slow Stochastics, but they are all the same. The history of Stochastics is not as well-known as I see it often written about and incorrect. George Lane, whom I met on a few occasions, and a delightful guy is often credited with the creation of Stochastics. When in fact, his credit should be as having promoted Stochastics and lecturing on it such that it became a really popular technical indicator. George Schade did significant research on this and believes that Ralph Dystant was the creator of %K, as it was called then. George Lane worked for Ralph in the early years at Investment Educators. And I believe that Tim Slater, creator of CompuTrac software in the late 1970s for Apple II and later IBM PCs, was the one who coined the name Stochastics. George Schade’s research paper is here: http://knowledgebase.mta.org/?fuseaction=kb.resource&kbResourceID=D58018D1-0210-912F-775CDD5469A6F1FF&r=1
Larry Williams, a friend and one who trades with real money, was also part of that generation and was instrumental in the creation of many price indicators, including Williams %R. Larry calculated it as the difference between the Highest High and the Close divided by the range. Stochastics %K is the difference between Close and the Lowest Low divided by the range. Conceptually these are identical; the only difference is one used the complement from Close to Low versus High to Close. Which is better? If you have to ask then I just did a horrible job of explaining it. Both are mostly used as a mean reverting (overbought/oversold) indicator. I use them as trend indicators. Remember %K and %R are measuring where the current price is relative to a range of prices over a number of periods.
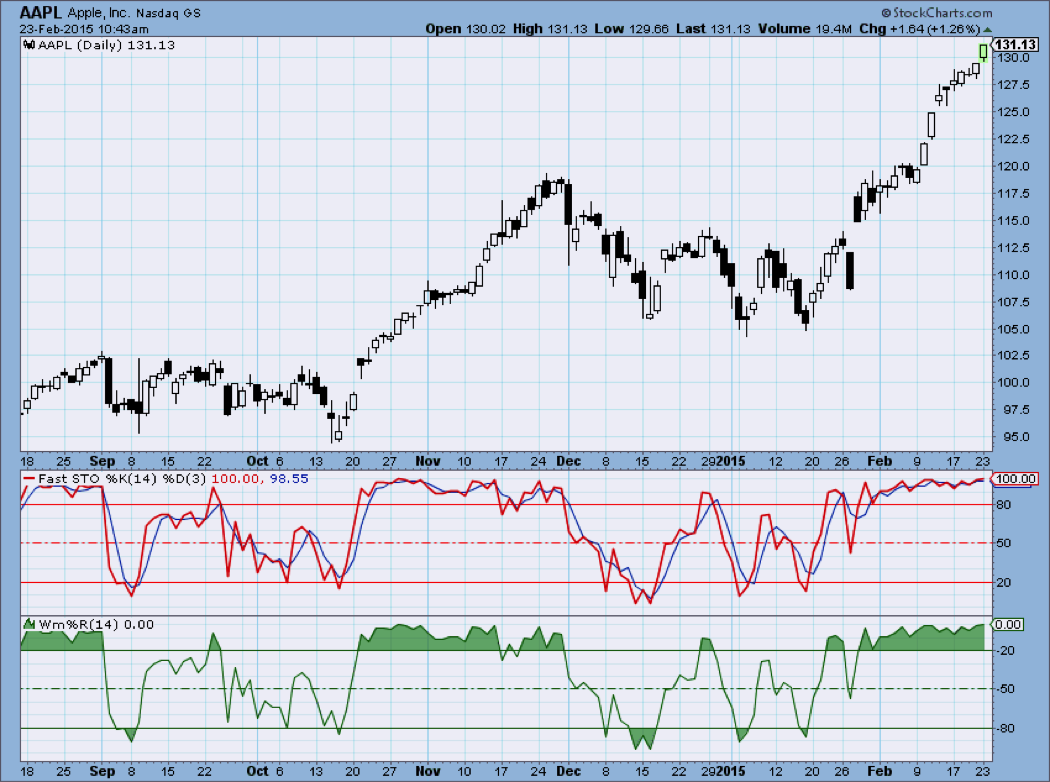
Chart B
And a final comment about %K and %R. If you have an analog indicator whose scale in not of value (OBV, AD Line, etc.), you can normalize it by putting it into the Stochastic formula and setting the periods to say 252, so that it is a rolling normalized indicator that will always move between zero and 100. Try it, you will like it – maybe.
Relative Strength Index (RSI)
RSI was one of the first truly original momentum oscillator indicators that was created prior to desktop or personal computers. Welles Wilder laid out the concept on a columnar pad. Basically, RSI takes a weighted average of the last 14 days' (if using 14 for the number of periods) up closes and divides by the last 14 days' down closes. Note: this is not the weighted moving average that you are familiar with. It is then normalized so that the indicator always reads between 0 and 100. Parameters often associated with RSI for overbought are when RSI is over 70, and oversold when it is below 30.
The Relative Strength Index (RSI) can be used a number of different ways. Probably the most common is to use it the same as Stochastics in an overbought / oversold manner. Whenever RSI rises above 70 and then reverses direction and drops below 70, that is a sign that the down closes have increased relative to the up close and the market is declining. While this method seems to always be popular, using RSI as a trend measure and one to help spot divergences with price seems like two better uses for RSI. I’m showing my disdain for overbought and oversold. Chart C shows RSI with the S&P 500 Index above. The horizontal lines on RSI are at 30, 50, and 70. You can see that at the blue arrow, RSI had reached its overbought status and the market continued to rise for a month and a half. At the red arrow it showed a true overbought condition that worked out, that is, if you believed this one after losing money at the blue arrow. More overbought oversold disdain. I should explain that. I used to track all sorts of things with momentum, RSI, %K, etc. and found that about the time I had worked up the nerve to actually make a trade, it failed miserably. So I have not been a fan of using overbought or oversold measures using real money. I’ll leave that to the experts and gurus.
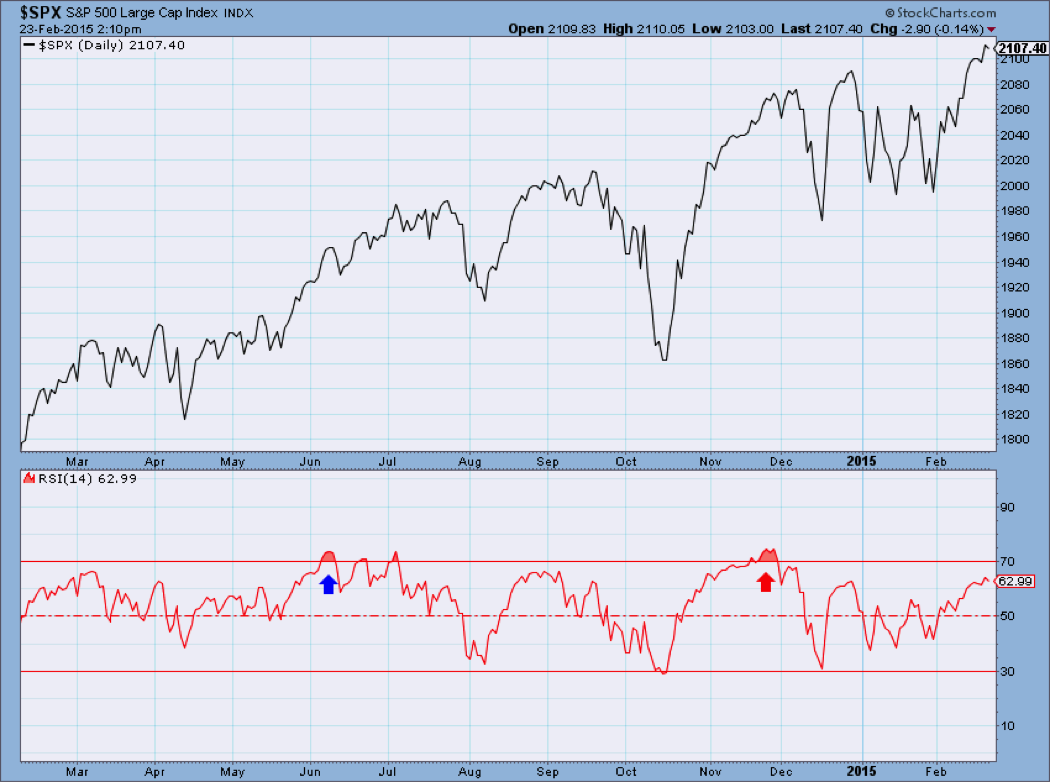
Chart C
RSI is probably one of the most popular indicators ever developed. I think that is because most could not generate the formula themselves if it were not a mainstay in almost every technical analysis software package. Wilder developed it using a columnar pad and had to come up with a way to do a weighted average of the up and down closes. It is not a true weighted average but gets the job done. One of the really big problems that I see with RSI is that in long continuous trends, it can be using some relatively old data as part of its calculation. Here’s an example, say the stock is in an uptrend and has been for a while. The denominator is the average of the last 14 days’ down closes. If the uptrend is strong, there might not be any down closes for a period of time. If there were not any in the last 14 days, without the Wilder smoothing technique, the denominator would be equal to zero, and that would render the indicator useless. To say nothing about blowing up your spreadsheet or your software. Because of this situation, the calculation for RSI can use relatively old data. I think that is why RSI seems to work well as a divergence indicator, because of the old data either in the numerator or the denominator. This is generally caused by the fact that the previous up trend keeps the denominator, which uses down closes fairly inactive, but once the down closes started hitting again, it has a strong effect on RSI.
Moving Average Convergence Divergence (MACD)
MACD is a concept using two exponential averages developed by Gerald Appel. It was originally developed as the difference between the 12 and 26 day exponential averages; the same as a moving average crossover system with the periods of the two averages being 12 and 26. The resulting difference, called the MACD line, is then smoothed with a 9 day exponential average, which is referred to as the signal line. Gerald Appel originally designed this indicator using different parameters for buy and sell signals, but that seems to have faded away and almost everyone now uses the 12-26-9 combination for both buy and sell. The movement of the MACD line is the measurement of the difference between the two exponential moving averages. When MACD is at its highest point, it just means that the two averages are at their greatest distance apart (with short above long). And when the MACD is at its lowest level, it just means the two averages are at their greatest distance apart when the short average is below the long average. It really is a simple concept and is a wonderful example of the benefit of charting, because it is so easy to see. MACD, and in particular, the concept behind it, is an excellent technical indicator for trend determination. Not only that, but it also shows some information that can be used to determine overbought and oversold, as well as divergence. You could say it does almost everything.
Please keep this in mind; while MACD is a valuable indicator for trend analysis, it is only the difference between two exponential moving averages. In fact, if you used price and one moving average it would be similar in that one of the moving averages was using a period of one. This is not rocket science! Chart D is an example of two versions of MACD. The indicator at the bottom is the standard 26-12 exponential average difference, the signal line, with the histogram representing the difference between them. See how the histogram is always positive when the green line is above the red line? The histogram is a visual enhancement to MACD as it does not add anything to what is there with the two lines. Now, where is the other example of MACD? The top plot is the price (average = 1) and the red line is an average of 26; so this could be considered similar to the MACD concept except here we are using 26 and 1, instead of 26 and 12. So, the bottom line is that MACD is just the difference between two moving averages. A really good simple technical indicator.
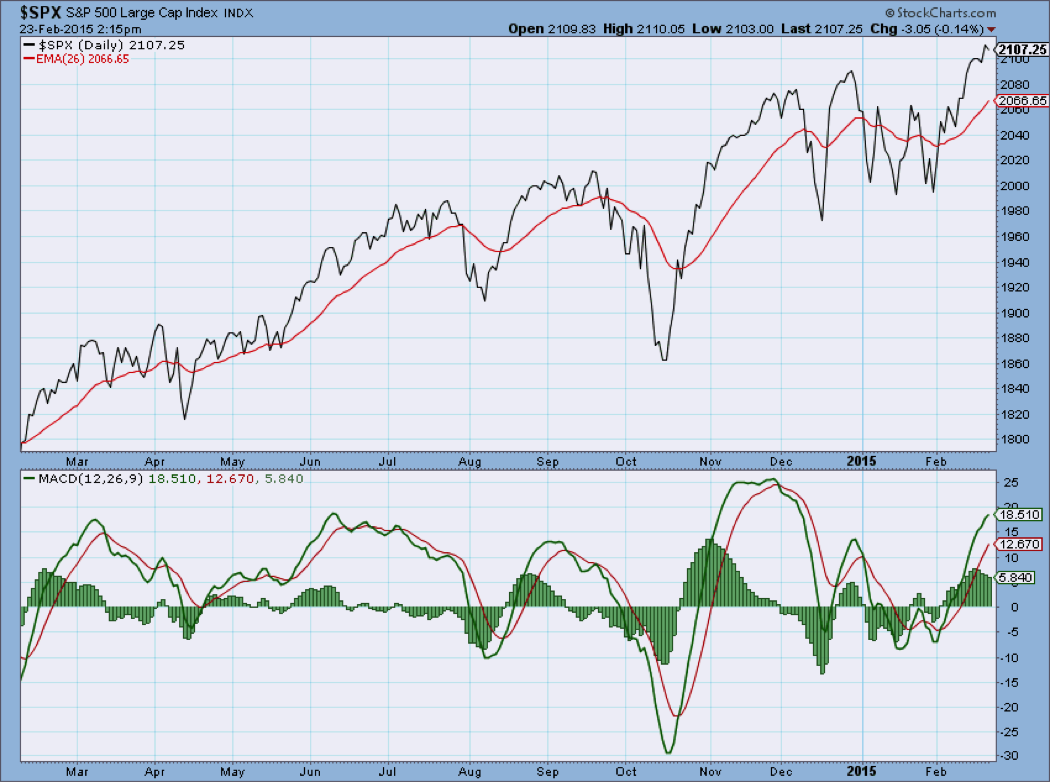
Chart D
While this was probably just a review for you, I hope I mentioned at least something "other people" hadn’t thought of in a while.
Please leave me your thoughts in the comments area below and don't forget to subscribe to this blog by clicking the "Email updates" link near the upper right corner of this page.
Happy trading!
- Greg Morris
