 The title of this article might have you thinking it doesn't belong on StockCharts.com or anywhere in technical analysis. I disagree; I think every technician needs to understand this. If for no other reason than to offer ammunition for your defense of technical analysis. For the past twenty years I have been in the money management field and dealt with clients and advisors that have heard all about modern finance for most of their lives. They have believed and generally accepted everything they read or were told by their advisor or stockbroker’s representative. It was usually accepted unchallenged. Sadly, much of modern finance is nothing more than marketing for the retail side of Wall Street. You should be delighted that you have adopted technical analysis. Let me explain.
If you have ever done any formal research you know that besides a defined goal, you generally need to begin with a few assumptions; launch parameters if you will. These assumptions are what you build from, and often early in the project you find an assumption took you in the wrong direction. Then you need to either modify the assumption or remove it. Modern Finance is the general term I use to cover Modern Portfolio Theory, Capital Asset Pricing Model, Efficient Market Hypothesis, and a few others. These theories began in the early 1950s and are still referred to as modern (marketing?). Modern Portfolio Theory (MPT), like all good theories, has some basic assumptions. One is that the markets are efficient. I’m not sure what market they were studying but to assume efficiency is a stretch in my mind. I do think the markets are efficient over time, but never in any way that one can capitalize on it. Plus its efficiency is quite volatile and certainly unpredictable (see my “Market Prescience – How Devine” article). Do investors all trade differently? Use different time frames? Have different views on risk? Use totally different methods of analysis? Of course they do. Do they all know everything there is to know about a stock before they buy it? Not a chance!
Here’s my favorite MPT assumption: Investors are rational. Holy Cow! An entire field of study, investment behavior (see my “Know Thyself” article), has surfaced in the past couple of decades because investors are far from being rational. I don’t think I have to dwell on this one as most of you I’m sure agree that rationality is rare when it comes to investors, especially when talking about all the other investors. Returns are random and normally distributed are two more assumptions used in MPT. Notice that the word return is used as most of modern finance deals with returns and usually on only a monthly basis. Technical analysts deal with price and usually on a daily basis. Monthly data! Why eliminate over 95% of the data? In all my study I have to somewhat agree that a monthly return series tends to be more normally distributed than a daily price series. And, hopefully you agree that prices are not random. Just don’t tell Burton Malkiel. If prices were random, techniques like trend following would never work and I would have been unemployed for the last twenty years.
A normal distribution is a Gaussian distribution like the one you learned in high school. It is for completely random data such as the distribution of heights of all men between the ages of 21 and 45 living in the United States. It works because there is a limit on both ends. No one is two foot tall and no one is ten feet tall. The returns of the market do have a lower limit (-100%) which hopefully has only occurred in a small group of individual stocks, and as a disciplined technical analyst that always uses stops, you wouldn’t know anything about it. In the past decade the term “black swan” has surfaced to describe a statistical outlier; data that is too extreme for the normal distribution. Gaussian distributions do not deal with outlier data well, if at all. Modern Finance and Wall Street are in bed with Gaussian distributions. Why? I think because it is simple and easy to understand, never mind that it is inappropriate. Benoit Mandelbrot tried years ago to educate them but eventually gave up – not unlike fighting city hall. If you have not read his book, The (Mis) Behavior of Markets, you should.
I’m not going to cover it here, but in my book, “Investing with the Trend,” I spent a number of pages showing how a 22 sigma (fancy term for standard deviation) event (October 19, 1987) is beyond human capacity to even comprehend. Its probability of not occurring is beyond galactic in size, a number that is outside the known universe.
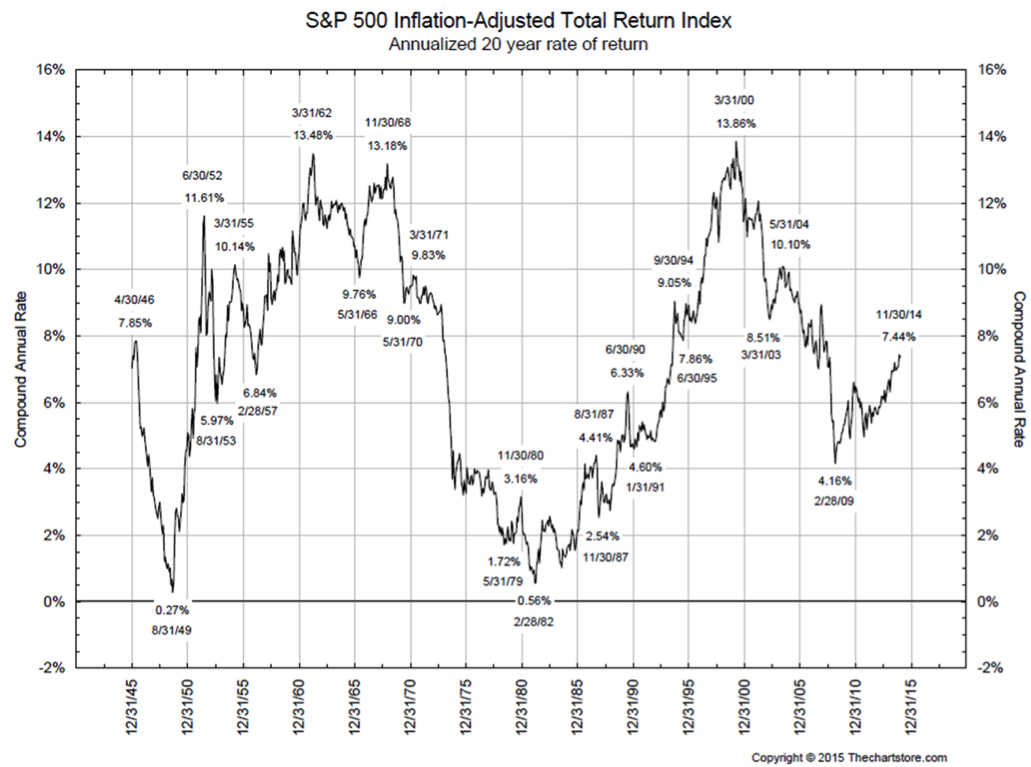
Capital Asset Pricing Model (CAPM) assumes that investors agree on return, risk, and correlation characteristics of all assets and invest accordingly. Rational? This is laughable. The theory also uses some really long term data to determine return, risk, and correlations. Reminds me of the 85 year chart of small cap returns that show they returned 12% per year annualized over that 85 year period; a chart used to convince you to buy and hold. What is wrong with that chart? Is that an appropriate average? You don’t have 85 years to invest in. Most individuals have 20-25 years to sock it away for retirement. In that 85 year period there were a number of 20 year periods that did not come close to the purported annualized return over 85 years. Data should reflect the investors’ time horizon, not used to sell them something. Take a look at a 20 year rolling return chart and you can see what I mean. From the chart below you can see there were periods of time when things were good and things were not so good. A lot has to do with your luck on when you were born if were into the buy and hold mentality. Let’s take a couple of extreme examples. You can see this on a long term chart of the S&P also. Suppose you started investing in 1963 and held until 1983 (20 years). Midway you probably would have abandoned the stock market and called it gambling, never to return to it. Now, suppose you started investing in 1979 and held for 20 years until 1999. You probably would have tried to get membership into Mensa. The periods of substandard performance are during the secular bear markets which I’ll discuss in a future article.
Let me wrap up this boring stuff by talking about risk. This is a term spewed by modern finance and Wall Street on a continuous basis. Sadly, they again miss the boat on how to determine risk. Modern Finance likes to say that volatility is risk as determined by standard deviation. I’ll bet some of you can smell where this is headed. If the term standard deviation is mentioned, then it is also inferring Gaussian statistics, or normally distributed data. So here is a question for you because I know you know what risk is. Assume someone else is managing your money; you receive your brokerage statement in early January and it says for last year you had a standard deviation of .65 and your account was down 35%. Are you going to call them and ask about the standard deviation and why it was .65? Of course not, you just lost over 1/3 of your money and you are going to ask about that – hopefully in a very one-sided manner. Risk is loss of capital – period. It is not volatility as determined by standard deviation, even though Wall Street and Modern Finance think it is. Now I know that volatility can contribute to downside risk, but remember, it also contributes to upside gains. Sorry, you can’t have it both ways, unless, of course, you’re trying to sell something.
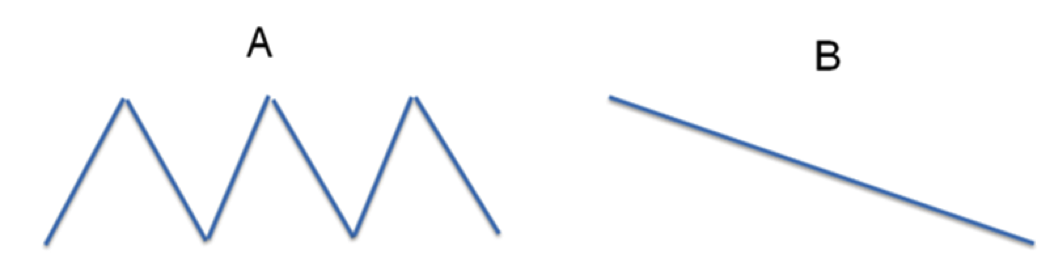
On the graphic below, keeping in mind that modern finance believes that volatility is risk; which scenario has more risk? A or B? There is no volatility in B, yet you lost money. There is volatility in A, yet you broke even. This exceptionally simple example can be challenged by purists, but I use it to make a point – volatility is not risk. Loss of capital is.
The market must deal with uncertainty and this is not the same as risk. Here’s a simple example. You have an urn (yes; that is what we called it in college in the 1960s) and it contains 5 red balls and 5 blue balls. Blindly pick out one ball. What are the odds of picking out a red ball? Well, we know there are 10 balls total and 5 of them are red, so 5/10 = .5 or 50%. That is risk – it can be calculated. Suppose you were not told the number of red or blue balls in the urn; what would be the odds of picking a red ball? Impossible to calculate and that is called uncertainty. The stock market deals with uncertainty.
Finally (is anyone still with me?) MPT deals with risk but it only deals with non-systematic risk which is better known as diversifiable risk. We all agree that diversification is a free lunch and MPT handles that part quite well. However, there is a much larger piece of the risk pie and that is systematic risk, or you might refer to it as drawdown, loss of capital, or bear markets. And this is the risk that technical analysis deals with. So turn off all that modern finance noise, focus on your technical analysis because you are dealing with the big part of the risk pie; the smart part of risk. I promise, no more articles on this stuff.
Greg Morris
Editor's Note: Let Greg know that you are "still with him" by leaving your comments - good and bad - in the Comments section below. Thanks!


