 I honestly cannot remember taking a course in high school or college specific for statistics. I would imagine it was taught along with the many math and engineering courses I struggled through. There was nothing like a draft card with a low number to motivate the successful completion of college in the late 1960s. I can look across my office at the large bookcase and see 9-10 statistics books, plus a few forecasting (uses lots of statistics) books by Spyros Makridakis. If you haven’t read any of Makridakis’ works, and you like this stuff, I strongly recommend him. I remember in the mid to late 1980s, my friend and partner (he might not call it that) Norman North built a statistical analysis software product that used the US Business Cycle Indicators database. You could compare various time series, most were monthly or quarterly, calculate linear regressions, and in fact, do polynomial curve fitting on any series or ratio of two series and offset one by any number of periods (usually months). I remember looking at retail sales and offsetting it by 6 months with corporate profits, thinking it would yield my long held belief that one would reflect upon the other. It didn’t. And yes, a fifth order polynomial fit which is then extended somewhat into the future really looks like you have struck gold, except it rarely played out that way. Sure was convincing though.
Personally I do not think statistics can assist (actually using them) in an investment process other than to learn how markets have acted in the past, which is certainly a worthwhile thing to know. Let me try an example. An often touted example is the “Sell in May and Go Away,” where there is significant statistical evidence (?) that the period from May through October performs worse than the November through April period. I’ve seen this presented many different ways, including the “only investment rule you will ever need to know.” Here is the problem: Exactly when in May do you sell? Do you sell on the open of the first trading day? Do you sell on the close of the last day? A big difference in those two days by the way; in fact they are separated by about 136 trading hours (21 days times 6.5 hours trading hours per day). And it only takes a few seconds to make a trade. If so, what do you sell? Your portfolio, an index, a stock, what? Complementarily, when do you buy in November? The same problem at the other end of the trade. Okay, suppose you nail down a specific day and time of day to sell your SPY Exchange Traded Fund and you also specify a day and time of day in November to buy it back. Now what are the statistics? Let’s just say for example that when you run this over the past 75 years (I know, I know, SPY didn’t exist until 1993 – work with me here) the period from November to May using the exact same buy and sell date and time, returned an average of 6% per year, plus 75% of those years the return was positive. Sounds pretty darn good doesn’t it? If it doesn’t go ahead and bump up those two numbers until you think it does sound good. Okay, here is the problem. Since we are just “supposing,” let’s suppose that when you make your first investment in this “sure thing” process, the first year is a loser. The next year, and in fact, the next 3-4 years are also losers. Are you going to continue this process? Of course you aren’t. You forgot that the complement of 75% is 25%, and that 25% of the time didn’t have good results, and unfortunately you started during a period that made its contributions to that 25% statistic.
Chart A is a chart showing the annual returns of the Dow Industrial Average each year from 1897 to 2013. The decile distribution of returns shows the positive returns in green and the negative returns in red. Visually it is obvious that there are more positive (green) numbers than red ones. Quite a few more returns are green and you can almost imagine where the mean is located, somewhere near the 10% column. In fact, there are 77 positive years and only 40 negative years. So, 66% of the time in the last 117 years the Dow Industrial Average was positive for the year. Not bad, huh! This is why you are always hearing that the market is up on average about 10% a year. Sad commentary, using an average for 117 years. I smell another article there. Let’s play a game! Some might think we just did. First of all it is a fair game. It is $10 to play and you can play as many times as you want. If you win, you will get $1,000,000. The mathematical odds of winning are one time out of six. Seriously the odds of winning are 1 out of 6 times. No tricks, honest. How many want to play?
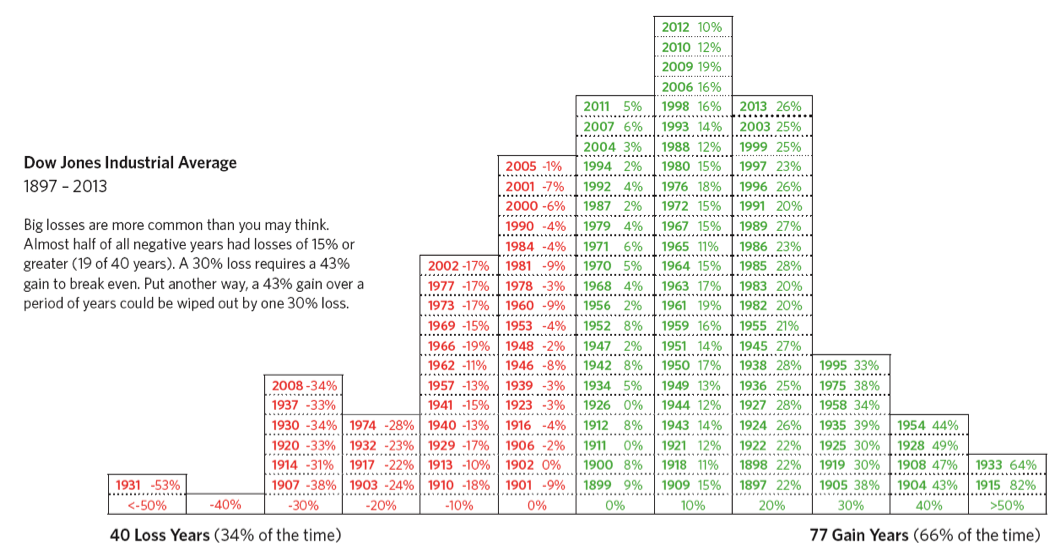
Chart A
The game is Russian roulette. Now, how many want to play? Hopefully no one. What happened? I changed your focus from those goofy statistics to the risk of playing and you realized you didn’t want any part of it. This is exactly why you should always focus on risk in the market. Some might challenge this in that to win at Russian roulette you had odds of 5 out of 6, but that was almost too good to believe and I wanted to hook you right off the bat. I know I have beat this to death in previous articles but I strongly believe most do not give risk enough consideration. The financial media bombards us with statistics all day long. They say the market is up today and has been up for the last six days. Does that offer anything of value? How about this: the market has been up 5 of the last 8 days? Just noise. While this might seem important to some, I cannot imagine a real technical analyst finding it anything but an interruption, that is, if you even bother to watch the financial media.
I have beat up statistics quite a bit here, but will certainly yield to using them for learning and understanding how markets behave. I just don’t think they should be part of an active investment process. They can certainly be used to assess an investment strategy or process, but please make sure you use them in a manner that reflects your investment horizon. Using 85 years of statistics when you have only 20 years to invest can be very misleading. In my opinion, statistics is a perfect example of observable information; you just can’t make a trading decision based upon it. Remember, you’re hopefully trading with real money; if not then statistics can be your friend.
Here’s to your trading success – 83.45% of the time,
Greg Morris


