 Candle pattern filtering offers a method of trading with candlesticks that is complemented by other popular technical tools for analysis. Filtering is a concept that has been used in many other forms of technical analysis and is now a proven method with candle patterns.
Since any one indicator on its own can have inherent flaws, the synergy created by combining different methods of price movement analysis can result in some very powerful combinations. When candle patterns are combined with other indicators, the results are superb.
The filtering concept was developed to assist the analyst in removing premature candle patterns, or for that matter, eliminate most of the early candle patterns. Since most technical analysts use more than one indicator to confirm their signals, why not do the same with candle patterns? Most indicators have a buy and sell definition to help in their interpretation and use. Most, if not all indicators lag the market somewhat, however. This is because the components of indicator construction are the underlying data itself. If an indicator’s parameters are set too tight, the result will be too many bad signals, or whipsaws. Therefore, a pre-signal area was determined based upon thresholds and/or indicator values, whether positive or negative.
The pre-signal area is an area where a trader should look for some sort of signal that dictates that some sort of action be taken, whether it is putting on a new trade or exiting an existing position. Statistically, it has been found that the longer an indicator is in its pre-signal area, the better the actual buy or sell signal will be.
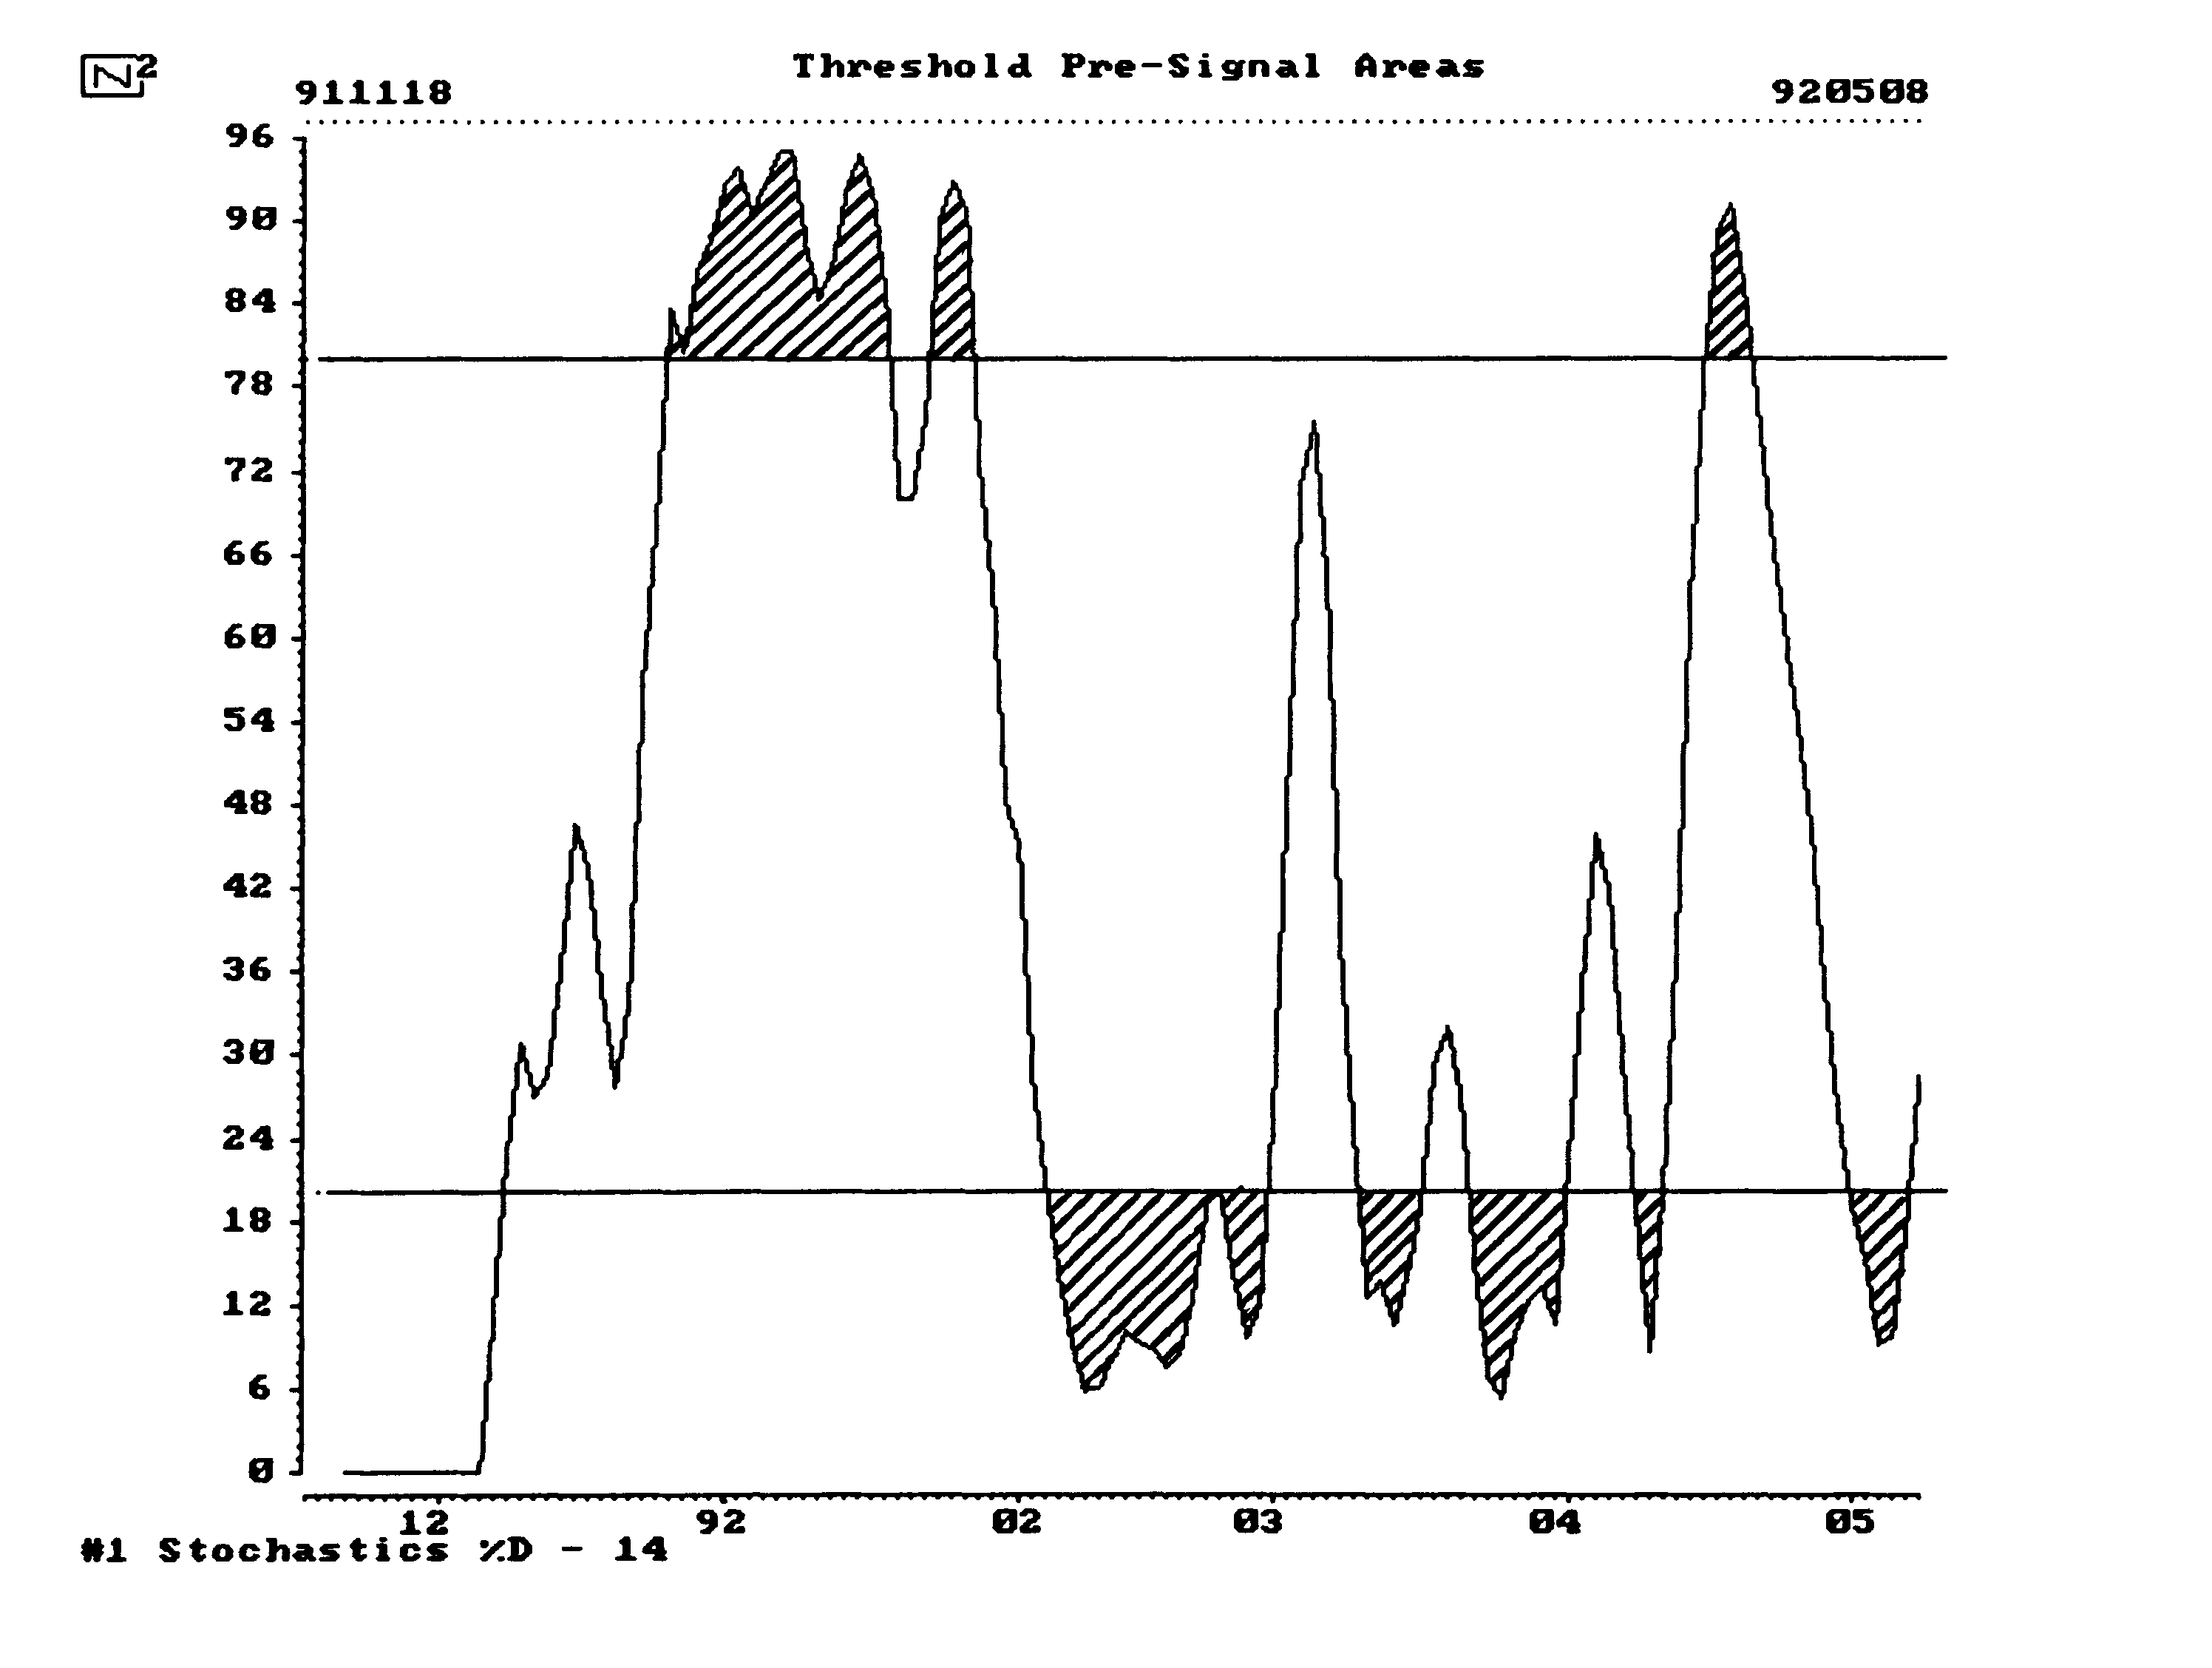
Each indicator has its own unique pre-signal area. When the indicator is in the buying pre-signal area only bullish patterns are considered. Likewise, if an indicator is in the selling pre-signal area, only bearish patterns are considered. For threshold indicators, the pre-signal area is the area between the indicator and the thresholds, both above and below. Figure A shows an example of an indicator Stochastics %D) with upper and lower thresholds. This chart was from the old N-Squared software created by Norm North and me – notice the 1992 date.
 Figure A – Indicator Pre-signal buy and sell zones
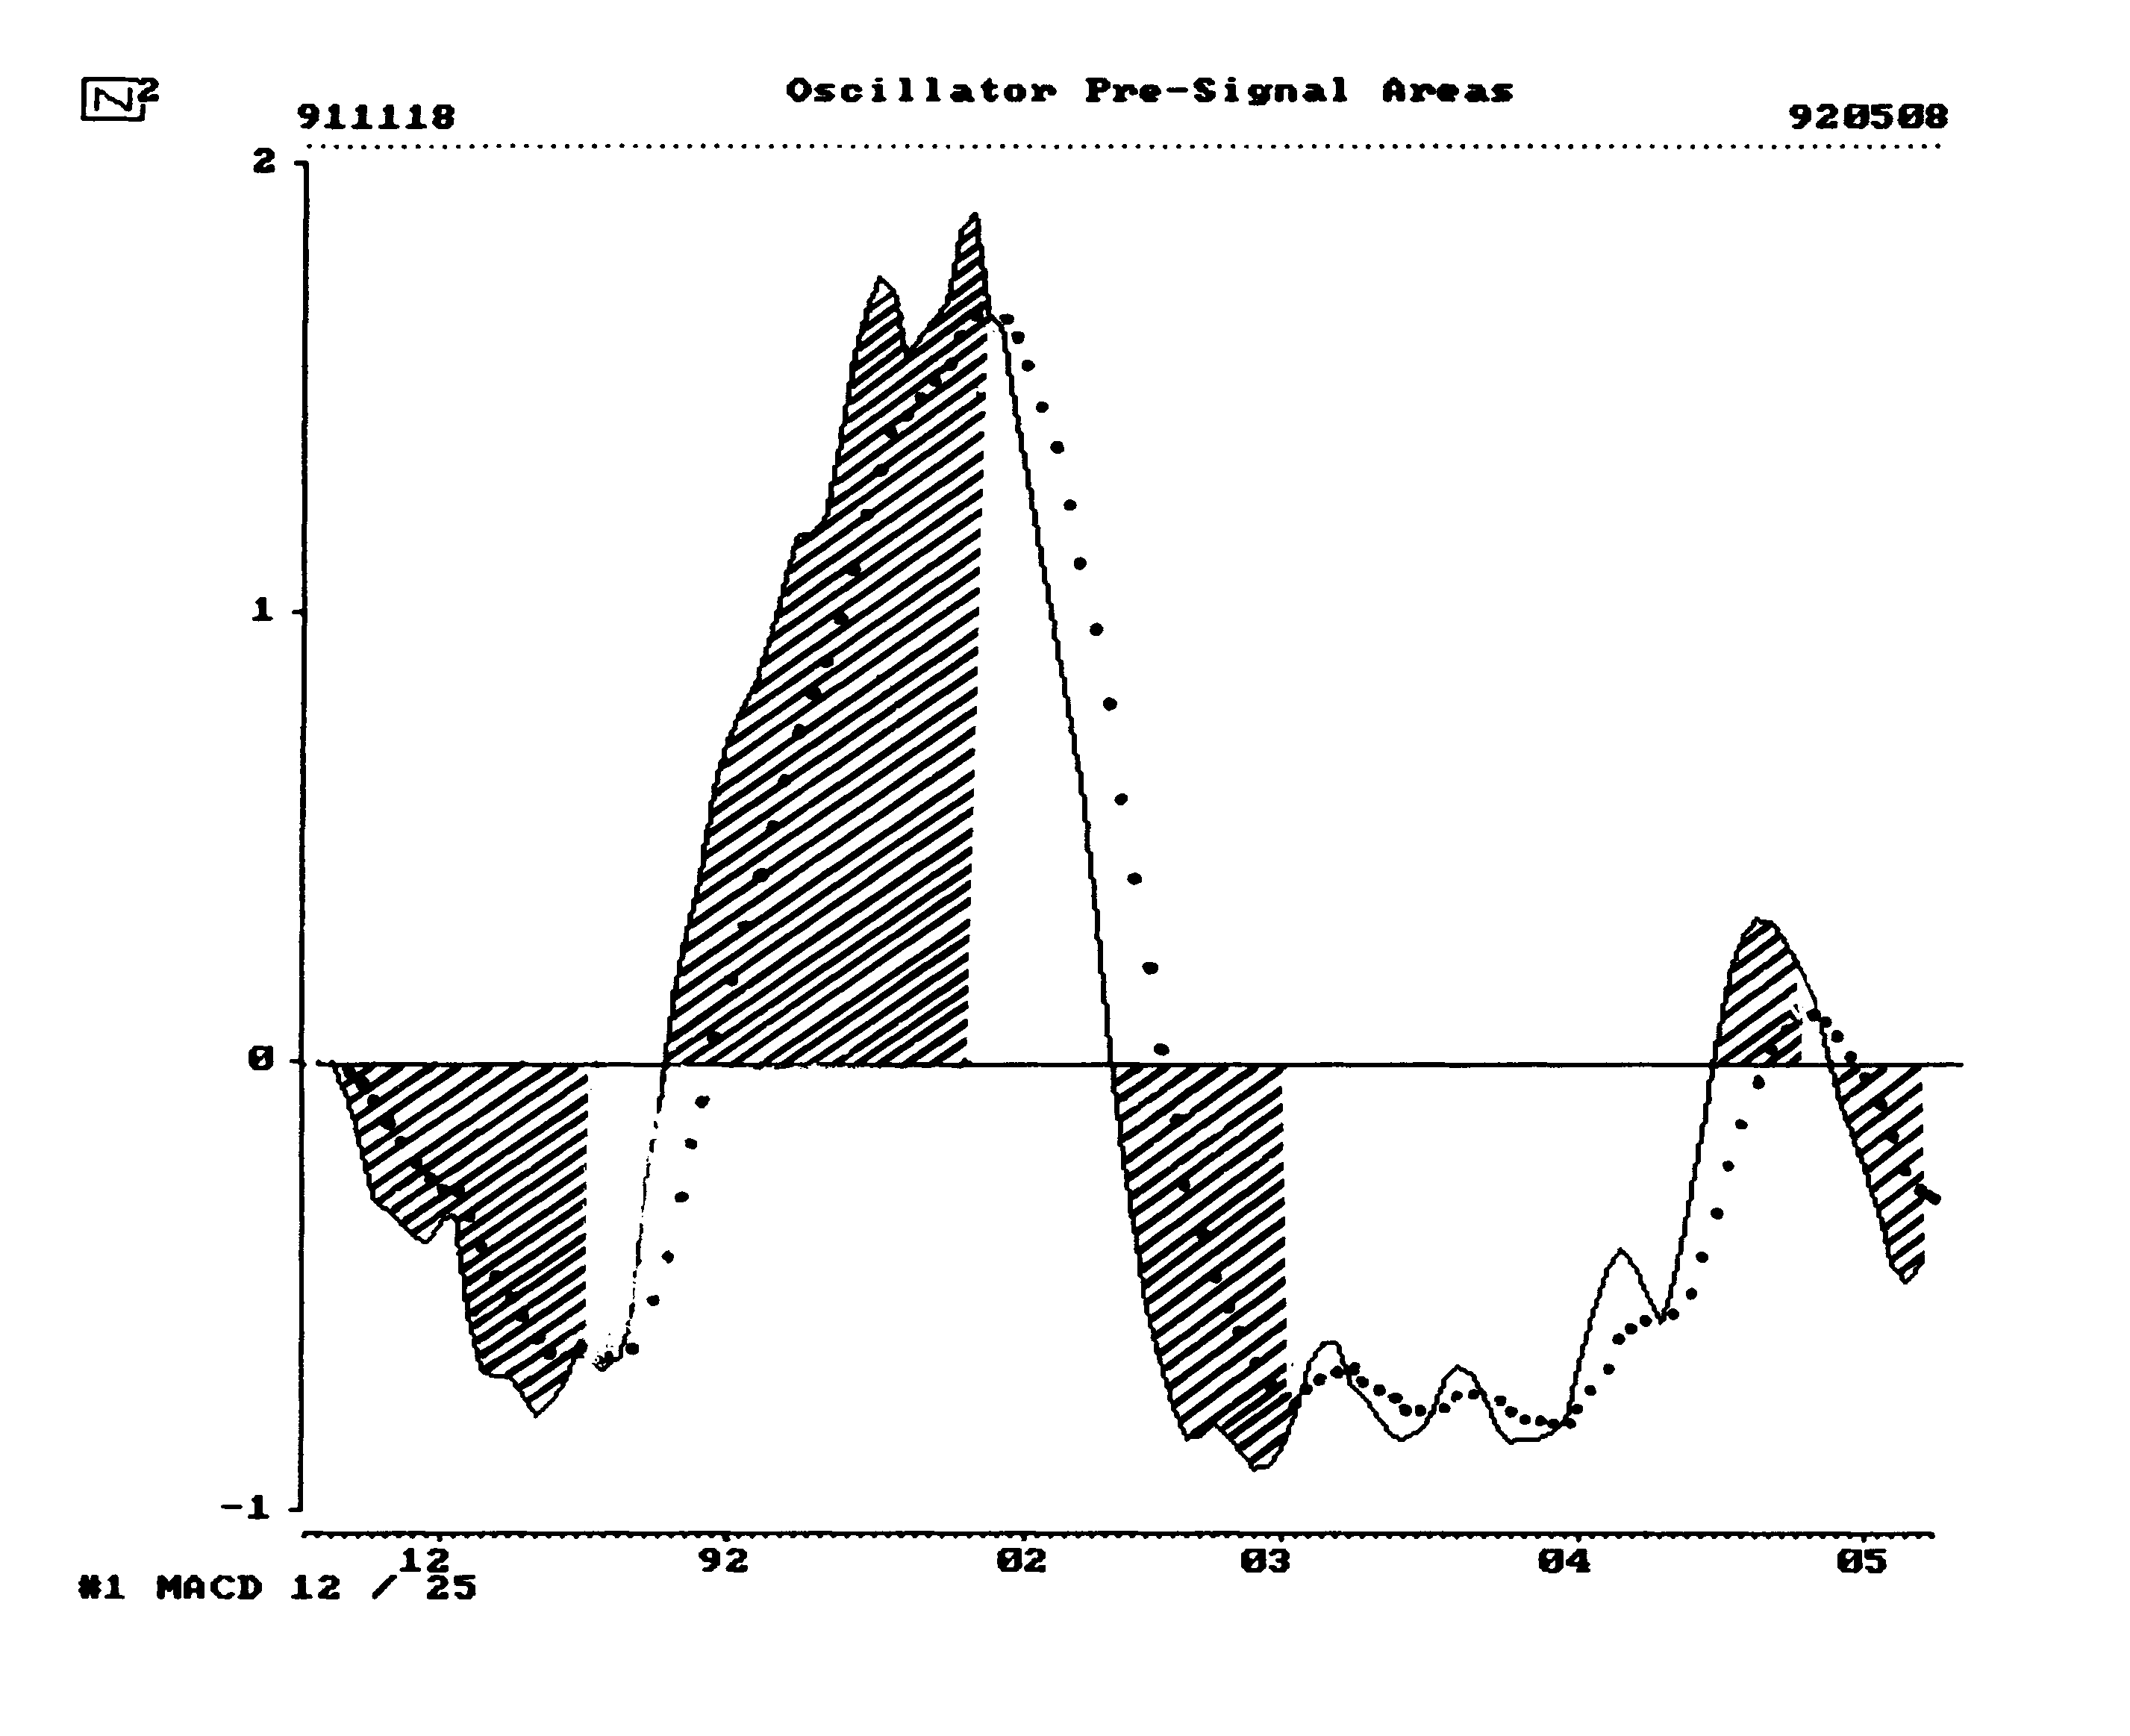
For oscillators, the pre-signal area is defined as the area after the oscillator crosses the zero line until it crosses the moving average or smoothing used to define the trading signals. Figure B shows an example of an oscillator generating signals.
 Figure B – Oscillator Buy and Sell Signals
Chapter 9 in Candlestick Charting Explained goes into great detail regarding the back testing of candle patterns with various momentum indicators. A wealth of statistical evidence is presented that shows how combining candle patterns with these indicators can enhance trading results. Chapter nine presented various momentum indicators, giving a brief discussion of each along with a sample trade. It will be up to you to take your research and understanding of these indicators further to learn their characteristics and to develop a comfort level in using them.
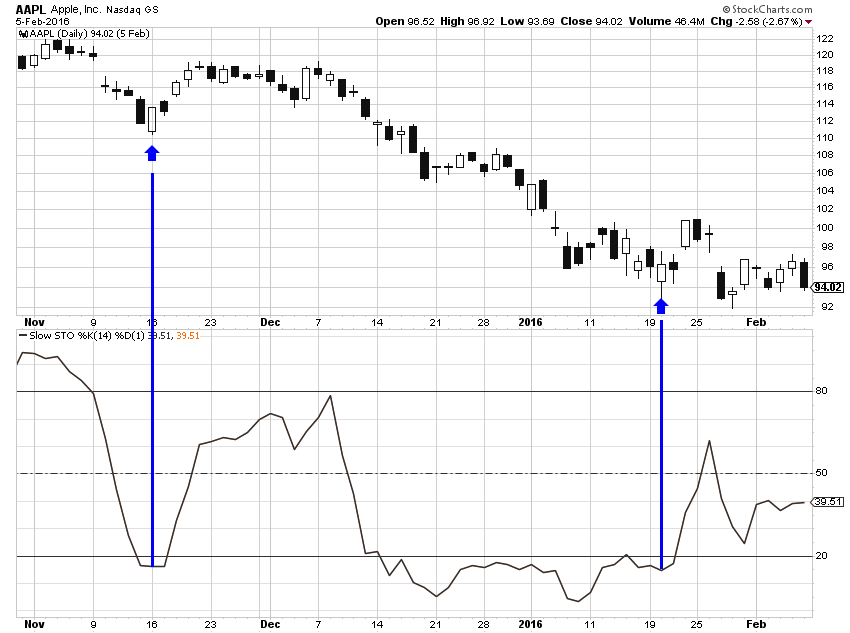
Also notice the combination of candle pattern and indicator position in the trade setups. While these may seem like obvious hand-picked examples, you must realize that with the chart scanning features in modern charting software, a user can scan for specific candle patterns and indicator positions to look for preferred trading setups. By making use of the technology available any trader can filter setups to only include those that have a higher probability of success.
Figure C is an example of filtering using Stochastics %D. A couple of filtered patterns are highlighted with the sole purpose of showing you the concept of filtering.
 Figure C
Dance with the Trend,
Greg Morris


