 Once a bear market gets underway (nautical term), few will make adjustments to their portfolio. Usually it is well into the decline before most even begin to get concerned, and then they are convincing themselves that it is too late and they might sell right at the bottom. That is certainly the siren song of most. Market tops are extremely difficult to identify except in that wonderful world many live in called hindsight. Especially after an extended bull market well into its 7th year.
Chart A is the Nasdaq Composite with its top in March of 2000, with data displayed one year before the top and one year after the top. If you were active in the market then you probably remember that for much of 1999 the ONLY thing going up in price was large cap dot.com (growth) stocks. Breadth and small cap issues were declining. A difficult time for most, certainly for those who would admit it. So let me ask you some questions; try to be perfectly honest with yourself and try hard to ignore what you can see past the point of discussion on the chart. The lower blue line is 20% below the top blue line which is at the market top in March, 2000. A 20% decline is generally accepted as entering into a bear market. Once the Nasdaq dropped below the lower blue line observe all the volatility that took place April-May, 2000-time frame. Technical indicators got beat up then. The market then rallied back above the lower blue line, so what would you do near the blue arrow? What about the red arrow? At the time, it certainly appeared that we had witnessed one of the shortest bear markets in history. Yet, we now know full well that it was just playing with us and about to be the largest decline in Nasdaq history before it was over. So what is the purpose of the rambling little exercise? Simply that you must have belief in your technical indicators and tools and react to them each and every time they give you a signal. They will be wrong at times and your ability to follow them and rely upon them will be challenged. This is a generalization, but your technical process will be right more than that space between your ears.
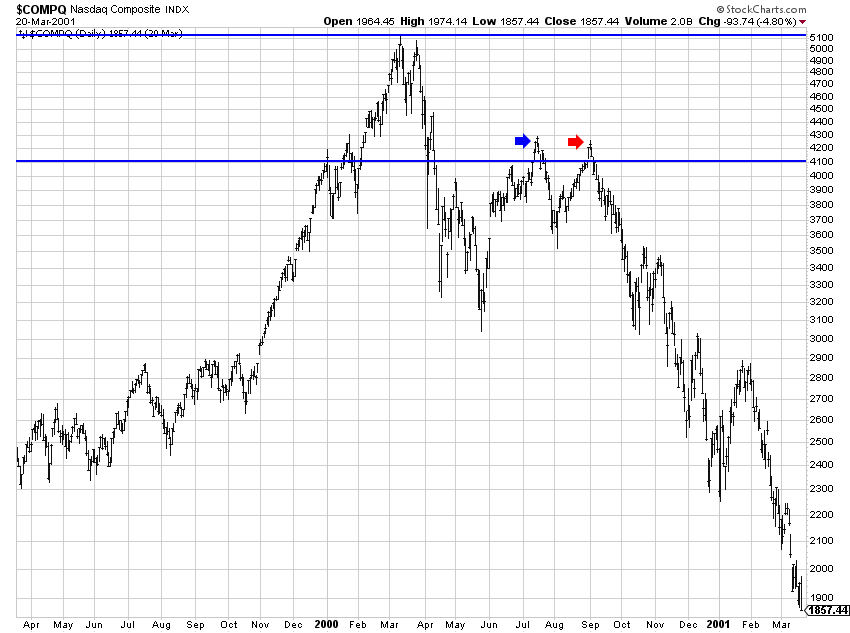 Chart A
Once a big bear is declining, you will often have difficulty selling your holdings, especially during prolonged periods of decline. One of the big problems with this is best told by relating it to someone yelling ‘fire’ in a crowded theater. Everyone is scrambling for the exits and many get hurt in the process because the exits become clogged. Exiting your holdings during the worst part of a bear market can yield similar results. However, there is one giant difference. In the theater scenario there were exits to use to get to safety. In a big bear market there might not be any exits (buyers). Remember, in order to sell, someone has to be buying.
One of these days we will put in a top. I do not know when it will be and no one else does either. However, I know that I have a technical process that has worked for years and I’ll stick with it. Hope you have one also.
Dance with the Trend,
Greg Morris