 We are still in the preliminary stages of defining tools that will be used in the rules-based trend following model. Here I want to explain a unique concept I call Compound Digital Measures. They are an advanced form of the Digital Measures discussed in the BaR-BTFM – 2 (Building a Rules-Based Trend Following Model).
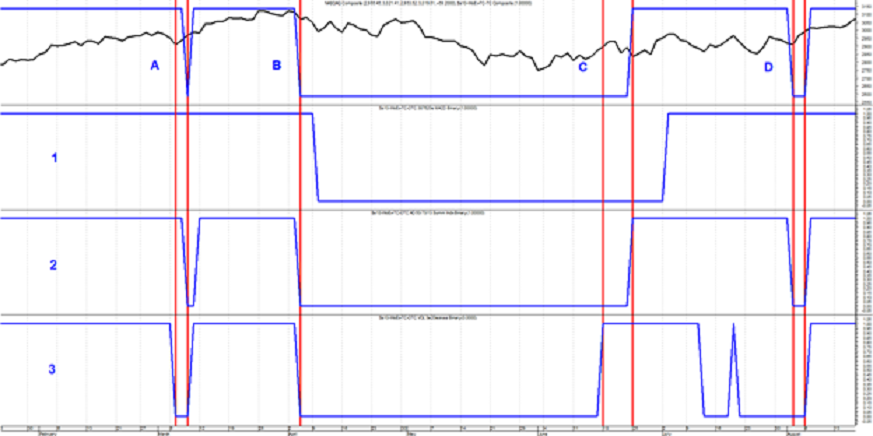
Chart A will help you understand how a compound measure works. First, you need to know that this is not a complex system, as the signals work whenever two of the three indicators are in agreement, the compound measure moves in the same direction. This means that all three could be signaling, but it only takes two to accomplish the goal. In Chart A the top plot is the Nasdaq Composite. The next three plots contain the digital indicators for the three components, in this example they are called 1, 2, and 3. There are 4 instances of signals from those three components, labeled in the top plot as A, B, C, and D. Let’s go through them starting with signal A. Notice that there are two vertical lines, with the first one being created by indicator 3. Notice how indicator 3 dropped from its high position to its low position; that is a digital signal from indicator 3. The next vertical line shows up when indicator 2 drops to its low position. We now have two of the three indicators dropping to their low position, which means the compound digital indicator overlaid on the Nasdaq Composite in the top plot now drops to its low position. Shortly, indicator 3 rises and that leaves only indicator 2 at its low, hence the compound digital pops back up. When indicator 2 goes back up, it has no affect on the compound digital because it was the only one still down.
 Chart A
The second signal at B occurs when both indicator 2 and 3 both drop to their low position at the same time, once again this is a signal for the compound digital in the top plot to drop to its low position. Moving over to signal C, you can see that indicator 3 rose to its top position followed a few days later by indicator 2 rising to its top position, which in turn causes the compound digital in the top plot to rise to its top position. Example D below shows indicator 2 dropping to its low position. This has caused the compound digital to drop because if you will notice, indicator 3 had already dropped to its low position many days prior to that of indicator 2. In example D, notice that both indicator 2 and 3 both rose on the same day and indicated by the rightmost vertical line, which of course caused the compound digital to also rise. The concept is simple; it only takes 2 of the 3 indicators to control the compound digital in the top plot. It does not matter which two it is or in what combination. As you can hopefully see, the process could be expanded to using 5 indicators and using the best 3 of the five.
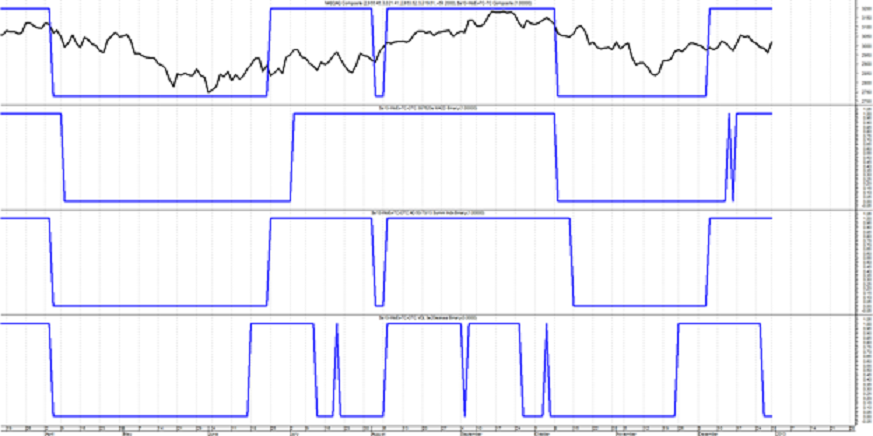
Now try to the process of the compound measure in Chart B without any visual or verbal assistance. In Chart B the top plot contains the Nasdaq Composite and the compound digital. There are digitals for three indicators below and they work just like the example in Chart A, any two that are on is a signal for the compound digital to move in the same direction. Good luck!
 Chart B
I have been using these for decades and truly understand that if this is your introduction to compound digital measures, then they appear difficult. They really are not; they are a valuable method of indicator democracy. That is, the majority rules. The best use of compound measures is to have 3 indicator digital measures that are not correlated, such as price, breadth, and relative strength.
Dance with the Trend,
Greg Morris


