What is risk? The sterile laboratory of modern finance wants you to believe it is volatility. They say that volatility is defined as standard deviation. I have opposed that academic mentality often in these articles. If you use standard deviation it means you also believe the markets are random and normally distributed. Anyone who believes that probably also believes in astrology, Fibonacci series, and a host of other magic tricks. Most investors know what risk is when they open their annual account performance statement and see they have a standard deviation of .36 and their account is down 32% for the year. Do you think they call their money manager concerned about their standard deviation? Of course not, they just lost 32%; that is what they are concerned about.
Loss of money is risk, and loss of money can be measured by a concept called drawdown. Drawdown measures how far an investment account (or market, index, ETF, stock, etc.) has fallen from its previous high value. Drawdowns of -10% to -20% are generally considered "corrections" while drawdowns of greater than -20% are known as bear markets. This article will try to convince you that real risk is drawdown, and not volatility as modern finance wants you to believe.
Drawdown has two components, its magnitude (amount of decline) and its duration (amount of time it was below the high price). Many forget that the duration of drawdown is also important.
Index investors in the S&P 500 have seen 2 major bear markets in the last 20 years. The below table shows the magnitude of those drawdowns and how long the recovery was before investors were able to start making new investment gains.
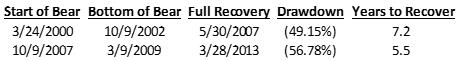
Table A
The bear that started in March of 2000 saw accounts get cut nearly in half, and spent over 7 years losing money and then trying to recover losses to get back to even. The bear that started in 2007 had a larger drawdown magnitude, seeing a nearly 57% decline, but the recovery back to even happened almost 2 years quicker.
Which was worse? It probably depends on a number of things like your age, your net worth, the actual dollar values lost, and when you need the money from your investment account. A drawdown of 25% that takes a long time to recover might be far worse for you than a drawdown of 40% that recovers quickly.
If you are building your own trading/investing strategy, and run backtests to determine the efficacy of your system, I highly encourage you to evaluate all the drawdown periods. Many do-it-yourself investors choose which system to use based on only the final outcome – which one provided the best return over time. This can often be a mistake because they fail to evaluate if they could have actually stomached the trading on the strategy over the whole time period. Investing is like dieting this way, the best plan for you is the one you can actually stick with. A strategy that has great returns over a 10-year period but also had significant drawdowns is one that most investors can't handle when real money is on the line. You might think you can, but seeing losses of $40,000 on a $100,000 account, or maybe losses of $200,000 on a $1M account, can have a tremendous negative impact on your psyche when you start to think of those lost dollars in terms of time spent earning them, or the lost purchasing power in retirement. You have to be very honest with yourself in this process and not be swayed by the outcomes of strategies that you really can't achieve.
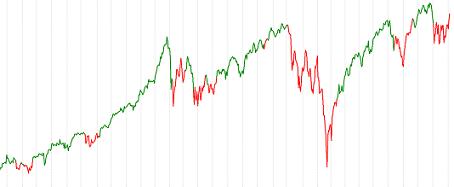
Passive investors and the "buy & hold" crowd also ignore drawdown far too often (especially 10 years into a bull market, like we have right now). They choose not to actively invest their money, as their plan is to never sell and just passively invest in index funds for the long term. Most of them are fooling themselves – not being honest about their ability to hold through the severe downturns that are inevitable. Buy & hold investing in index funds only works if you can accomplish both steps, buying (easy) and holding (hard). Most investors can't hold when an index falls 30%-40% – they panic-sell on the way down because accruing additional losses of real sizeable dollar amounts is far too painful!
Below are charts showing various measures of drawdown from our trend following strategies. The period of analysis used was from January 1997 through September 2019 (~22 years). This is an important time frame as U.S. equity markets experienced two large bear markets during this period. Please note, that when we show performance metrics in these articles for the Trend and Trend Plus strategies, they come out of our model and are not results from actual trading over the entire time period. Live trading on the current strategies has been done since 2016, with verified performance results starting in January 2017. When we present metrics from live trading on the actual strategies, we will note them as such.
Chart A shows the maximum drawdown of many market indices and our trend strategies. We don't think it is necessary to elaborate on this as it is obvious that our strategies are very focused on avoiding large losses.
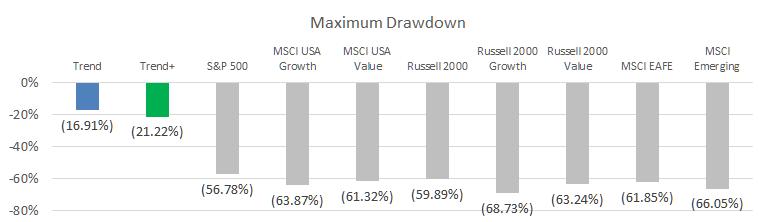
Chart A
Chart B shows the same issues and the number of times there was a drawdown greater than 10%. Keep in mind this data also includes all drawdowns greater than 10%, some which could be in Chart C showing drawdowns of greater than 20%.
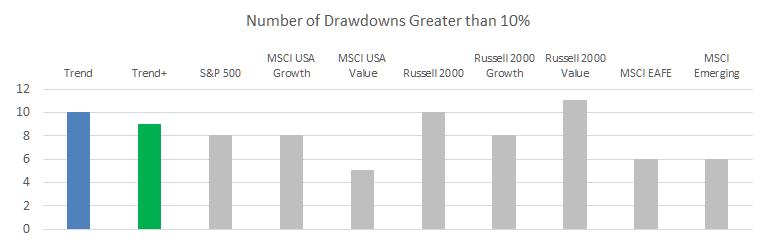
Chart B
Chart C shows the same issues and the number of times there was a drawdown greater than 20%.
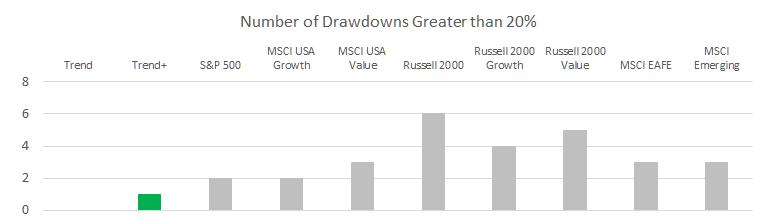
Chart C
Recall that earlier we said drawdown is not just how far an issue declines (magnitude) but how long it stays in a state of drawdown (duration). Chart D shows the issues and the number of months those issues were in a state of drawdown greater than 10%. Seeing your account down more than 10% often leads to second-guessing your investment plan.
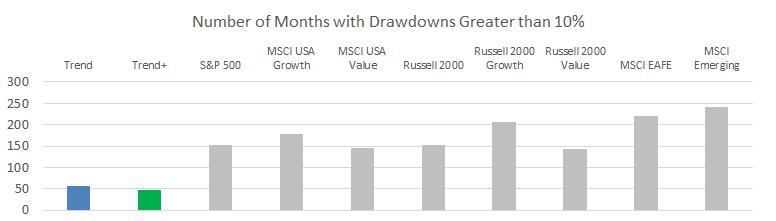
Chart D
Chart E shows the number of months that the issues were in a state of drawdown greater than 20%. Seeing your account down more than 20% is obviously even more difficult and will cause many investors to abandon their plan.
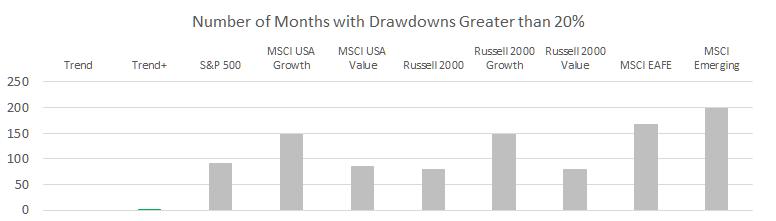
Chart E
It should be obvious that trend following focuses on reducing drawdowns and avoiding large losses. We think this is absolutely necessary to not only compound over time at a higher rate (large losses kill compounded returns) but also to make for a smoother ride with fewer gut-wrenching times that investors and clients want to abandon their plan. Of course, avoiding large losses is only beneficial if you can also deliver adequate returns, which we plan to present in a future article. Like we always say, we try to participate in the up markets and avoid participating in the big down moves.
Dance with the Trend,
Greg Morris


