Last time we showed you charts of many different market indices along with two of our strategies. We started with drawdown (our preferred measure of risk), instead of starting with returns, as we believe that managing risk is the more important aspect of developing strategies. Risk management is paramount to an investor's ability to stick with a strategy – and the returns of a strategy don't really matter if the investor will never be able to withstand the painful periods (and yes, all strategies go through painful periods, especially buy & hold).
Here we will show you more charts of the same indices with different measures of comparative performance. This data covers the period from January 1997 through September 2019; a time which experienced two bear markets.
Chart A shows the compound annual growth rate of each issue. Our strategies have significantly outperformed major indices over full market cycles. We think trend following should be a "friend" to all investors - most people are more focused on returns than on risk management (even if the returns are a direct result of risk management) and trend following has historically performed well over full bull and bear cycles.
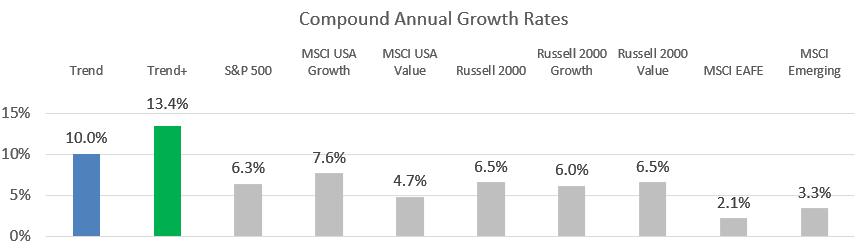
Chart A
Charts B and C show the best and worst monthly returns, respectively.
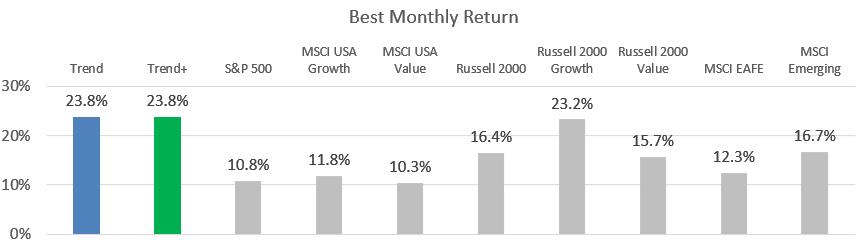
Chart B
Stop levels are maintained at all times and will move the strategies defensive when equity markets sell off, reducing the worst months.
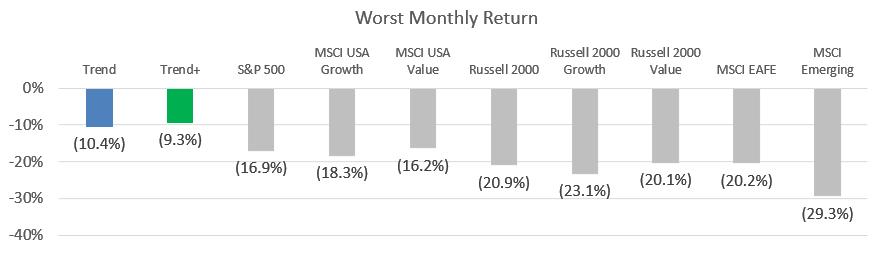
Chart C
Chart D shows the annualized volatility of each issue. Annualized volatility is based on the standard deviation of daily returns; standard deviation being the degree to which the returns vary from the average over a given time period. As stated in the previous article, we don't think volatility is as important as drawdown in measuring risk for investors, but it can provide insight to the return behavior when comparing it to other strategies – with lower volatility being evidence of a lower risk strategy.
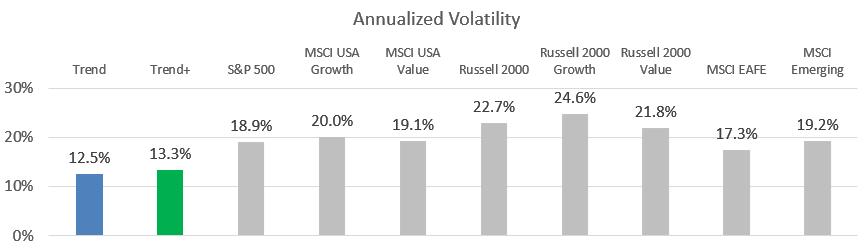
Chart D
Chart E shows the Beta of each issue when compared to the S&P 500 Index. Beta is often thought of as the measure of systematic risk, or exposure to the movements of the overall stock market.
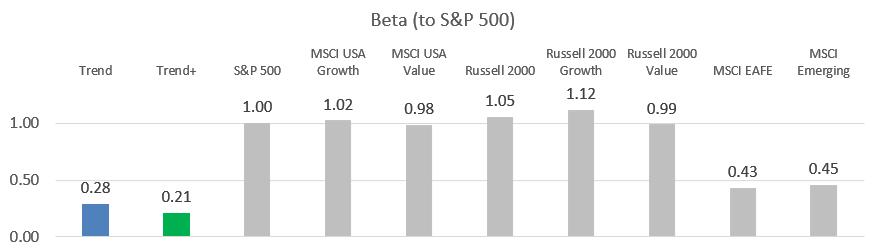
Chart E
Chart F is the correlation of our strategies and the other indices to the S&P 500.
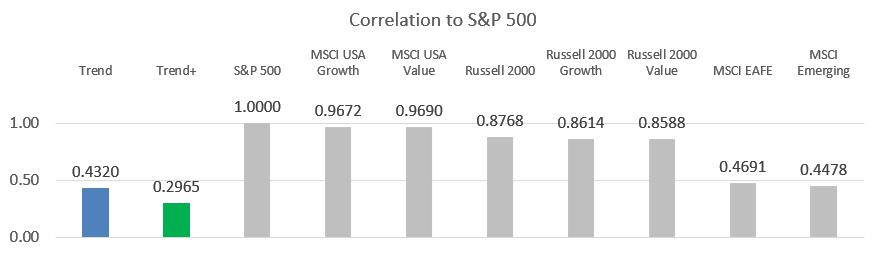
Chart F
The benefits of diversification (reducing risk at a given level of expected returns) are driven from the inclusion of low or non-correlated assets in a portfolio – this is why most people invest in stocks and bonds together and may even diversify into other geographies – looking for assets with low correlation. What is often missed by financial academics and followers of Modern Portfolio Theory, is that diversification benefits can also be realized by combining different investment approaches that have a low correlation to the existing portfolio. If you are a buy & hold investor and already have something like a traditional 60/40 stock and bond portfolio, you will receive great diversification benefit (i.e., risk reduction without sacrificing returns) by adding a tactical approach like trend following to your existing portfolio.
If you are a do-it-yourself investor working on your own strategy or trading system, we hope these articles provide some insights into ways to evaluate your own performance and ability to stick to your approach, and might encourage you to incorporate multiple investment approaches to receive benefits from diversification.
Dance with the Trend,
Greg Morris
