
On February 13, 2020 we published an article called "Ready for a Bear?". On that day, the S&P 500 and Nasdaq Composite were closing near all-time highs, and 3 trading-days later on February 19, 2020, they both notched their peaks of this 11-year bull market cycle. The Dow Jones Industrial Average peaked a little earlier on February 12, 2020, the day prior to our article. Were we trying to "call a top," or did we know that a market crash was imminent? Of course not – no one knew – even though pundits and clowns on TV will try to tell you they did!
The purpose of our previous article was simply to explain that there was evidence mounting that we would have a bear market in the not too distant future and it's best to prepare for those ahead of time. We had no idea how close the "not too distant future" would be – mere weeks from when we published.
We are trend followers who use an un-emotional rules-based model to manage how we invest, for ourselves and our clients. We think trend following is the best approach to investing, in any market environment, because it is always prepared for the eventual bear market. Bear markets are what destroy most portfolios and retirement plans and we don't think you should take chances with your serious money.
At the time of our last article, we did know that certain components of our Weight of the Evidence were deteriorating and turning off.
- On January 27th, the first indicator in our model turned off. This is a short-term breadth indicator that looks at Advances and Declines.
- On January 31st, 2 other indicators turned off; a short-term price indicator and one of our relative strength indicators that looks at how small cap is trading compared to large cap.
- On February 3rd, another breadth Advance/Decline measure turned off.
- On February 7th, a breadth indicator that looks at new highs versus new lows turned off.
As you can see, breadth was deteriorating at the end of January and into February. Greg has written dozens of articles in this blog on StockCharts.com about market breadth and its value at market tops. You can scroll through the archive on ‘Dancing with the Trend' to find them. Breadth can provide an early warning of "topping" activity – but as with any type of indicator it gets it wrong sometimes too.
After February 7th, the market continued up for a little while, and we actually saw improvement in our model readings with some indicators turning back on. Our positioning didn't change through this time period though, we just paid very close attention to the market action.
The first big down day after this point was Friday, February 21st, which had a minimal impact on the Weight of the Evidence reading. Given the strength of the uptrend we had been in, our stop level was at the widest setting of 6%. The close down on the Nasdaq on Feb. 21st put us within about 3% of our stop level.
Then, on Monday Feb. 24, the market gapped down over 3% and opened below our stop level. We use specific trading rules to try to avoid selling in a flash crash or other trading anomaly, but when the market stayed below our stop level after our trading rules expired, we sold out of the equity positions (QQQ and ITOT). If you have read previous articles, you know we use these ETFs because of their high correlation with the Nasdaq Composite Index.
Selling begets selling, and more indicators turned off each day as the pullback led to a correction, which led to a full-fledged bear market with major averages being down over 20% on March 12th. Sometimes, when our Trend model is quick to sell, it ends up being a whipsaw trade with the market bouncing back rapidly – we are more than willing to withstand those whipsaw trades because we consider that the "cost" of always having significant downside protection for when the markets don't bounce back. Like now.
Table A shows sort of a timeline of the model readings.
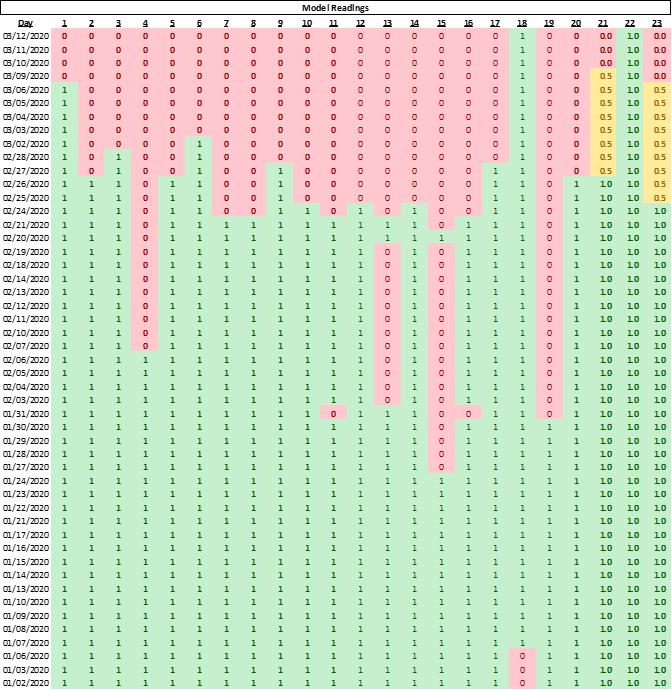
Table A
For obvious reasons we cannot provide the exact indicators being used, and have just assigned numbers to them, but the way to look at this is that each column is an indicator that provides its own determination of whether the market is in an uptrend (1=yes, 0=no). This is what goes into the Weight of the Evidence – we don't rely on any single indicator, rather we look at when multiple (and different) indicators are all confirming an uptrend. Nearly all of this is discussed in Greg's book, "Investing with the Trend".
Chart A shows our model positioning over time, with green indicating when we were invested in QQQ and ITOT, and red when we were in money market funds for TREND, and in GLD and IEF for TREND PLUS. We've shown this before for 2019, but have expanded it into 2020 to show the recent activity.
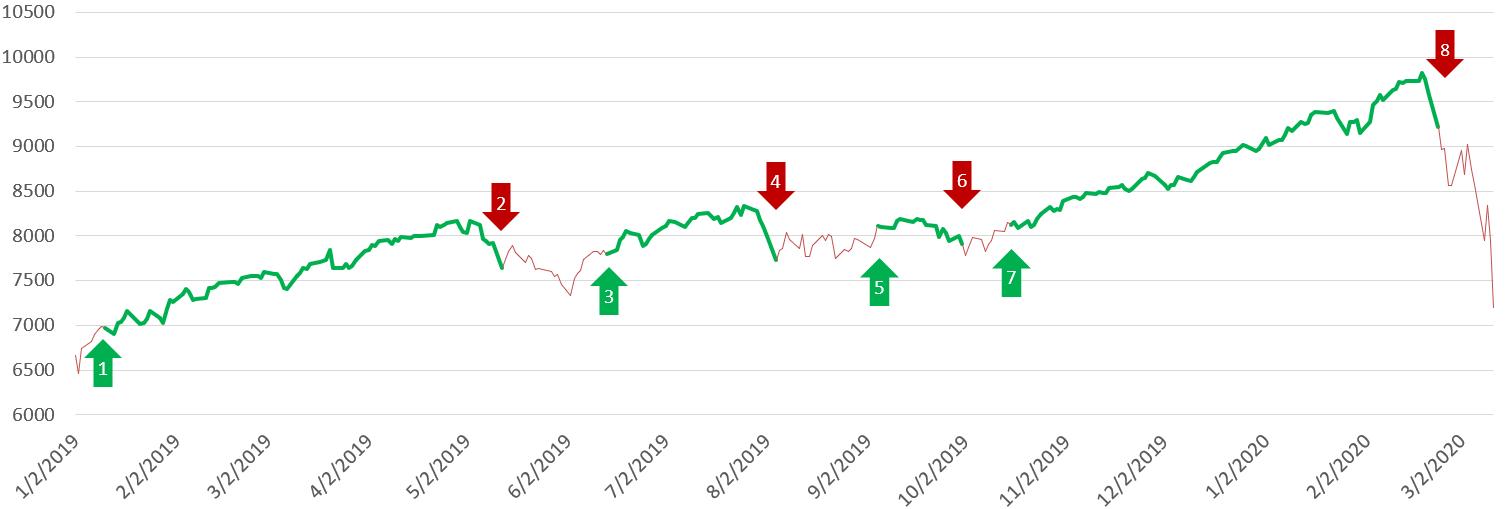
Chart A
Buying at #3 and selling at #4, and buying at #5 and selling at #6, where both whipsaw trades. These aren't fun when you are in the midst of a bull market, but they are part of any rules-based approach and typically result in merely lagging the market while it's moving up – these are the trades we are always willing to make to ensure that we also sell at #8.
As of the close on March 12th, the Dow, S&P 500, and Nasdaq are all more than 20% below their highs - officially a bear market.
So, what now? Many who have ridden the market down to this point might think it's now too late to sell out of their positions and start taking a new approach. We disagree. It is always a good time to give up on an investment approach that is not meeting your needs. No one knows if the market is going to rebound quickly, trade sideways for a while, drop another 20%, or anything in between. Any outcome is possible, and since there is a very real possibility that more losses could occur, liquidating positions to protect capital might be the best option. The hard part about selling now is that, if you don't use a process like trend following, there will be no clear sign of when to get back invested. Nobody announces that the coast is clear and a new bull market has begun - the bottom will only be identified in hindsight.
Our process will get us back invested when the next uptrend is established and we're happy to sit defensive until then.
Dance with the Trend,
Greg Morris


