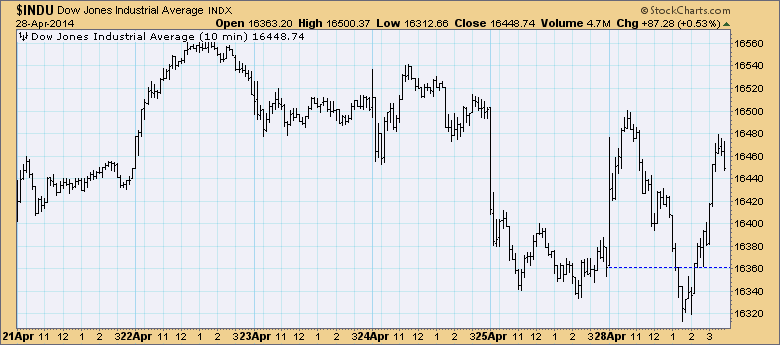
The market had a volatile day, swinging up, dipping low and then recovering to close up. Expectation on a rally would be short-term indicators switching direction and maybe even making climactic moves.
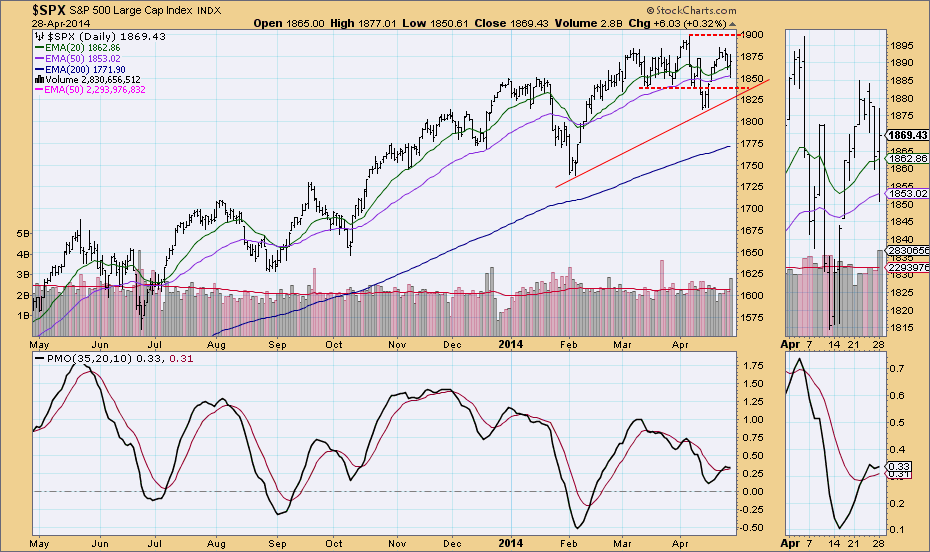
Looking at the daily bar chart, price still looks like it is topping out. Yesterday's high was not exceeded and today's low poked below the 50-EMA. Volume was very high on a positive close which is usually bullish, but it looks like near the day's low, short-covering began and drove price and volume higher.
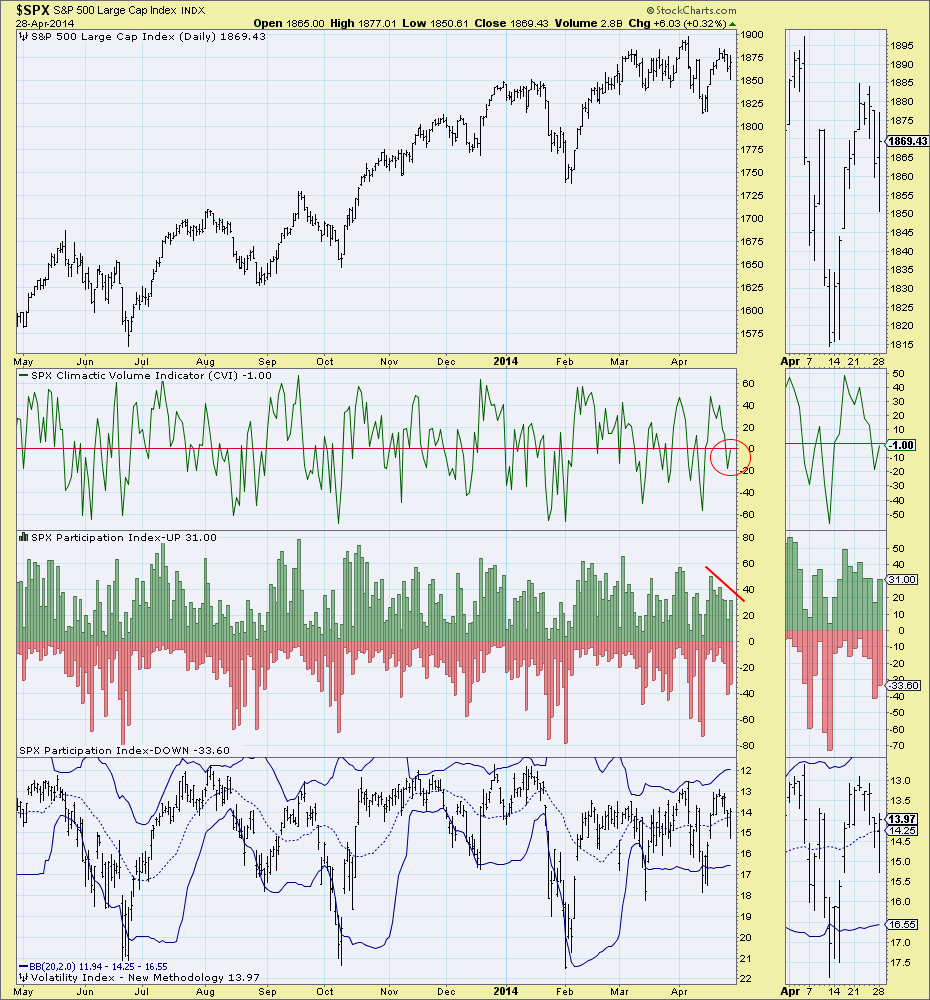
The volatile short-term indicator chart for the SPX shows little action on the CVI and while the Participation Index-UP did increase, it is still in a declining trend.
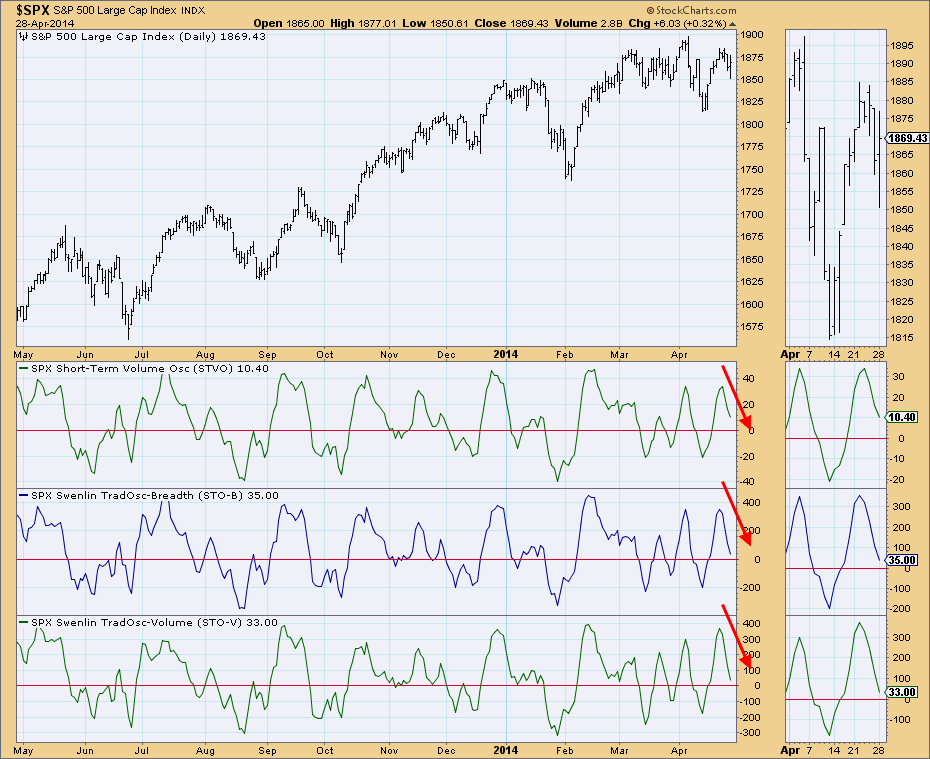
Short-term indicators are still falling and haven't reach oversold levels.
Despite a close up of more than 0.5%, short-term indicators didn't really react. The price pattern on the SPX looks like a slow rollover. I suspect support will be tested at the rising bottoms line or horizontal support at the recent lows near 1835 and 1815.
Happy Charting,
Erin


