Before there were scans, there were DecisionPoint Tracker Reports. While my scans are useful, the Tracker reports still provide some of the best timing and ranking information around to help you sniff out investment opportunities across the major indexes, ETFs, S&P 400, 500 & 600, mutual funds and more. You'll find the Trackers in where else? The DP Tracker blog!
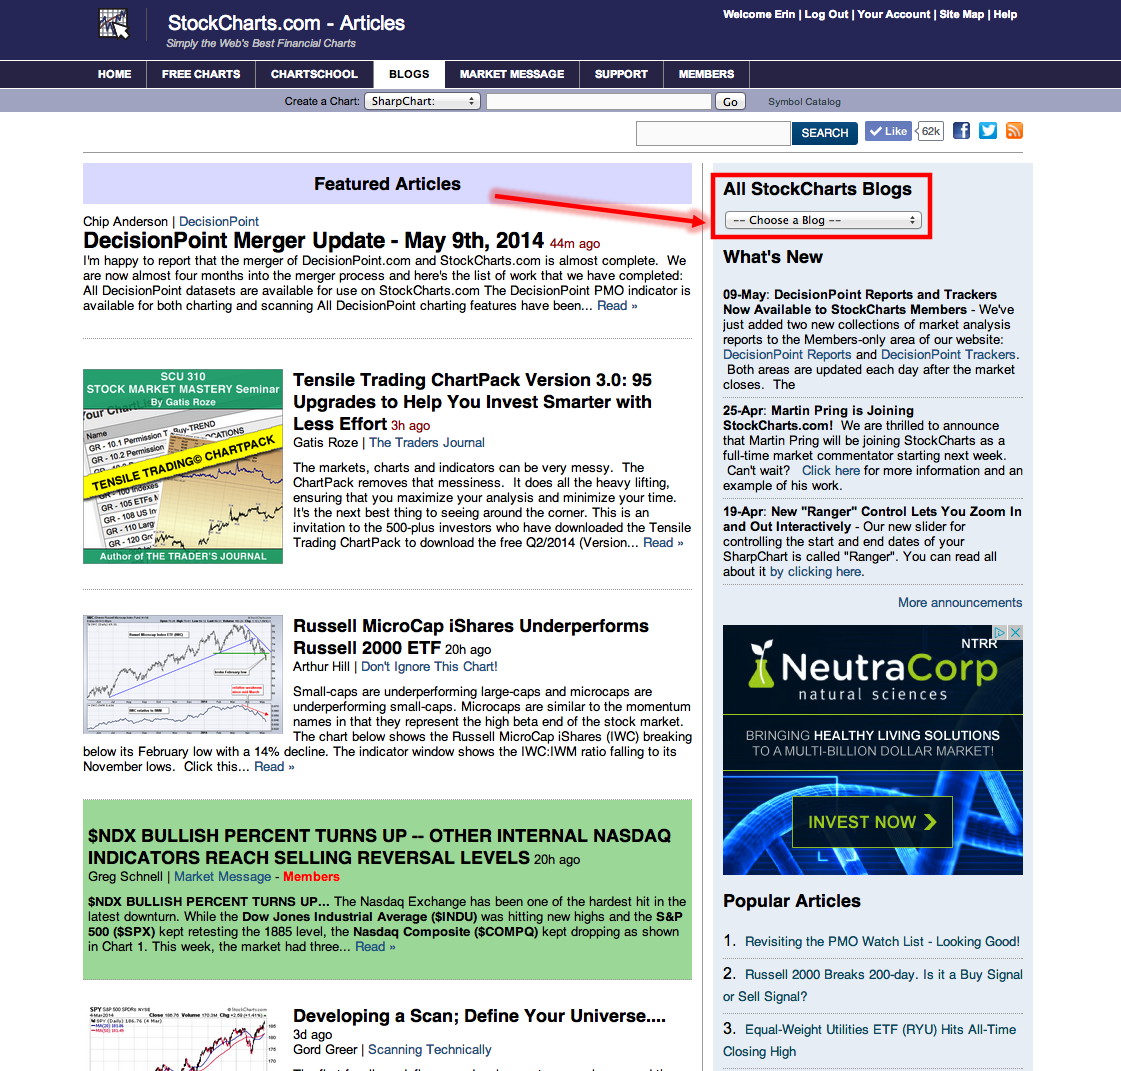
You can access the DP Trackers blog only if you are paid member of StockCharts.com so DecisionPoint transplants, you need to renew right away (check my article on how and why to renew in the DecisionPoint blog)! You can either click on the "Blogs" tab at the top of any StockCharts webpage and select it from the drop-down menu on the right-hand side of the page (see below):
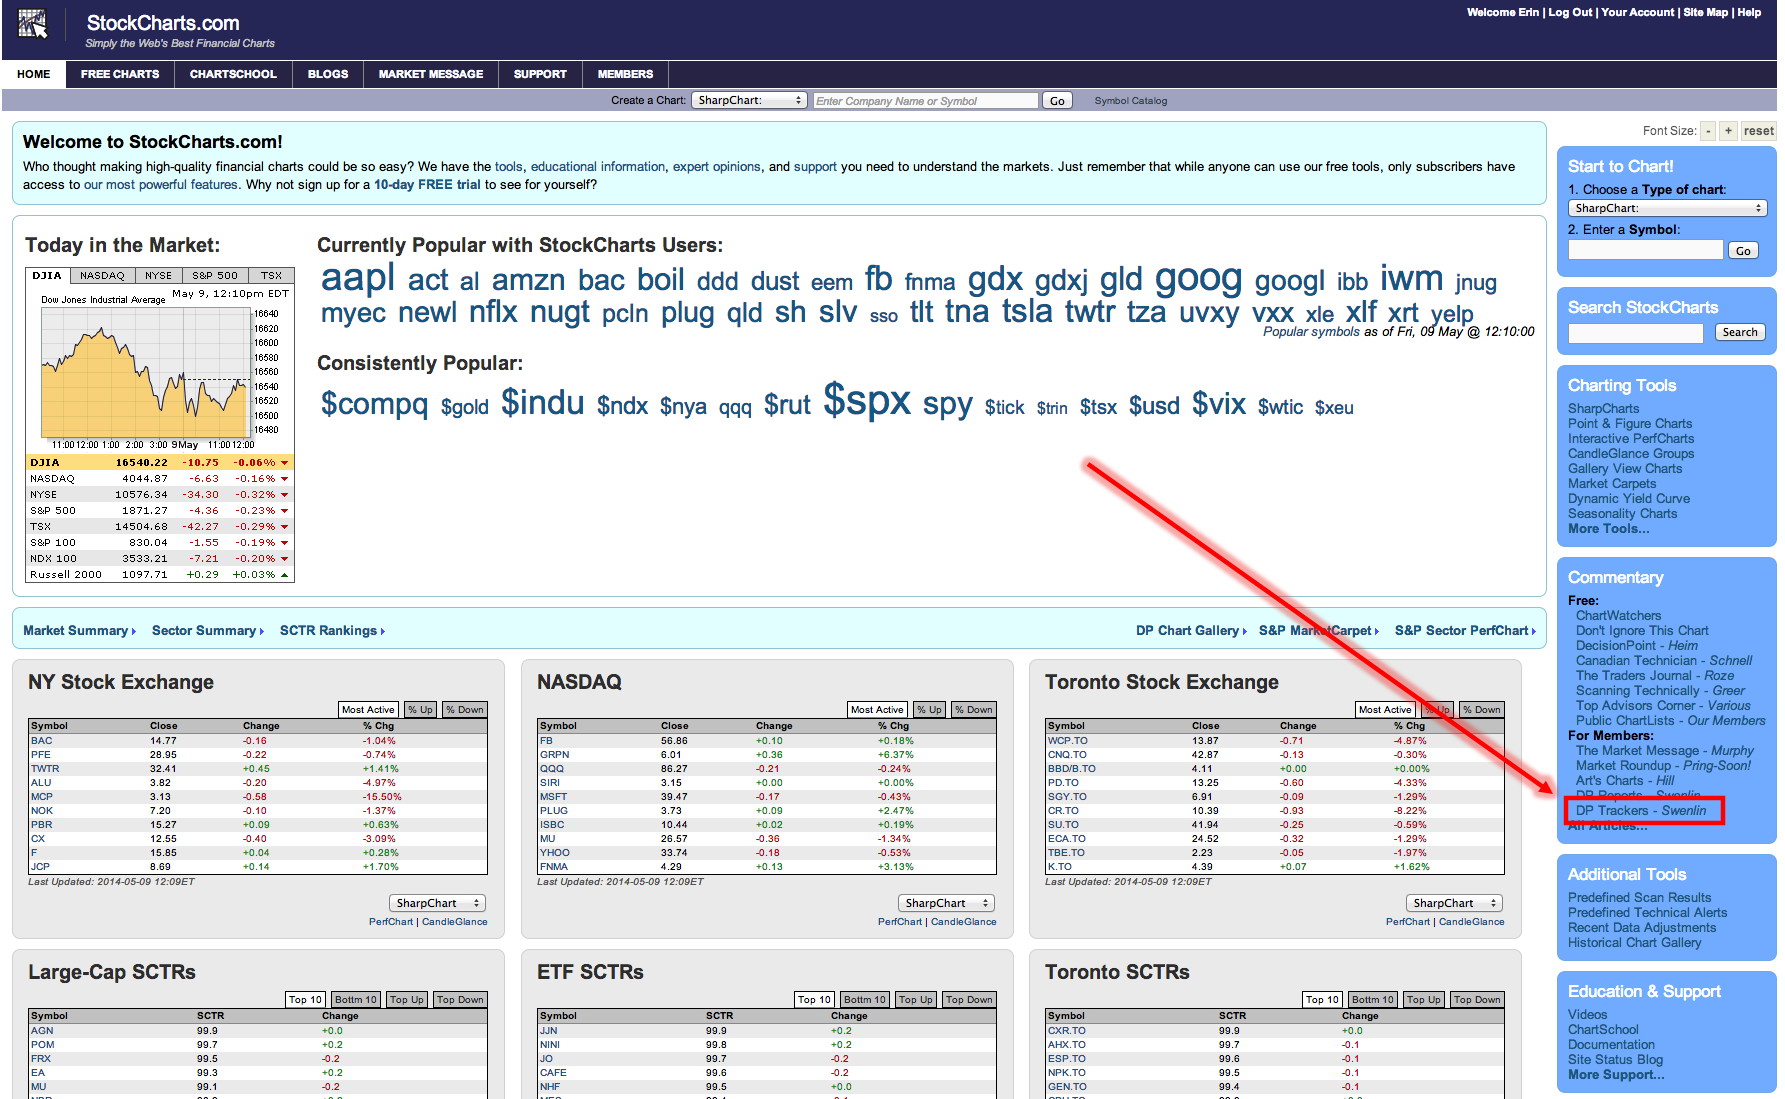
Or you'll find it on the StockCharts.com homepage in the blue "Commentary" box on the right-hand side:
What's in a Trackers report? There are 17 Tracker reports that cover components of the S&P 400, 500 & 600, Nasdaq 100, ETF groups, Rydex and Fidelity mutual funds and more. All of the reports are set up the same way, so let's look at the different sections and how you use them. I'll be using the ETF Lite Tracker report. It doesn't have as many components, so it will be easier to present.
The first section is just a recap of the day's price and percentage changes, volume and what the week-to-date, month-to-date and year-to-date results are.
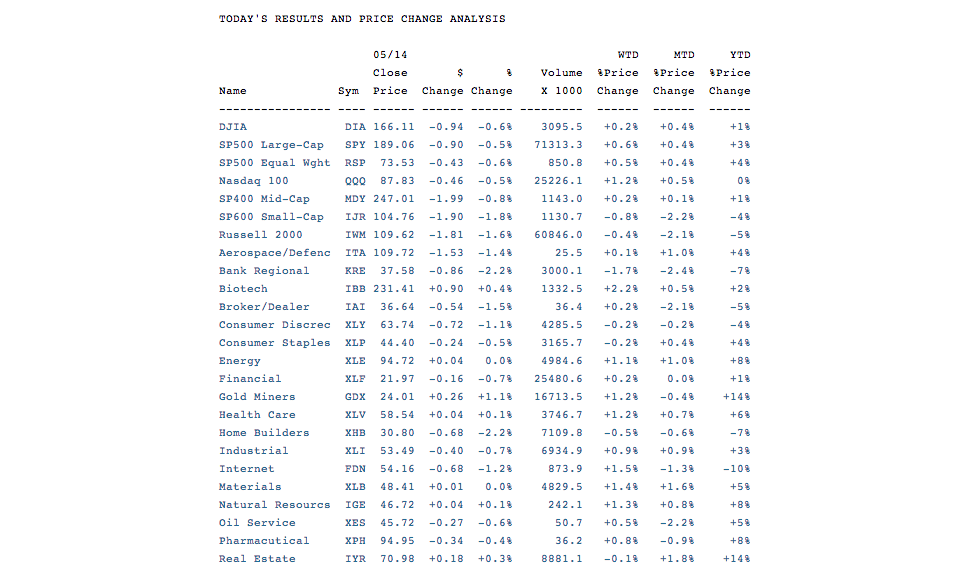
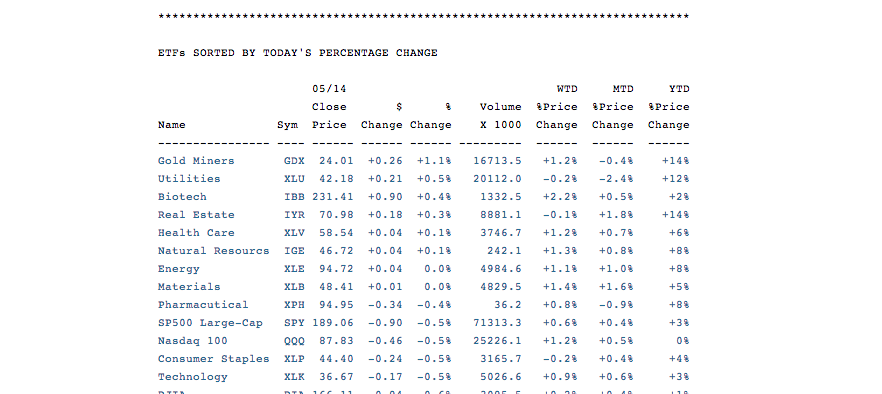
The next section is the same table above only the components are sorted by percentage change on one table. I think this table is especially useful when looking at ETF sectors so you can see who the movers and shakers were for the day based on price.
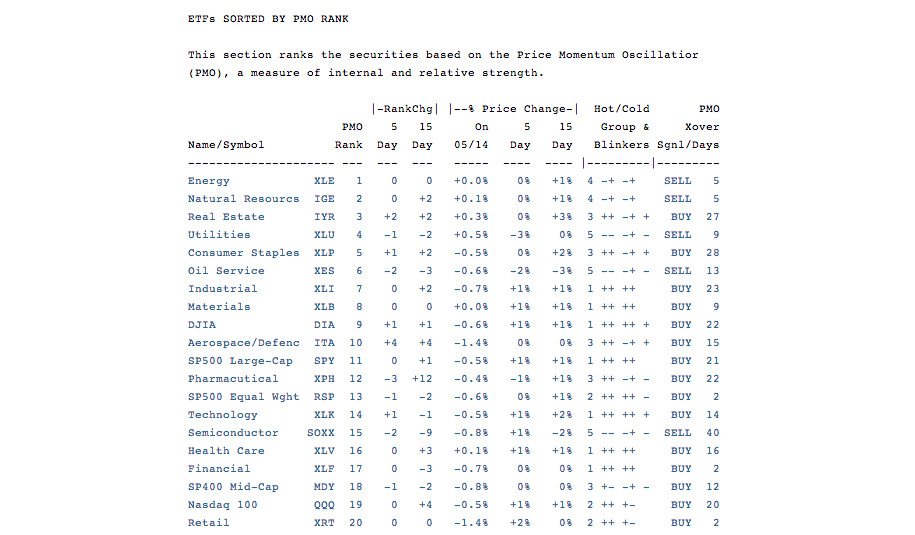
The next section sorts the components by the PMO ranking. The table ranks the ETFs (in this report) by their PMO value. If you study the ChartSchool article on the PMO, you will know that you can compare any stock, index, ETF, etc. against one another using the PMO value because it has been normalized so that a value on an index can be compared directly with the value of another index or stock, etc. The Hot/Cold Group and Blinkers are defined at the bottom of the report, but here is a quick overview.
The groups are on a scale of 1 to 6, with 1 being 'hottest' and 6 being 'coldest'. They are hot or cold based on their internal strength, price strength and rank strength. We can quickly assess the condition of these elements by the group number and "blinker" fields. Moving from left to right: The first blinker tells us if the PMO is above (+) or below (-) its10-day exponential moving average (EMA). The second blinker indicates if the closing price is above (+) or below (-) it's 20-DMA. The third and fourth blinkers tell us if the PMO is rising (+) or falling (-), and if it is above (+) or below (-) zero. The fifth blinker tells us if the 5-day PMO rank change is positive (+), negative (-), or the same ( ).
So if we look at the first row, the Energy ETF is only in group 4, "room temperature" group. The blinkers reading across tell us the PMO is below its 10-EMA and its closing price is above its 20-DMA. The PMO is falling but it is above zero. In the past five days it has not changed rank.
The final column notes when the last PMO BUY or SELL signal was generated. A PMO signal is generated when the PMO crosses above or below it's 10-EMA.
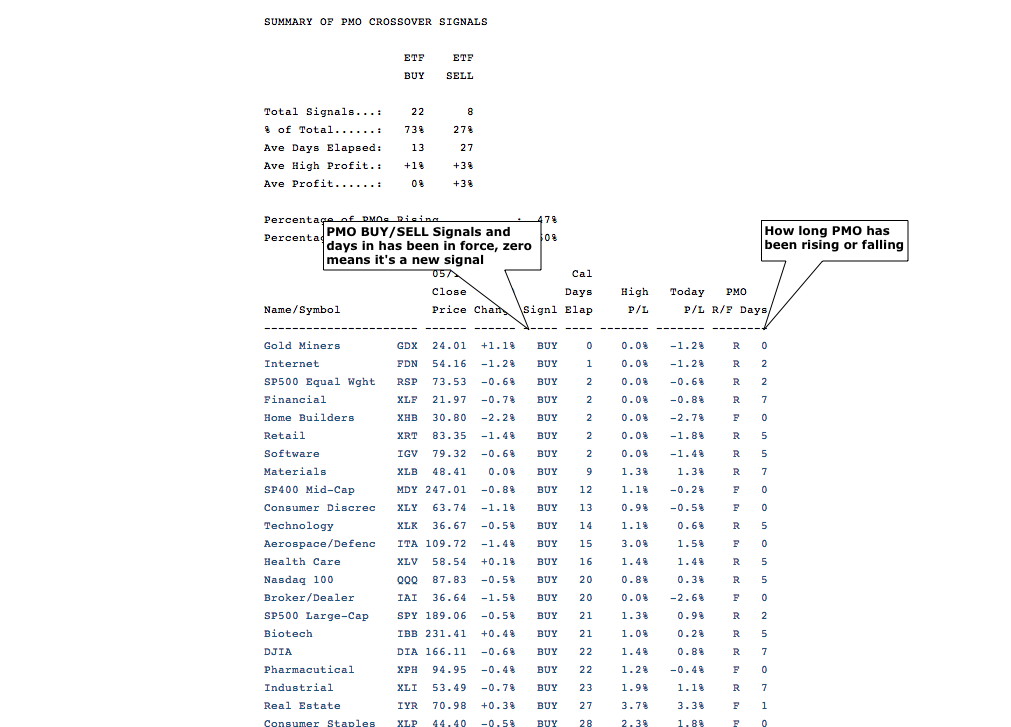
The next table is sorted by the PMO BUY/SELL signals. I find this table to be the most useful on the Tracker report. You can use this to investigate BUY/SELL crossover signal flags on today's new crossovers. The final column is the key in my opinion is especially useful because it tells you how long the PMO has been rising or falling so you can see which may be approaching a new BUY or SELL signal based. You can use this report to look at ETFs that have been strong for some time or even "bottom pick" by looking at the ETFs on a SELL signal but have had a rising momentum for a few days.
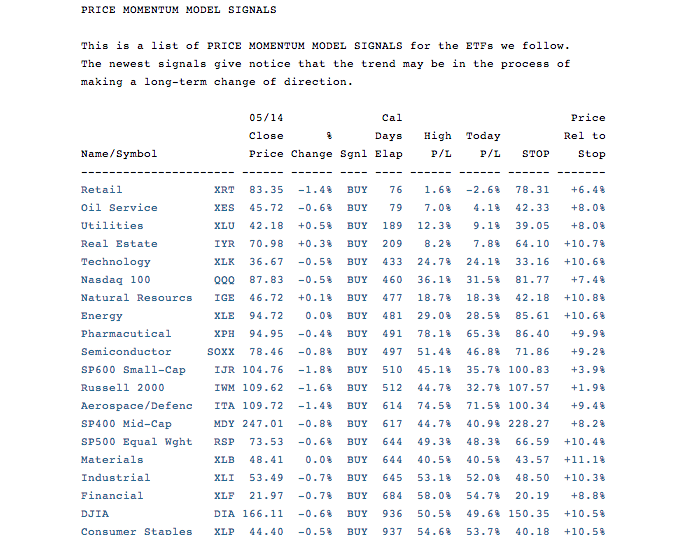
The next table is similar the table above, but this one sorts signals on the Price Momentum Model (PMM). The PMM is intended to catch long-term price moves. Model Signals are mechanically generated by a 200-day exponential moving average crossover in conjunction with a 10% price move in the opposite direction of the current signal extreme. For example, assume that the current signal is a BUY. If the price drops 10% from the signal high, and also drops below the 200-EMA, a SELL Signal will be generated automatically. The last column talks about the price relative to the "stop". This is not exactly the same as the stop you put on your market orders. The "STOP" in this case is the price at which the mechanical PMM signal will reverse.
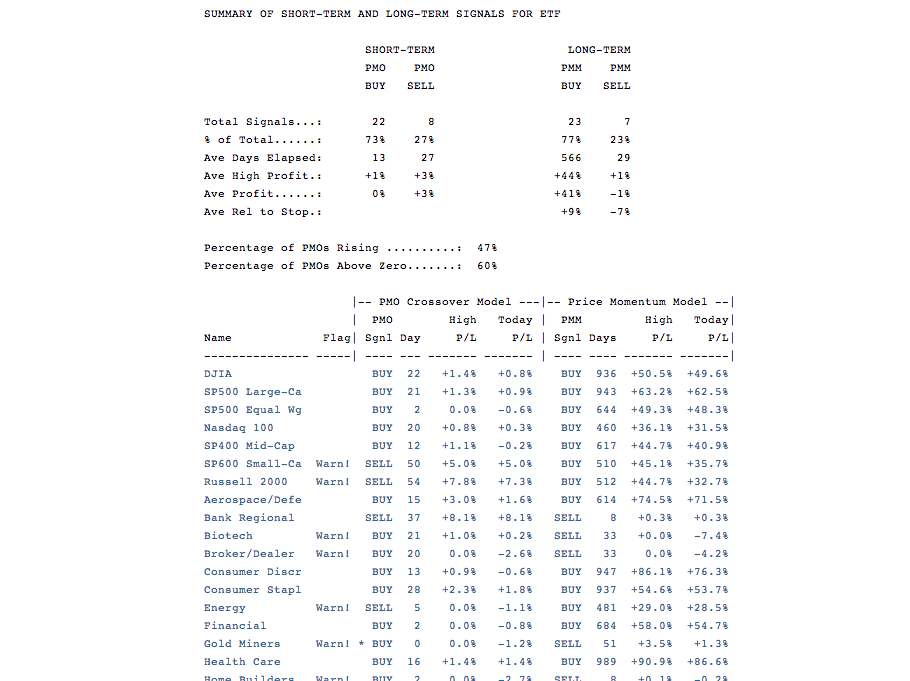
The final section of the report compares the PMO and PMM signals. You may have noticed the "Flags" column. These are defined as follows: When the PMO signal disagrees with the PMM signal, the flag will be "Warn!" On the day the PMO signal changes back into agreement with the PMM signal, the flag will remind that new positions may be considered by indicating "Buy?" or "Sell?"
The DecisionPoint Tracker reports give you a data view rather than a chart view of the components of the major indexes, ETFs, mutual funds, etc. However, one of the great benefits of these reports is that if you see a stock or ETF that catches your eye because of a strength ranking, flag or signal change, just click on that line in the report and the chart will come up for you to visually see whether you have a viable investment opportunity.
Happy Charting!
Erin


